CBC Releases NYC Resident Feedback Survey Results

| Contact: | Carol Kellermann | Maria Doulis |
| 212-279-2605, ext. 322 | 212-279-2605, ext. 316 |
Citizens Budget Commission Citywide Survey Results Find Only 44 Percent of New Yorkers Rate NYC Government Services Positively
New Yorkers Cite Infrastructure, Safety, Housing, and Traffic as Issues Requiring
Greater Attention From City Government
Almost 10,000 New Yorkers Responded
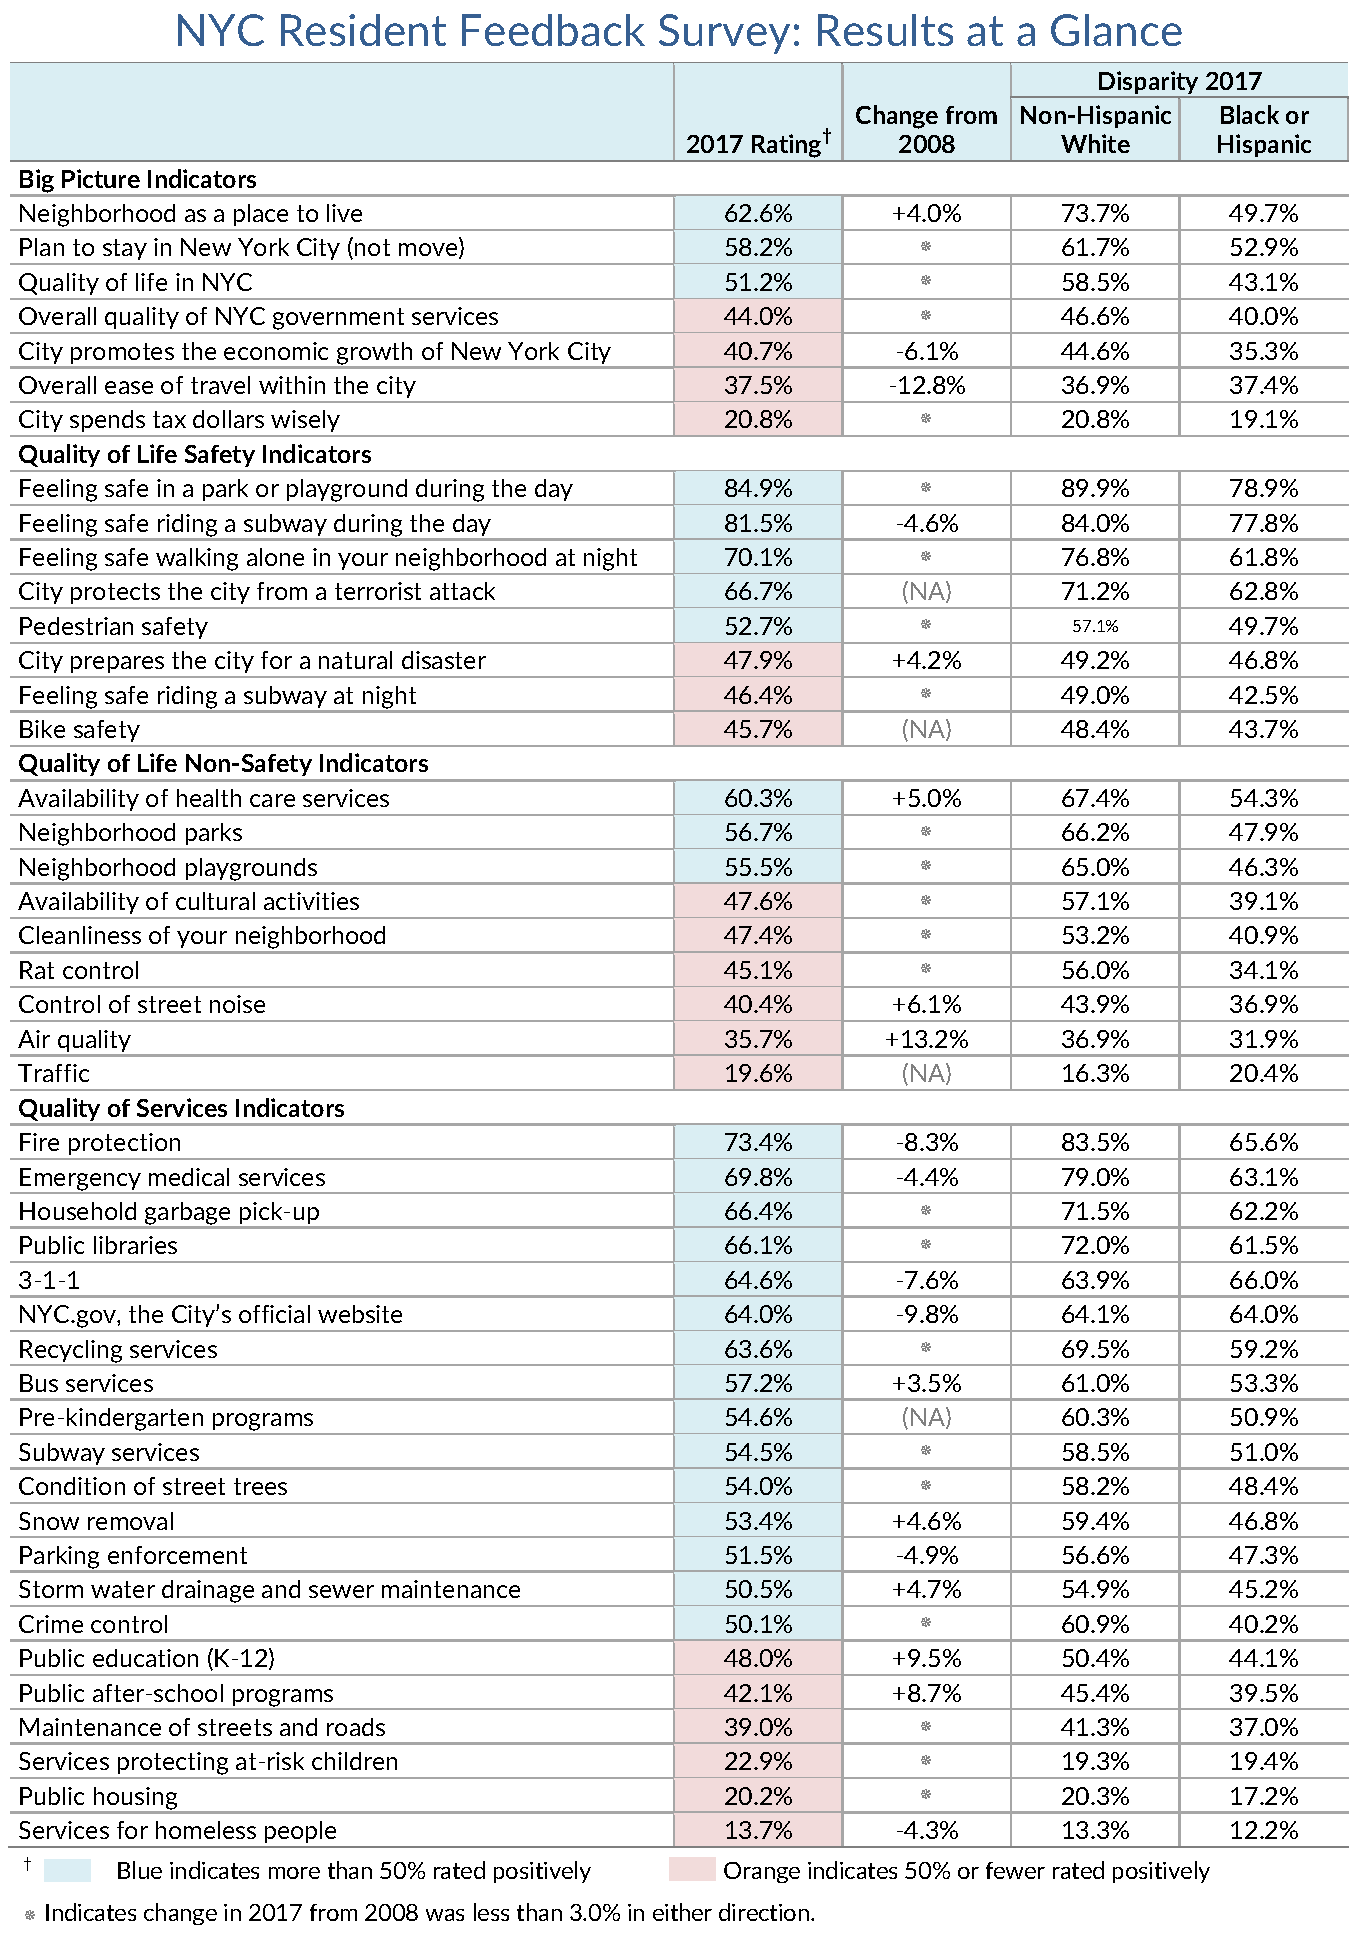
New York, NY – May 16, 2017 – The Citizens Budget Commission (CBC) today released summary results of its “NYC Resident Feedback Survey” gauging New York City residents’ satisfaction with municipal services and the quality of life in their neighborhoods and citywide.
In order to assess changes in New Yorkers’ views over time, CBC retained the same research firm and used a nearly identical survey as employed by the City of New York to conduct a citywide feedback survey in 2008.
Services Needing the Most Improvement
CBC has long advocated for regular citywide surveys as an integral tool of performance measurement and budgeting. The results provide guidance to city leaders on which services most need improvement.
Only 44 percent of New Yorkers rate municipal services overall as excellent or good. Among services, New Yorkers are least satisfied with public education, street maintenance and traffic, and the social safety net.
Service Quality: NYC Services with Which
Residents Are Dissatisfied
| Service | Percent Rating Good or Excellent |
|---|---|
| Public education (K-12) | 48% |
| Public after-school programs | 42% |
| Maintenance of streets and roads | 39% |
| Services protecting at-risk children | 23% |
| Public housing | 20% |
| Services for homeless people | 14% |
In addition, respondents were asked to write in what they considered the three most important issues requiring greater attention from City government: infrastructure, safety, housing, and traffic/mobility were the most frequent responses.
The findings underscore the results of the CBC Competitiveness Scorecard, released in September 2016, which identified affordability and lengthy commutes as key weaknesses in the city’s quality of life.
Quality of Life Results
The results reveal most New Yorkers are satisfied with their neighborhoods, but less satisfied with the overall quality of life in the city: 63 percent of respondents rate their neighborhoods as excellent or good places to live, while 51 percent rate the city positively.
Fully 18 percent plan to leave the city within the next five years.
Residents are dissatisfied with traffic, air quality, noise and rat control, neighborhood cleanliness, availability of cultural facilities in their neighborhood, bike safety, nighttime subway safety, and emergency preparedness.
Quality of Life: Indicators with Which
Residents Are Dissatisfied
| Indicator | Percent Rating Good or Excellent |
|---|---|
| City prepares for a natural disaster | 48% |
| Feeling safe riding a subway at night | 46% |
| Bike safety | 46% |
| Availability of cultural activities | 48% |
| Cleanliness of your neighborhood | 47% |
| Rat control | 45% |
| Control of street noise | 40% |
| Air quality | 36% |
| Traffic | 20% |
Change Since 2008
A nearly identical survey was conducted by the City of New York in 2008, providing a basis to assess change. Of 41 indicators that could be compared to 2008 (of a total of 45 indicators), ratings improved on 10 indicators and declined on 9 indicators. Ratings of overall quality of life and services citywide were unchanged.
| Biggest Gains | Change from 2008 | Biggest Declines | Change from 2008 |
|---|---|---|---|
| Air quality | 13% | City promotes economic growth | -6% |
| Public education (K-12) | 10% | 311 | -8% |
| Public after-school programs | 9% | Fire protection | -8% |
| Control of street noise | 6% | NYC.gov | -10% |
| Availability of health care services | 5% | Overall ease of travel within the city | -13% |
Racial Disparities
The results reveal disparities in ratings between white Non-Hispanic residents and Hispanic and Black residents, as well as substantial variation by borough. White residents are generally more satisfied than Hispanic and Black residents; on 13 of 45 indicators, the disparities in ratings exceed 12 percentage points. For example, 74 percent of White residents are satisfied with their neighborhood as a place to live compared to 50 percent of Hispanic and Black residents.
Borough Disparities
Generally, Manhattan residents are the most satisfied: 50 percent or more residents are satisfied on 31 of 45 measures. Queens and Staten Island residents are satisfied on 27 indicators, and Brooklyn residents are satisfied on 24 indicators. Bronx residents are the least satisfied, rating only rate 14 of 45 indicators positively.
More About the Survey
The CBC survey was conducted by National Research Center, a respected survey research organization that administered the 2008 survey. The survey was mailed to a random sample of 72,000 households, of which 9,800 adults, or 13 percent, responded. The results, appropriately weighted for city demographic characteristics, have a margin of error of +/-1 percent citywide and up to +/- 5 percent for each borough.
A summary of citywide and borough survey results follows this press release, and a full report is available at www.cbcny.org. Community district results will be reported separately in a few weeks. CBC encourages New Yorkers to share the results on social media using #NYCFeedback.
“This survey is an important management tool that highlights the areas where the City’s quality of life and services need improvement,” said CBC President Carol Kellermann. “The Mayor’s Office should use this valuable data to guide changes to policies and services.”
“Residents know the city best, and their feedback is important to managing the city well and keeping New York competitive as a place to live and work,” said CBC Vice President Maria Doulis.
For further information, contact Kevin Medina at [email protected] or 212-279-2605 x342.