4 Facts About New York’s Transportation Emissions
New York State’s Climate Leadership and Community Protection Act (CLCPA) of 2019 establishes ambitious goals to reduce statewide greenhouse gas (GHG) emissions by 40 percent from 1990 levels by 2030 and by 85 percent by 2050.1 As the State implements policies to meet these ambitious targets, shrinking emissions from transportation will be vitally important. The transportation sector in New York is responsible for the largest share of the state’s total annual carbon dioxide (CO2) emissions. Furthermore, in contrast to most other sectors that are becoming more efficient and reducing their GHG emissions, transportation emissions continue to increase.2
The following four facts should undergird and help focus New York’s policies to reduce transportation emissions.
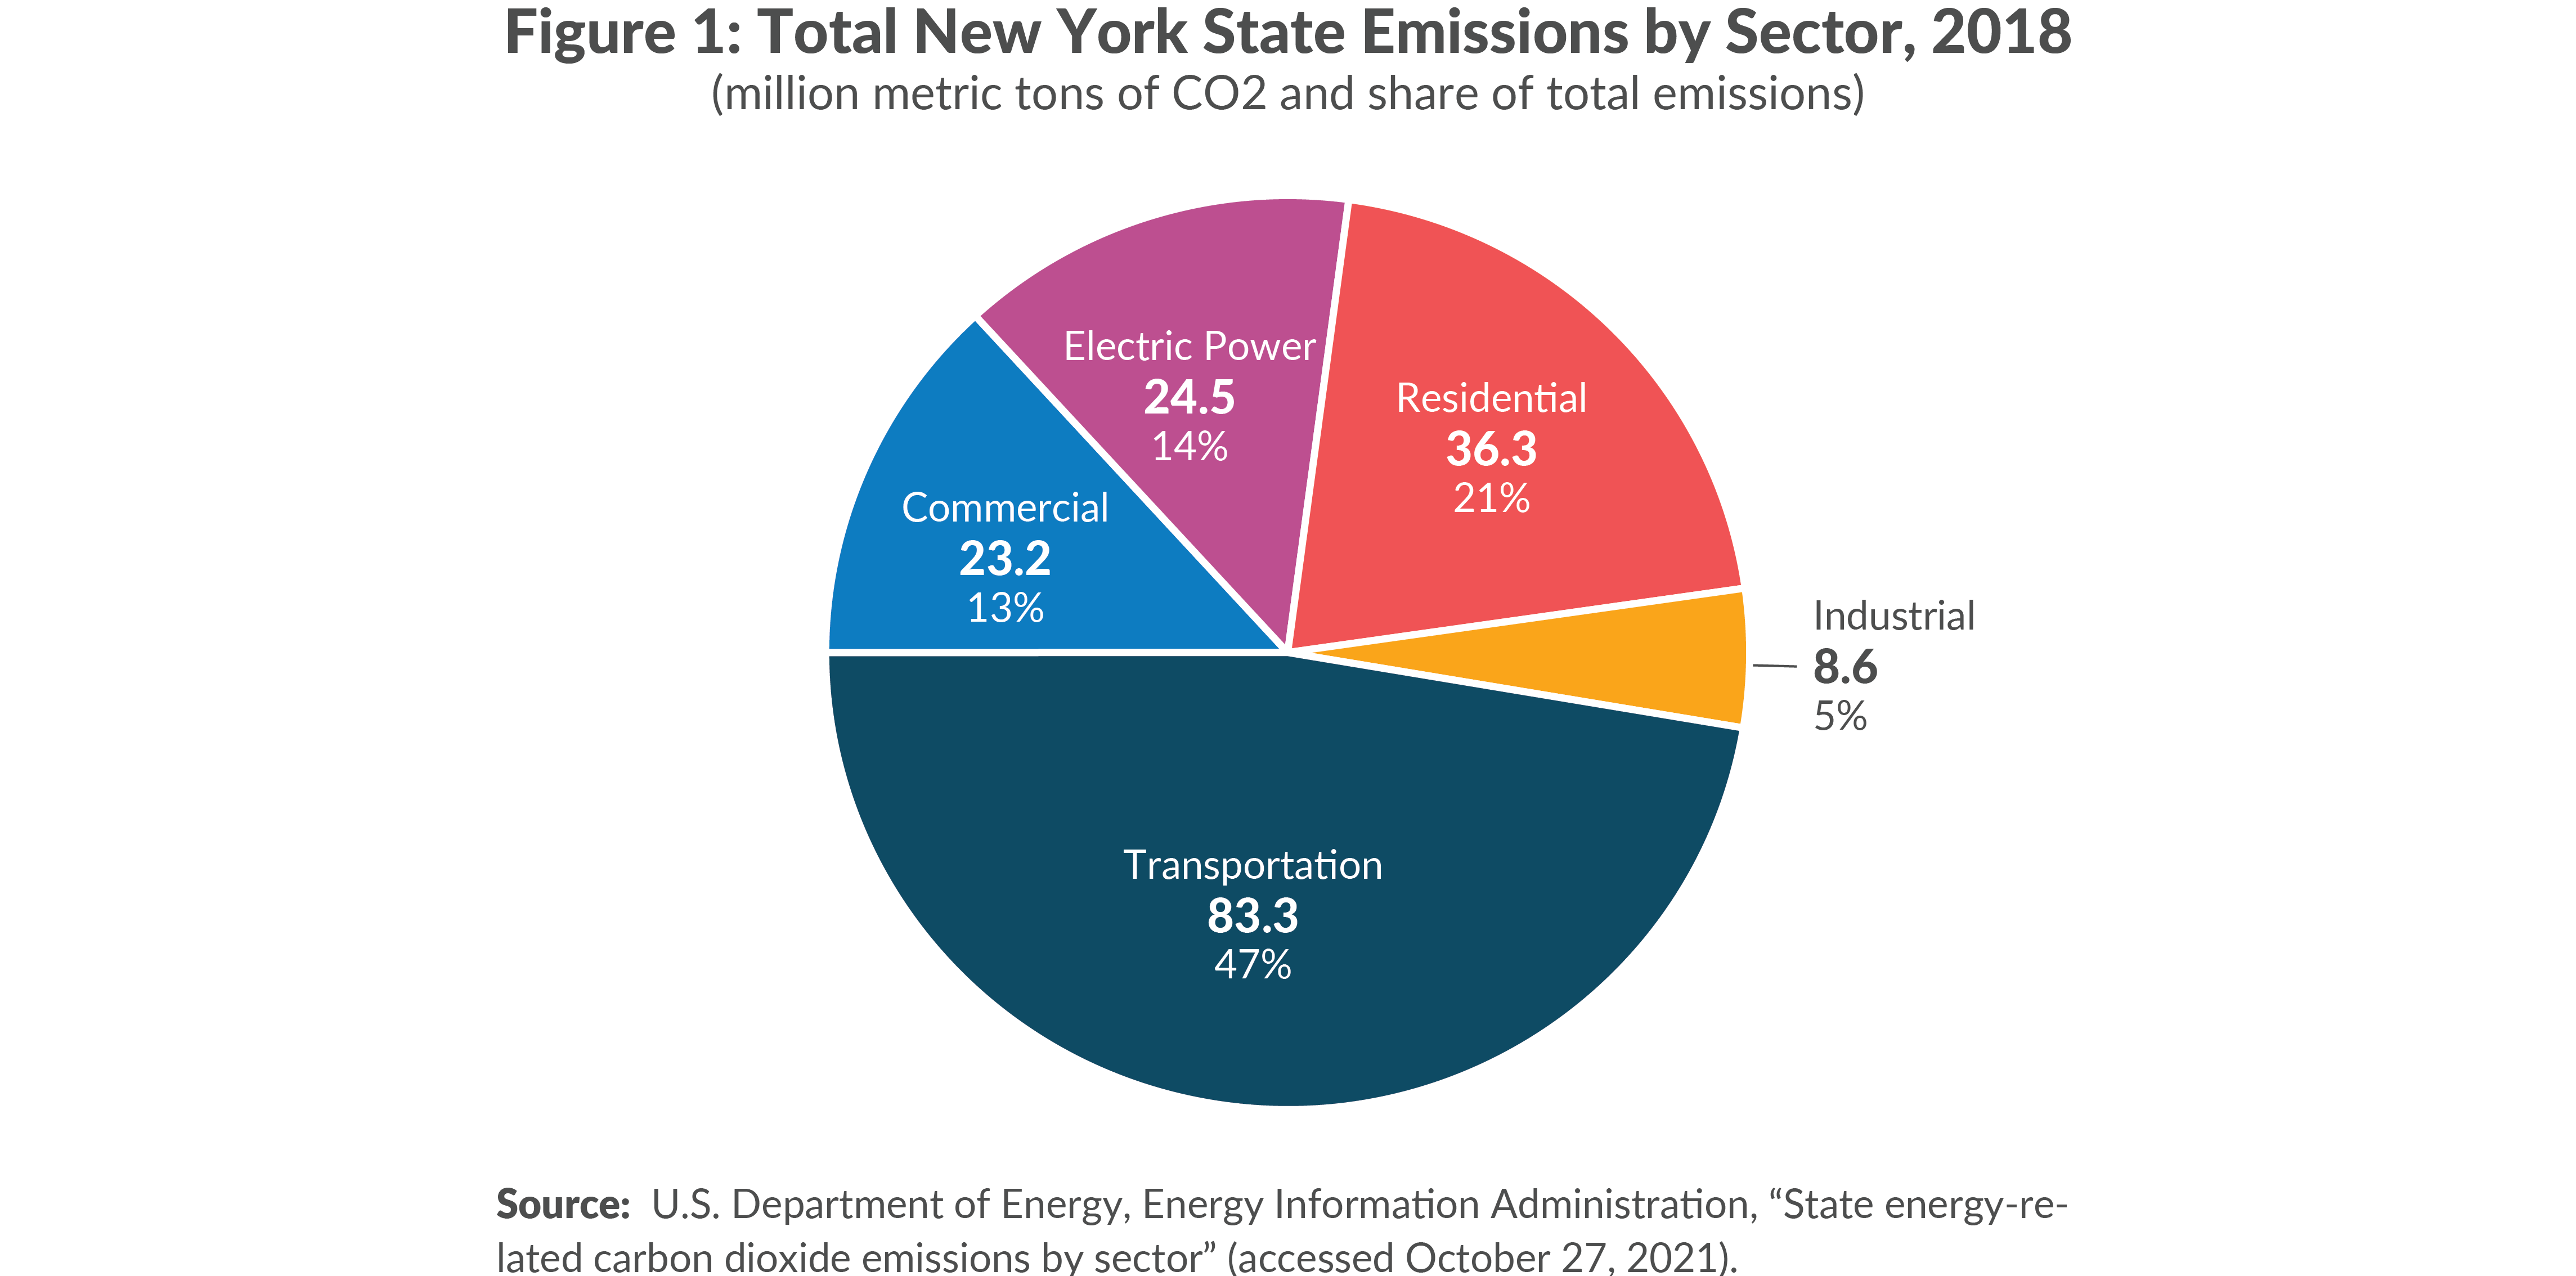
1. The Transportation Sector Accounts for 47 Percent of New York State’s CO2 Emissions
According to the United States Department of Energy (DOE), New York State (NYS) contributed 175.9 million metric tons (MMT) of CO2 into the atmosphere in 2018, the year with the most recent data available.3 The transportation sector, which includes energy consumption of vehicles whose primary purpose is transporting people or goods, including personal vehicles, subways, rail, aircraft, and ships, generated the plurality of these emissions, 83.3 MMT of CO2 or 47 percent. (See Figure 1.) The state’s transportation emissions are more than double the next largest sector, residential real estate, which includes energy consumption in living quarters for private households, mostly from heating, air conditioning, lighting, and refrigeration. The three other sectors are: electric power (emissions from electric and combined heat and power plants); commercial (energy consumption for service-providing facilities such as heating and electricity for businesses, government buildings, or nonprofit organizations); and industrial (energy consumed by facilities and equipment used for producing, processing, or assembling goods in the state for manufacturing, agriculture, construction, and other industries).4
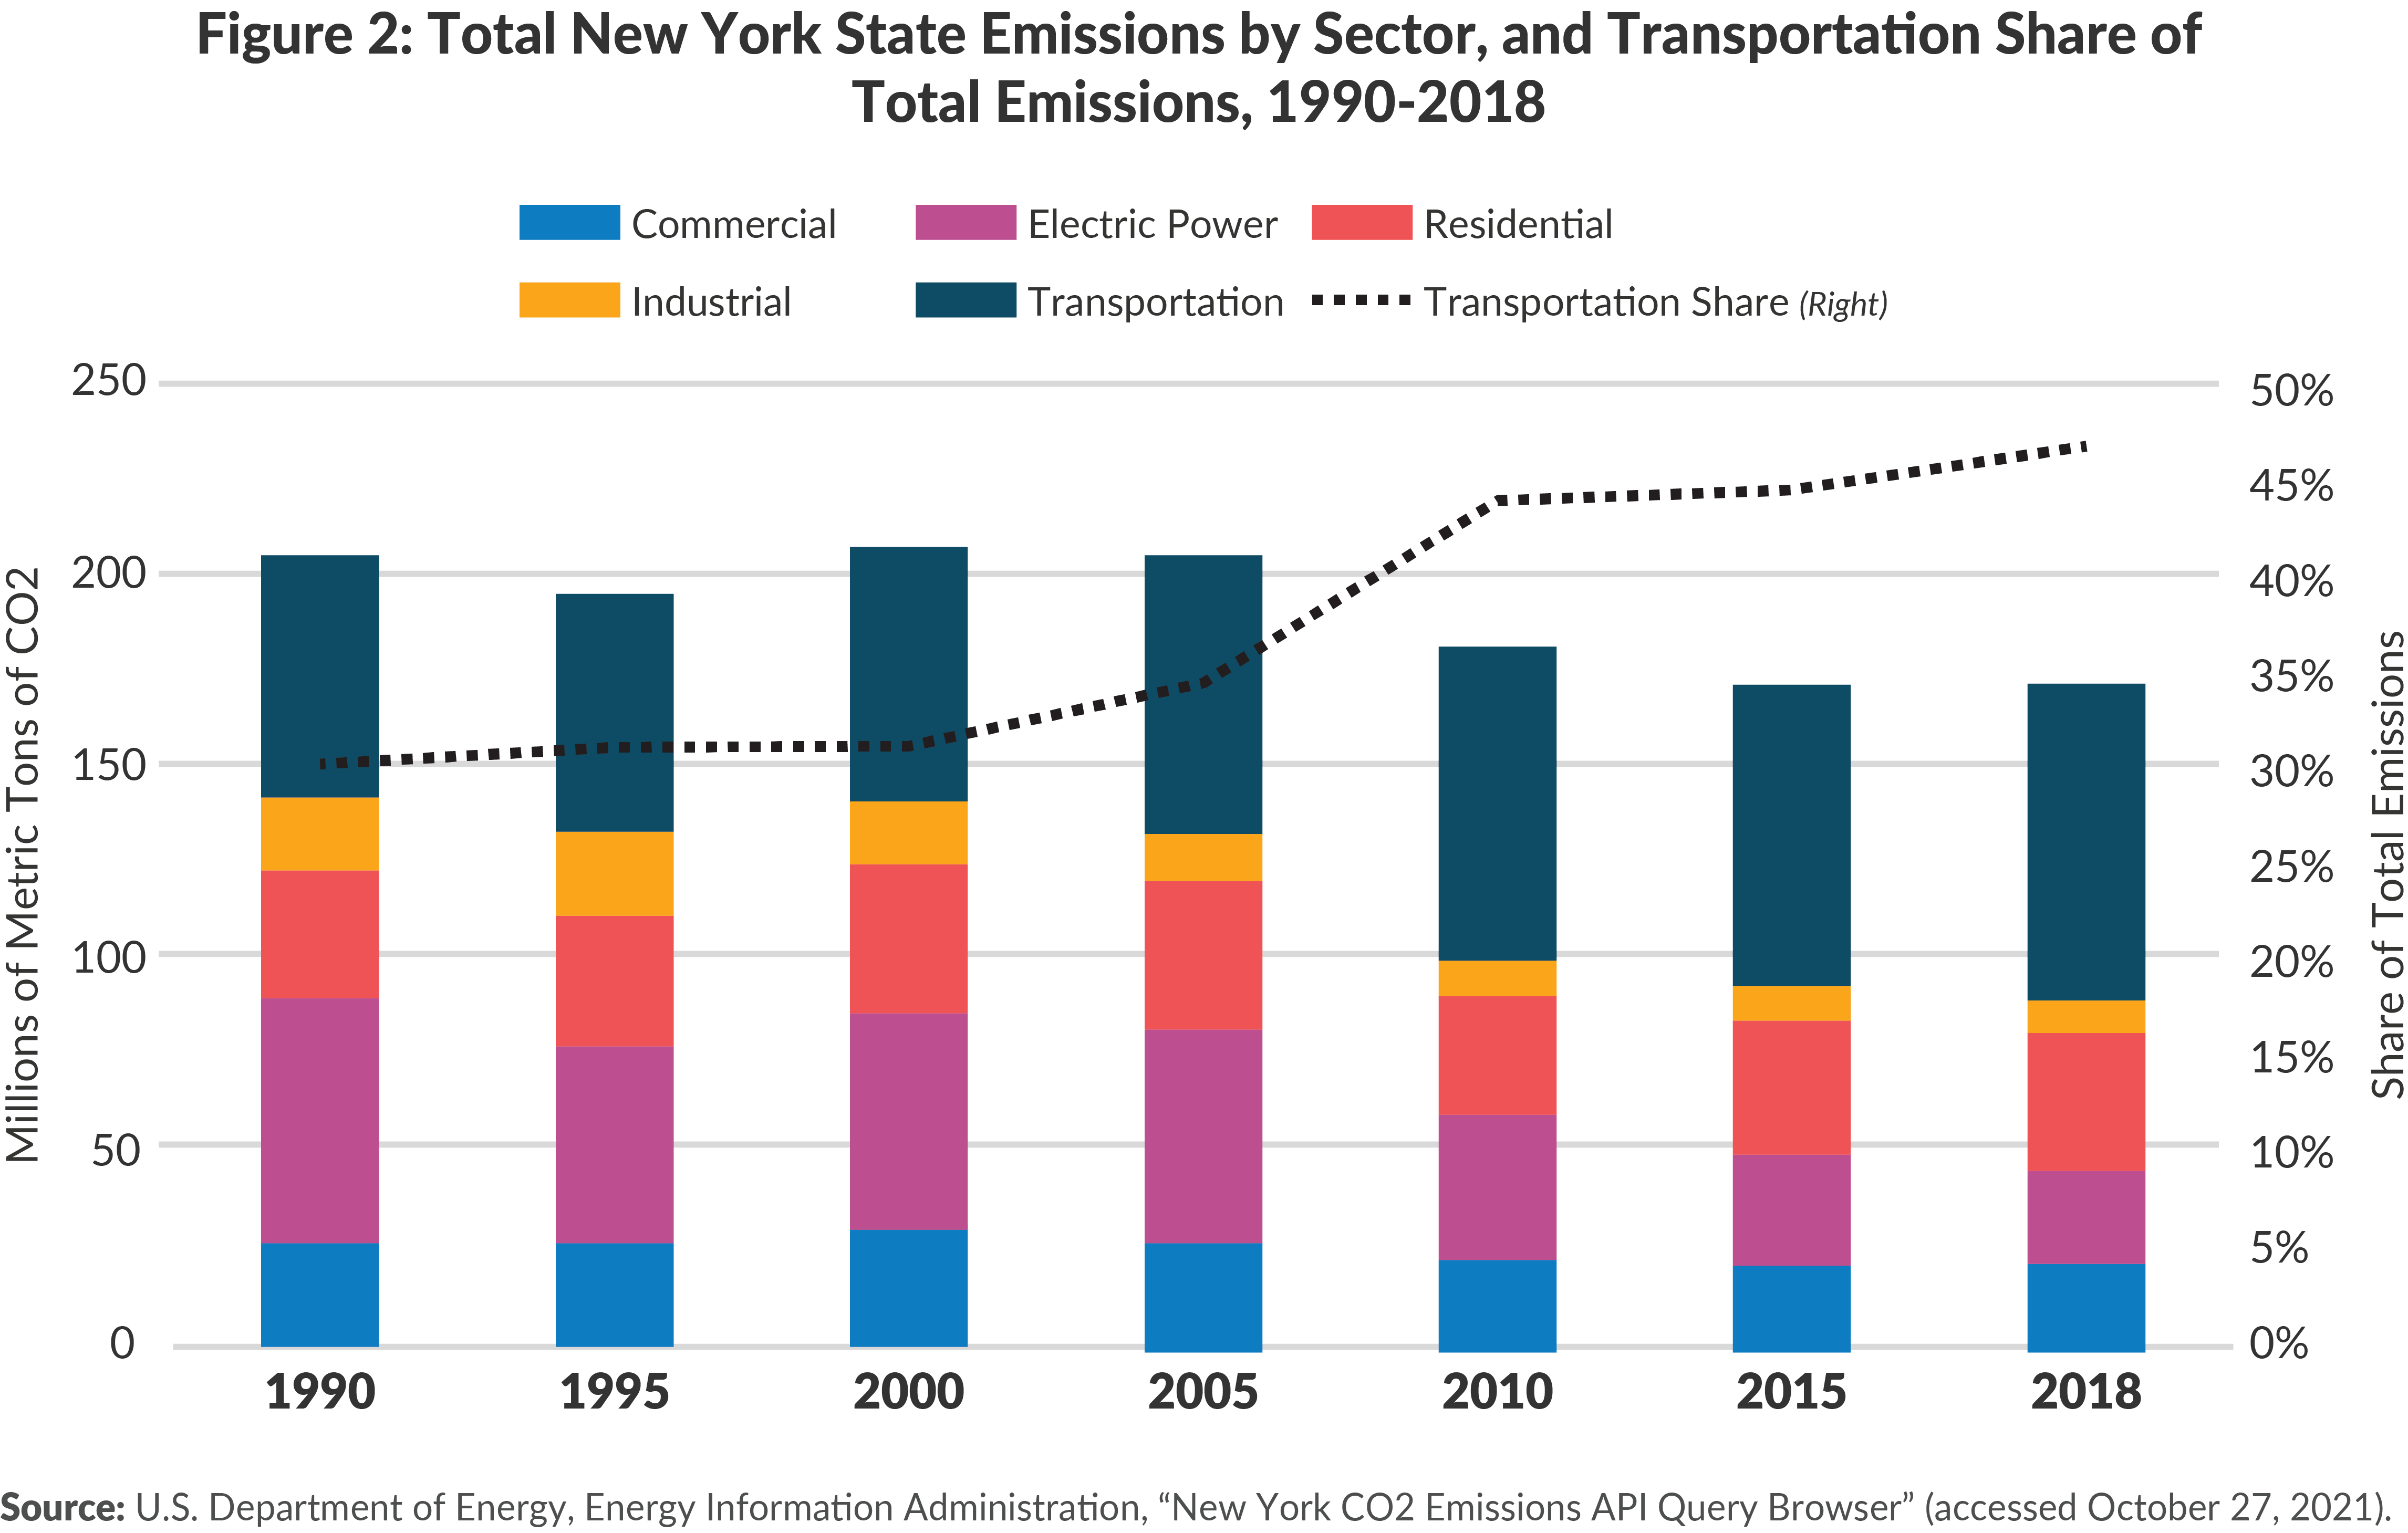
2. Between 1990 and 2018, Total Emissions Declined 17 Percent and Transportation Emissions Increased 31 Percent, Increasing Transportation’s Share from 31 Percent to 47 Percent
Between 1990 and 2018, total CO2 emissions in New York State declined from 208.2 MMT to 175.9 MMT. Total emissions in NYS peaked in 2000 at 211.8 MMT, and have declined 17 percent since. Emissions from every sector in the state declined except for the transportation and residential sectors.5 Emissions from the electric power sector declined the most, 62 percent, from 64.5 MMT to 24.5 MMT. (See Figure 2.) While residential emissions increased 8 percent over the period, transportation emissions rose significantly, 31 percent, from 63.8 MMT to 83.3 MMT. As a result, the transportation sector’s share of total state emissions increased markedly over three decades, from 31 percent in 1990 to 47 percent in 2018.6
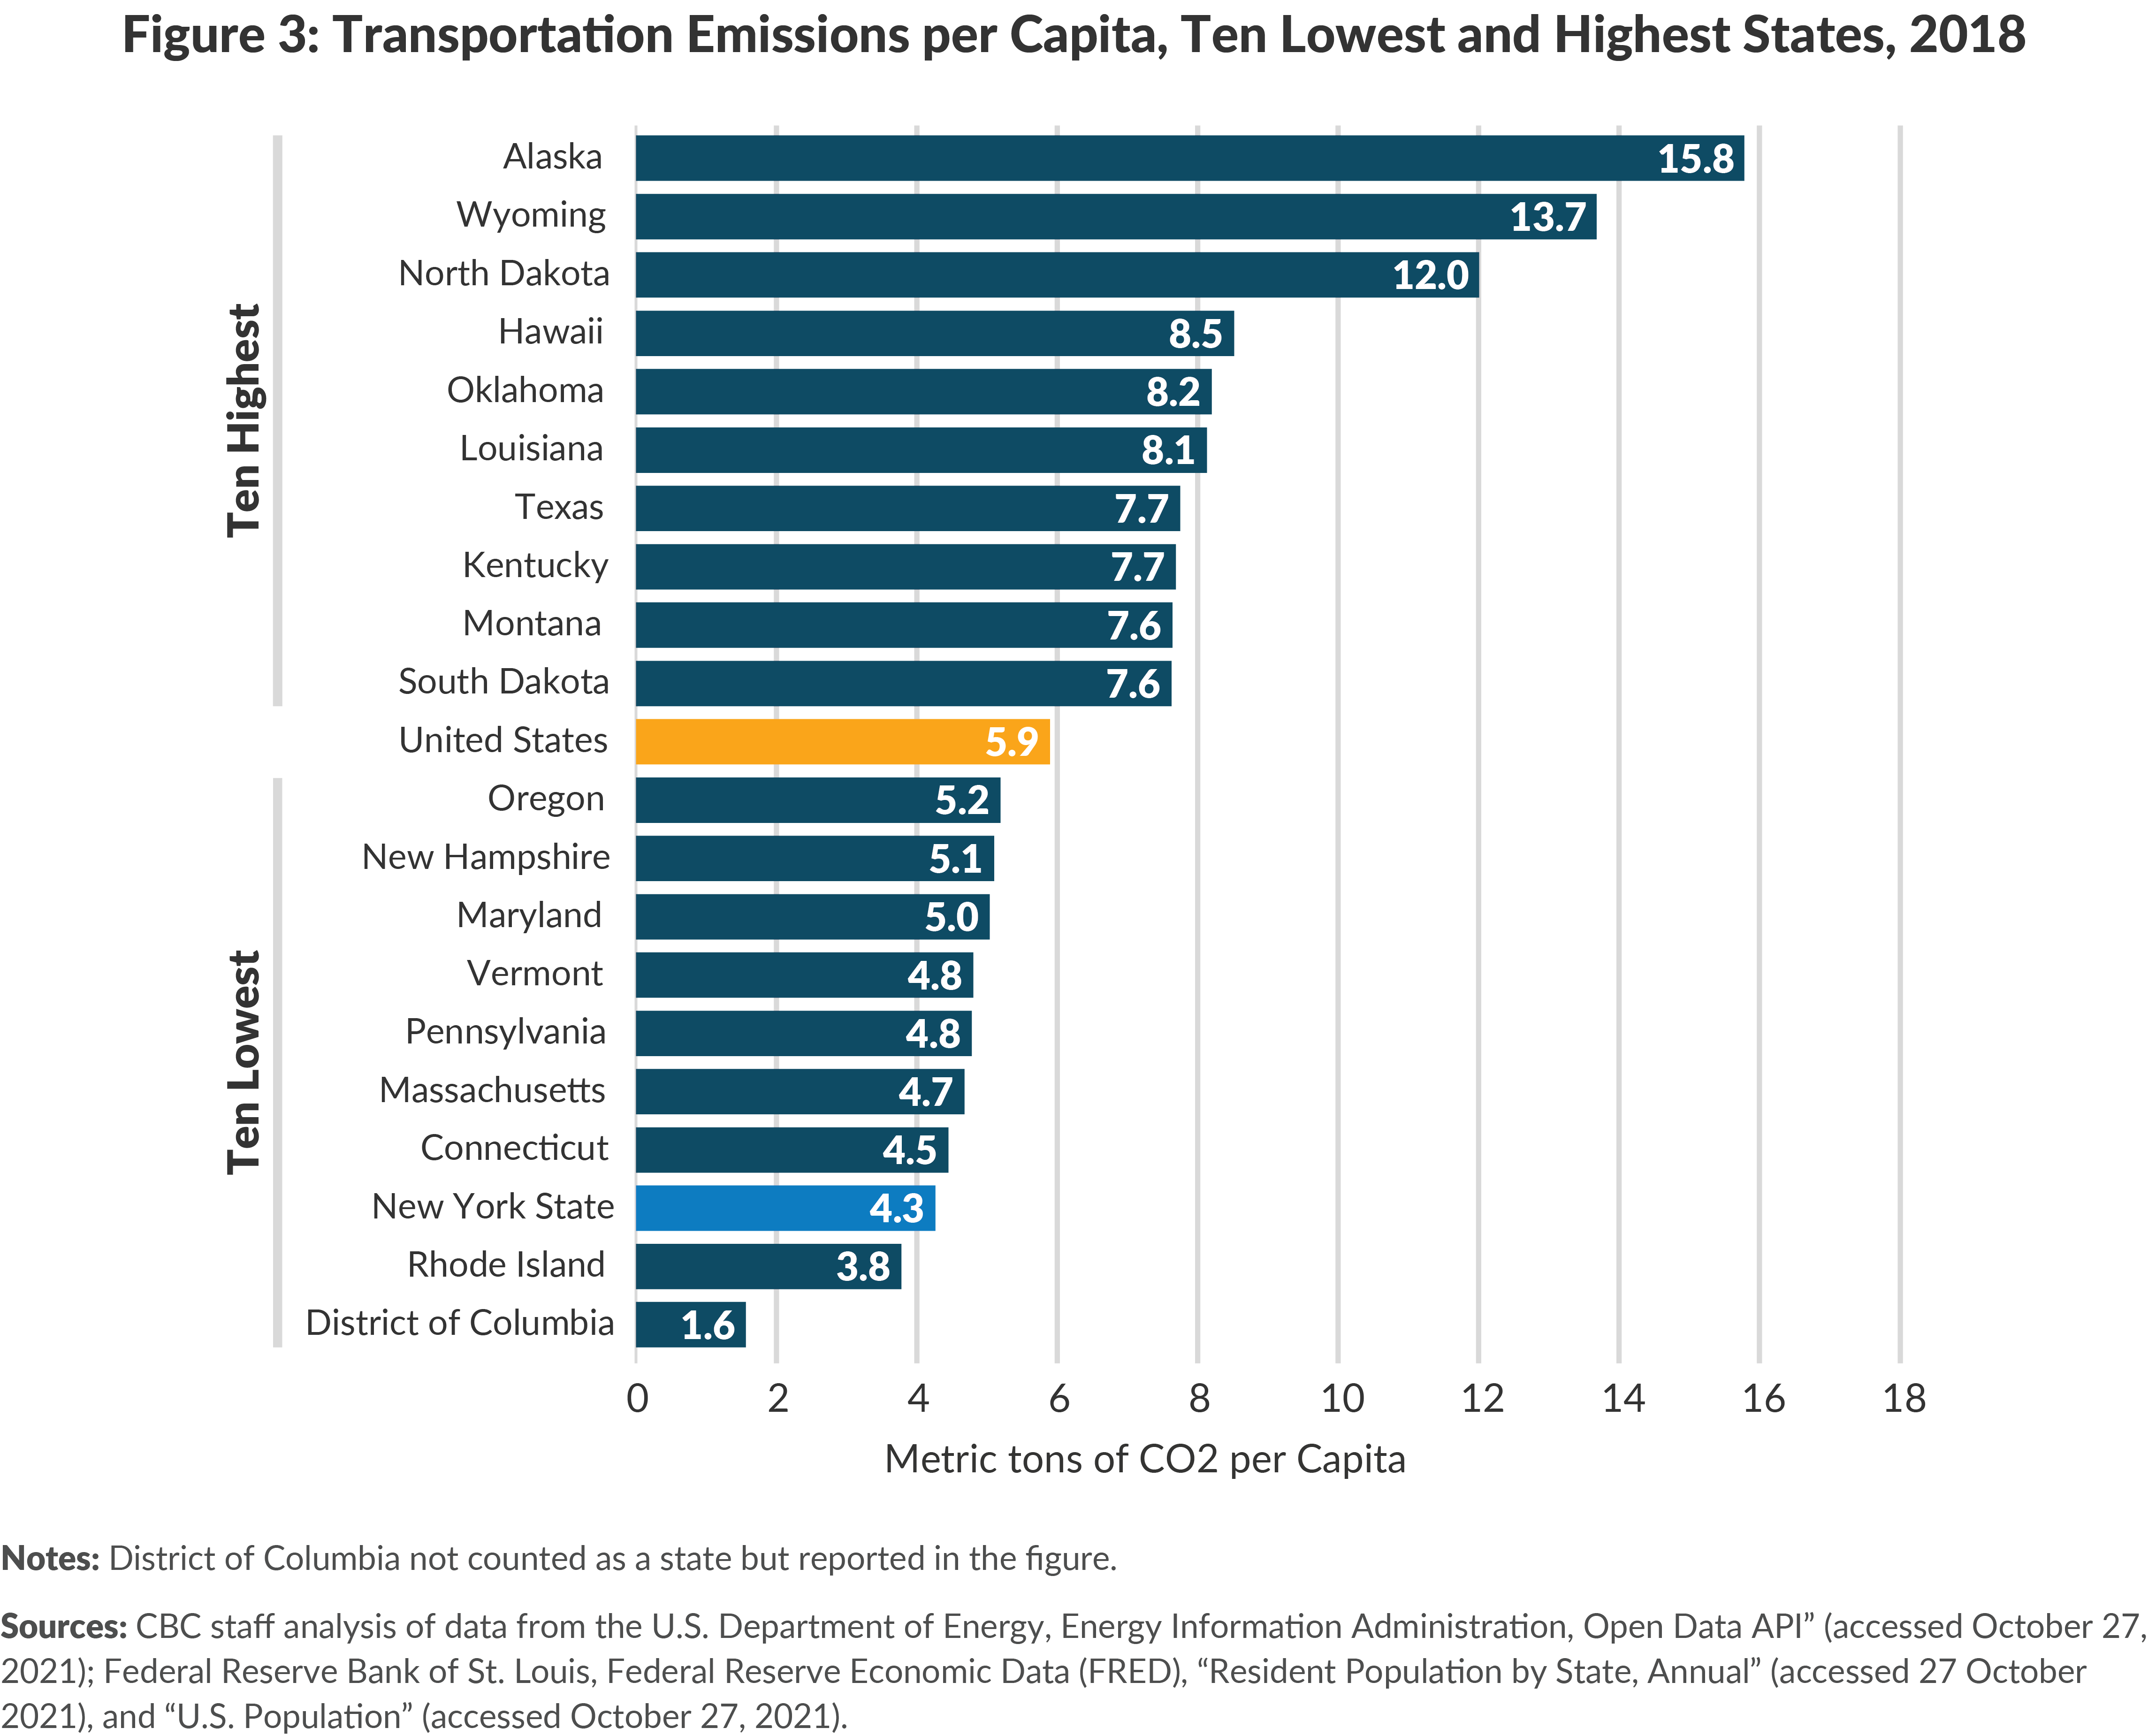
3. New York’s Transportation Emissions per Capita are 27 Percent Below the National Level and Second Lowest Among U.S. States
Even though transportation is its largest source of GHG emissions, NYS ranks very favorably compared to other U.S. states on a per capita basis. (See Figure 3.) Due to the high relative use of mass transit downstate, transportation emissions per capita are relatively low: 4.3 metric tons of CO2 per capita in 2018, 27 percent below the national per capita of 5.9 metric tons.7 NYS also ranks second lowest of any state in the U.S. Only Rhode Island and Washington, D.C. have lower per capita transportation emissions. New York State’s low per capita emissions are primarily driven by New York City, where transportation emissions are 1.9 metric tons per capita.8
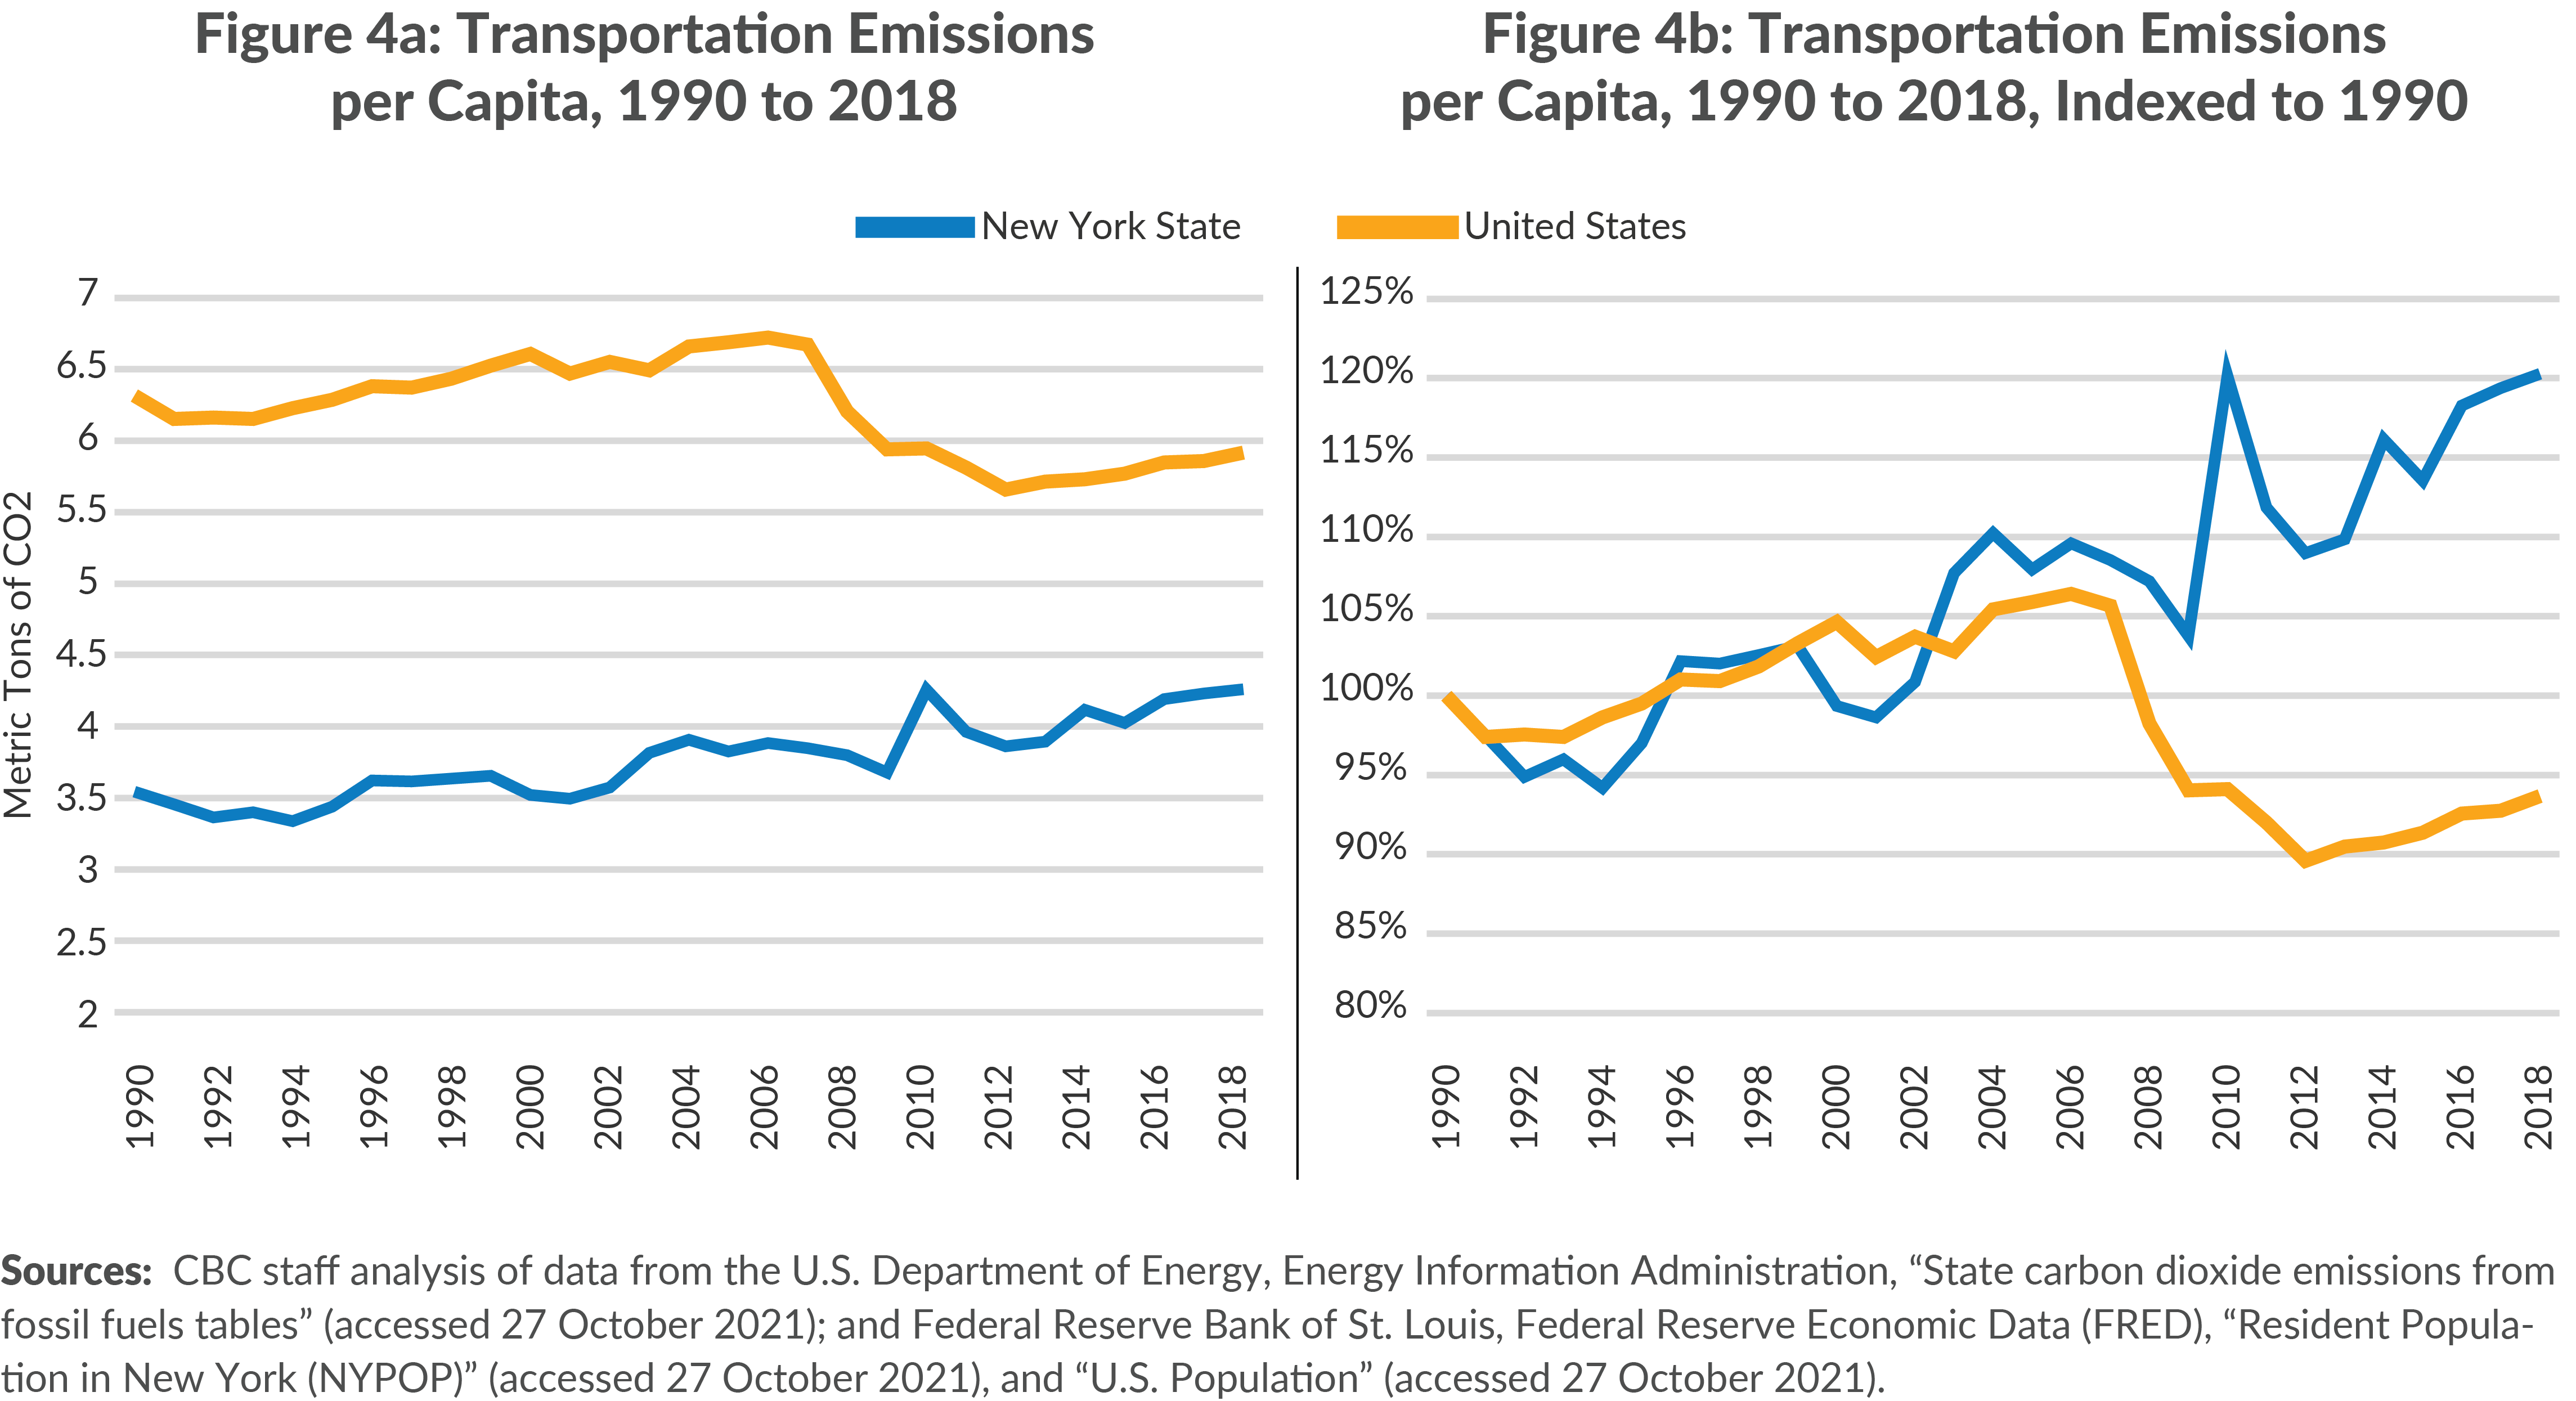
While New York’s per capita transportation emissions are comparatively low, its upward trend makes meeting its GHG reduction targets more challenging. (See Figure 4a and 4b.) Notably, the long-term decline in national per capita emissions was not mirrored in New York. From 1990 to 2018, emissions per capita increased 23 percent in New York but decreased 5 percent nationally. From 1990 to 2007, NYS and U.S. transportation emissions per capita moved in tandem, increasing modestly, by 9 percent and 6 percent, respectively. Since 2007, trends have diverged. Between 2007 and 2012, national transportation emissions per capita declined 15 percent, from 6.7 metric tons to 5.7 metric tons, before increasing to 5.9 metric tons in 2018. NYS’s per capita transportation emissions generally had an upward trajectory from 2007 to 2018, increasing 13 percent from 3.8 metric tons to 4.3 metric tons.9
4. Transportation Emissions in New York State are Rising Due to Persistent Use of Motor Gasoline and Increased Consumption of Aviation Fuels
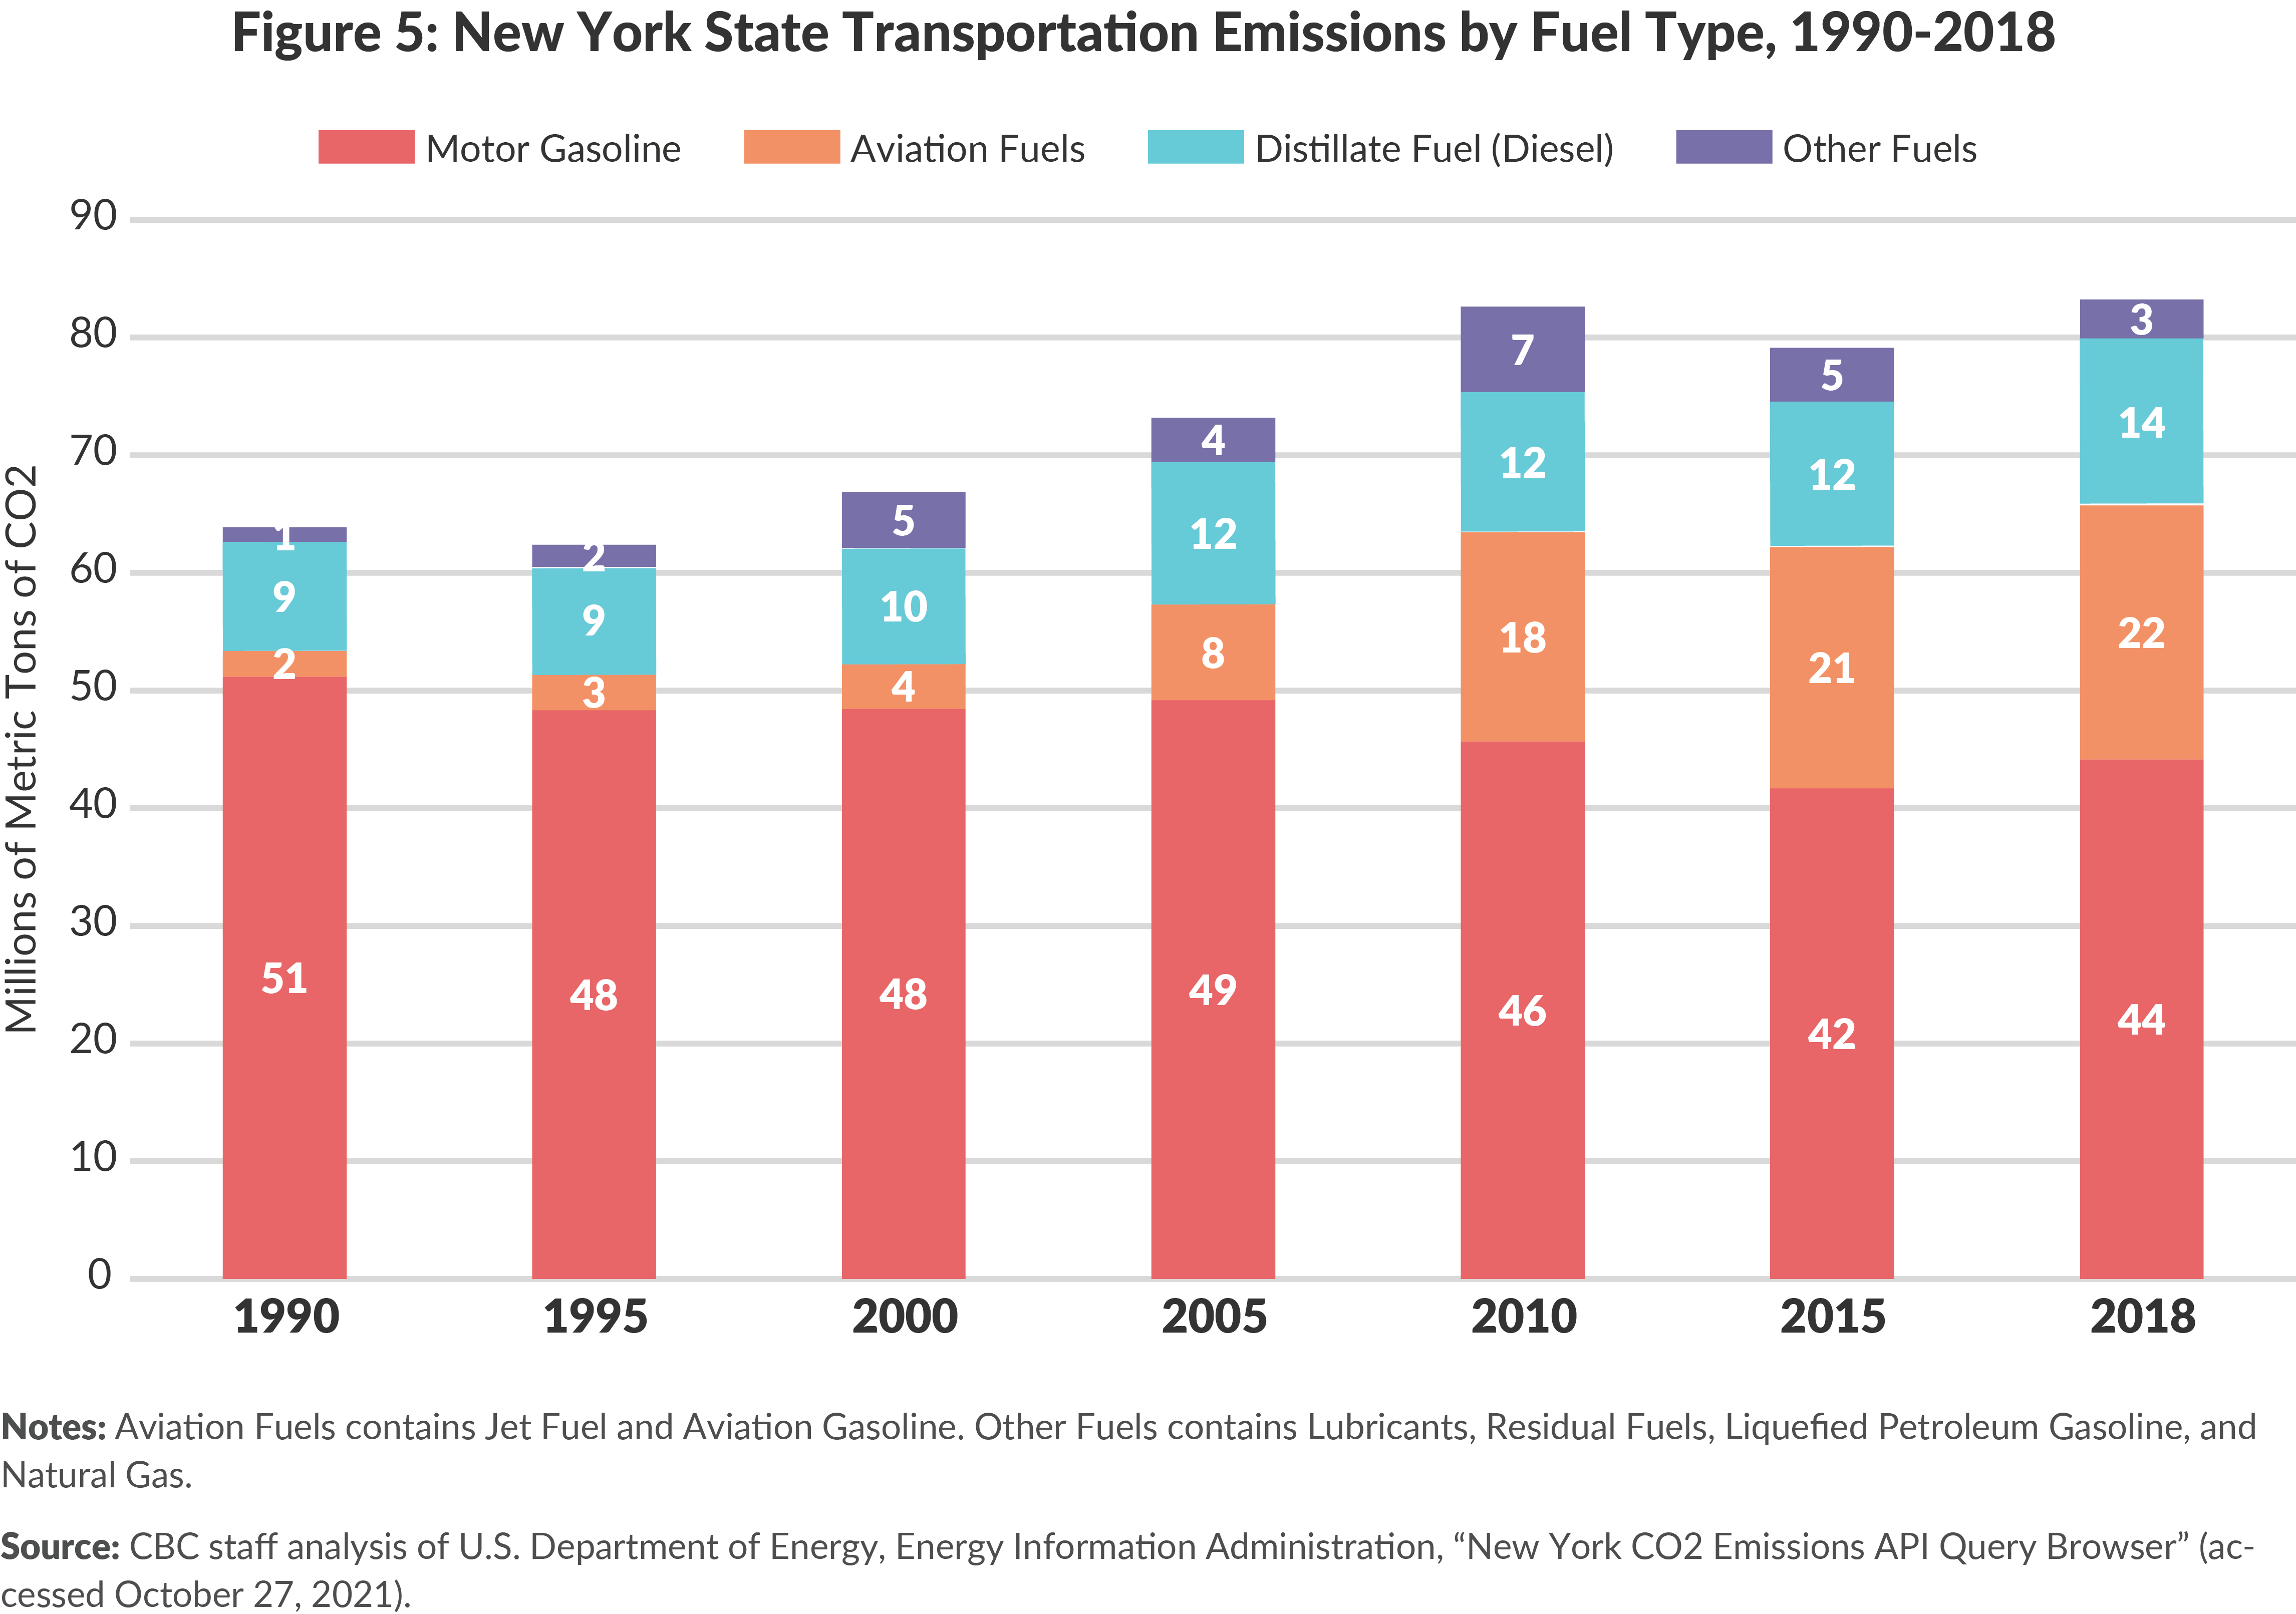
The increase in New York’s transportation emissions likely is driven by a number of factors. The most significant is aviation related emissions, which increased from 2 MMT in 1990 to 22 MMT in 2018. (See Figure 5.) GHG emissions from road vehicles—which use motor gasoline and diesel fuels—were fairly steady, decreasing slightly from 60 MMT to 58 MMT over the period, with a modest decrease in motor gasoline emissions largely offset by an uptick in diesel fuel emissions.
Aviation Emissions
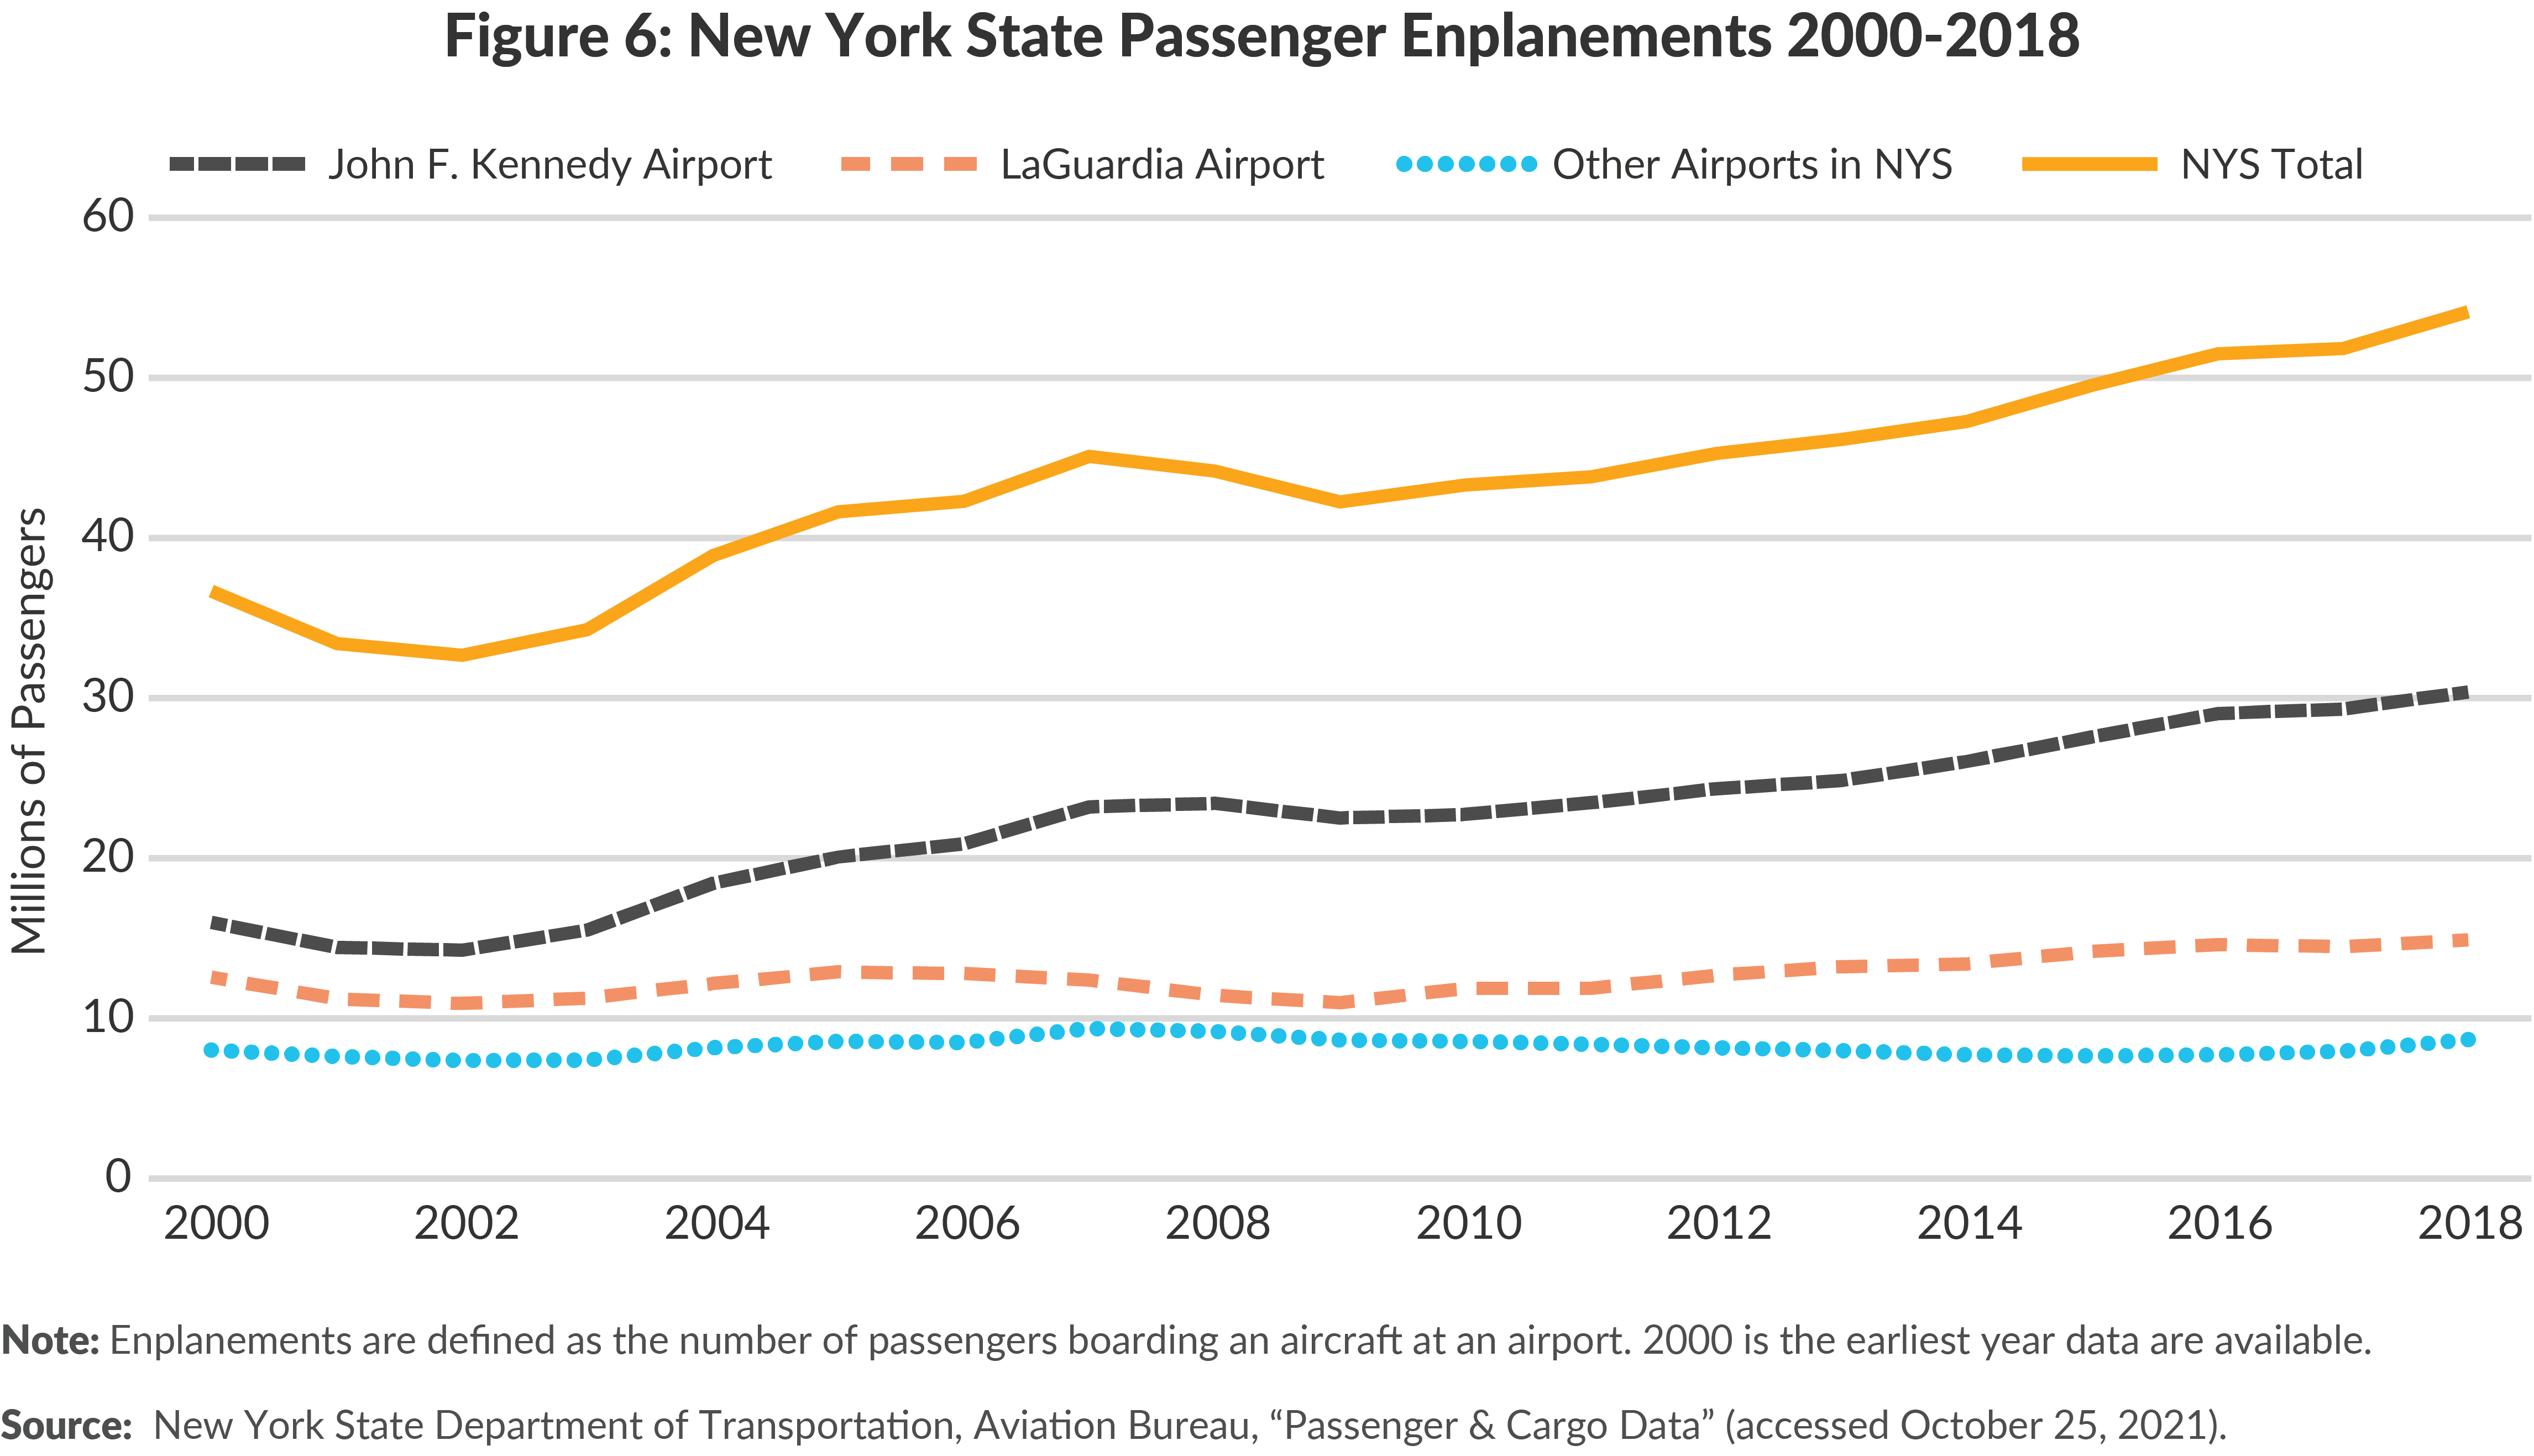
Passenger aviation increased rapidly over the past two decades, driving an increase in aviation emissions overall.10 Passenger enplanements across the state rose 47 percent from 2000 to 2018, driven by 90 percent and 19 percent increases at New York City’s John F. Kennedy (JFK) and LaGuardia airports, respectively.11 (See Figure 6.) Over this period, the number of flights into JFK Airport increased 32 percent, while the number of flights into LaGuardia Airport decreased by 3 percent, suggesting the greater number of passengers was met with larger capacity planes.12
Motor Vehicle Emissions
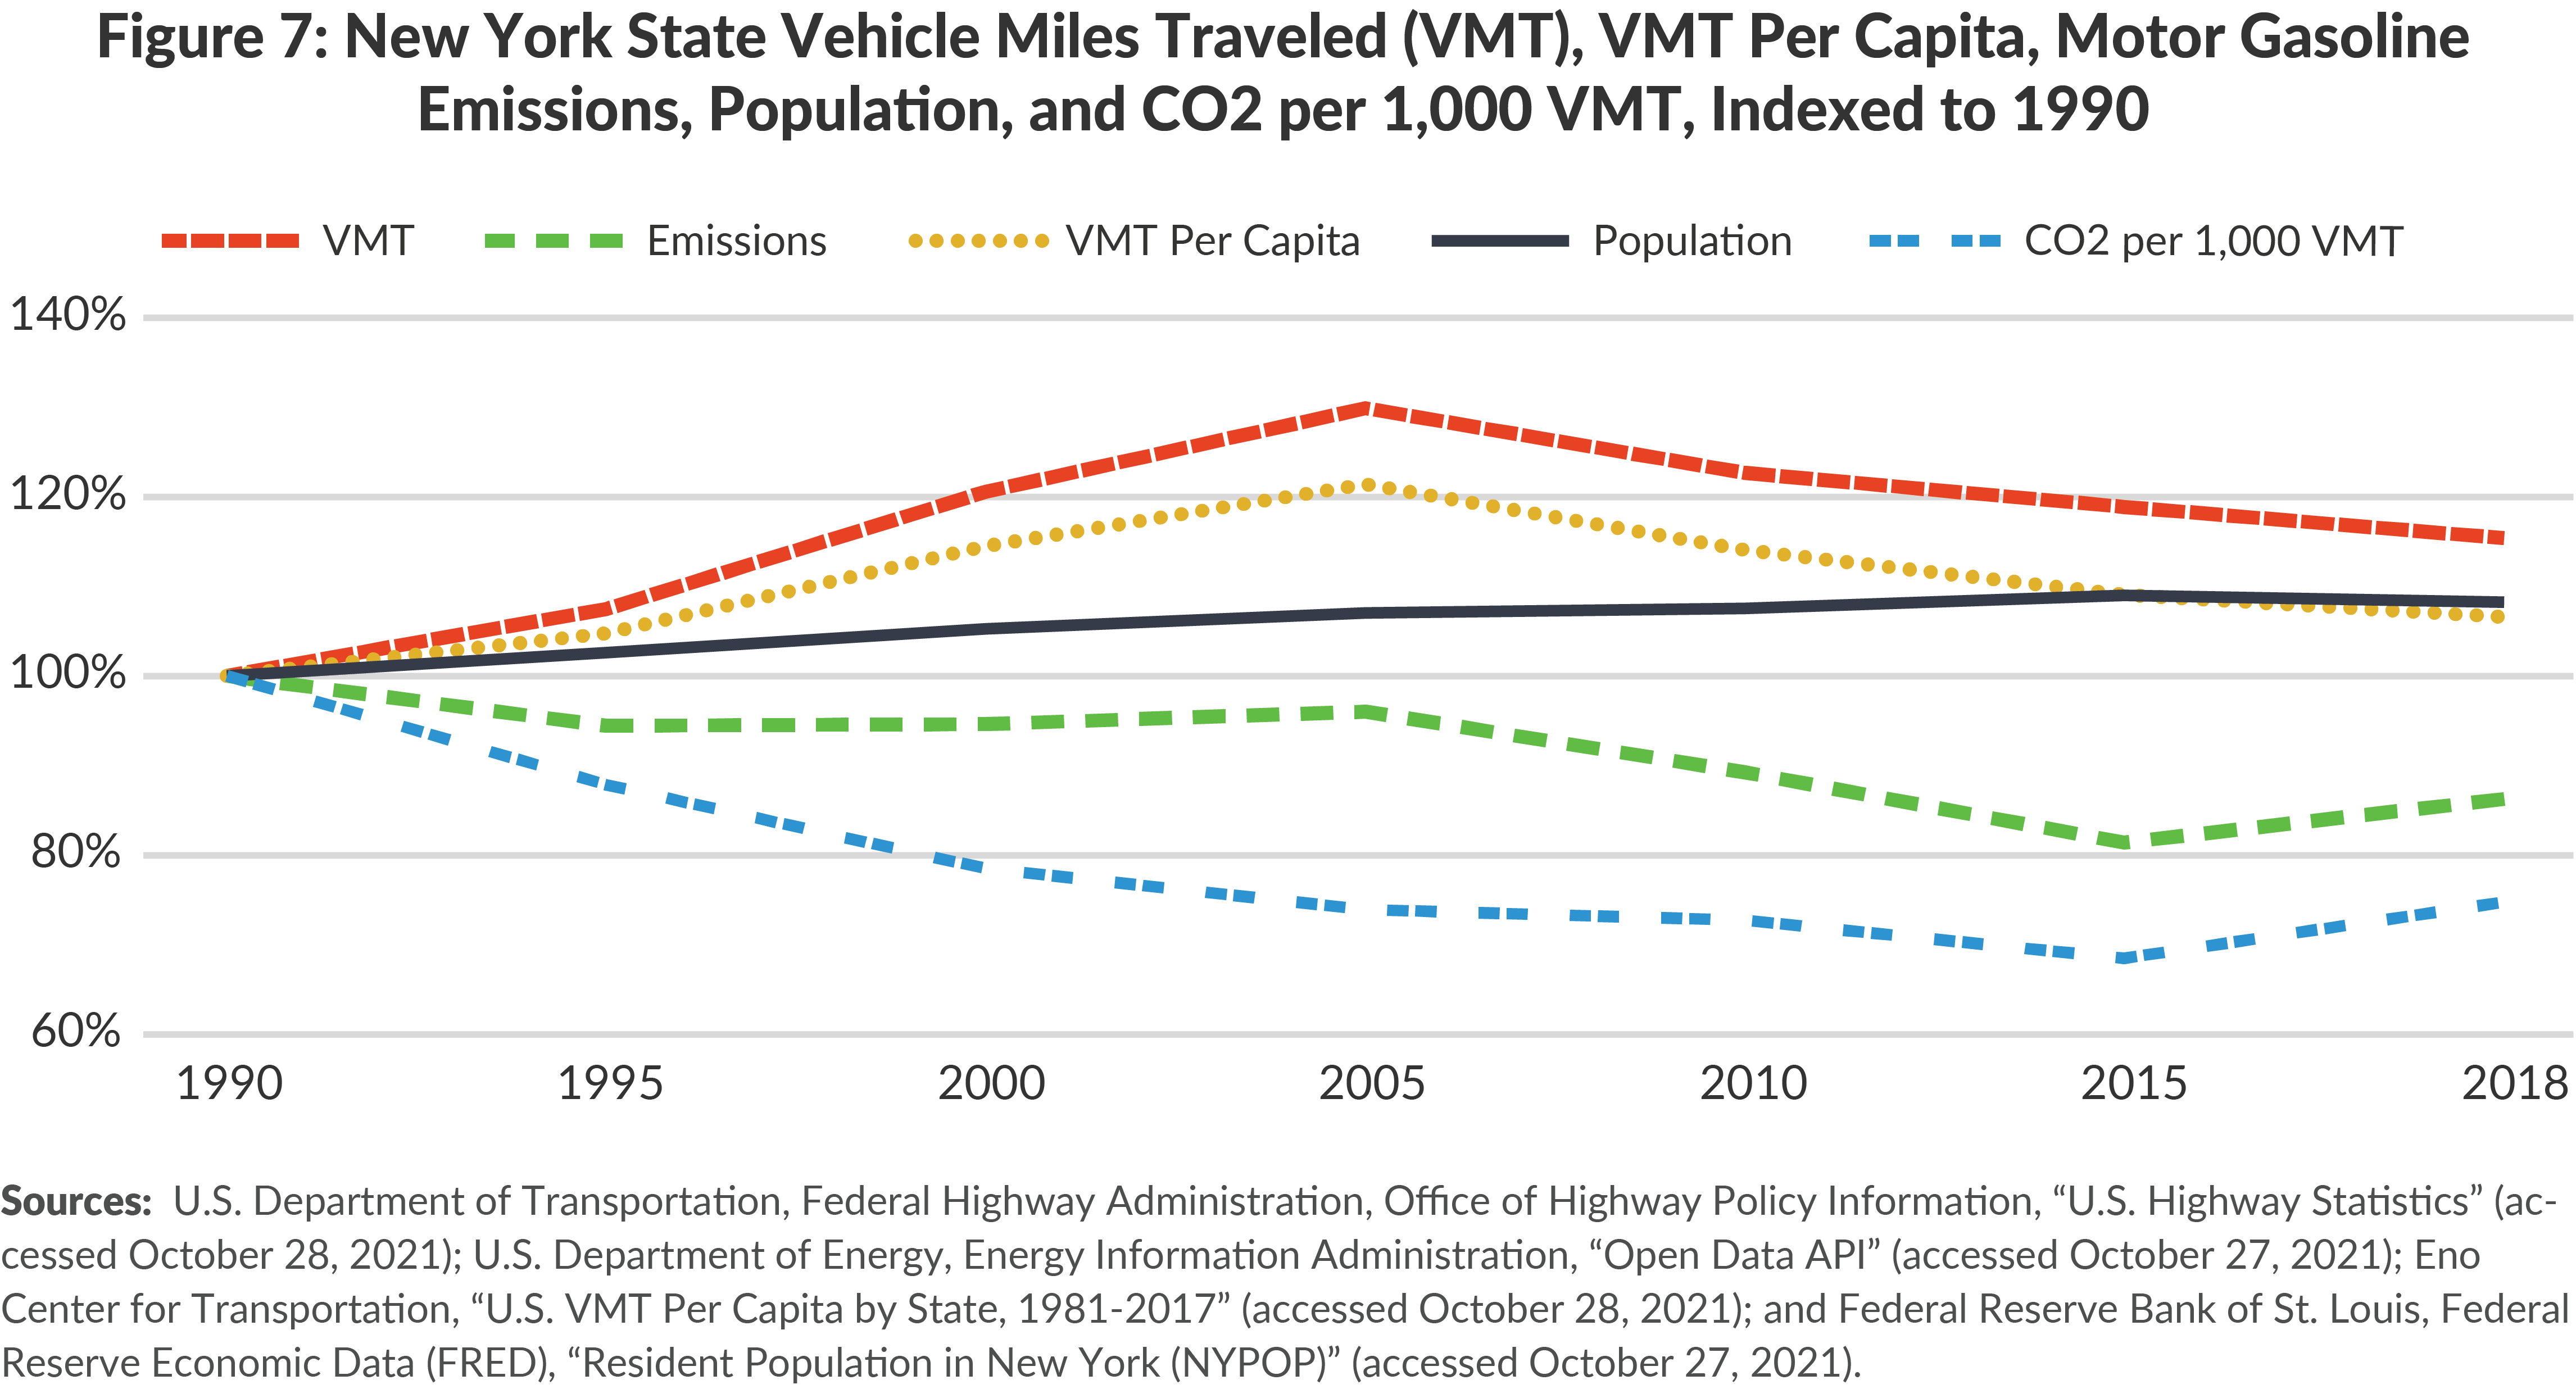
Motor gasoline accounts for the highest share of transportation-related emissions.13 New York has lower vehicle miles travelled (VMT) per capita than the U.S., but NYS VMT per capita has increased by 6 percent since 1990. (See Figure 7.) This is the product of two distinct periods. NYS VMT per capita increased 21 percent from 1990 to 2005, and then declined 12 percent from 7,201 miles per capita in 2005 to 6,324 miles per capita in 2018.14
While total emissions from motor gasoline declined from 51.2 MMT of CO2 in 1990 to 41.6 MMT in 2015, this trend reversed, rising to 44.2 MMT in 2018 even as VMT decreased. This recent increase in motor gasoline emissions is likely due to the slight decrease in VMT being offset by changes in the composition of vehicles used in the state. The CO2 emitted per 1,000 VMT declined 32 percent from 1990 to 2015, but then increased 9 percent from 2015 levels by 2018—reversing a three-decade trend and suggesting New Yorkers were choosing to drive more fuel intensive vehicles such as sports utility vehicles (SUVs) and trucks.15 Recent analysis from Transportation Alternatives found that SUV ownership in New York City grew 21 percent between 2016 and 2020.16
Conclusion
New York State’s relatively low per capita transportation emissions are important and demonstrate that the state already is more efficient than many other parts of the nation. Persistent and growing emissions in the sector, however, threaten New York’s ability to meet the CLCPA’s ambitious GHG reduction goals.
Importantly, the pandemic’s long run impact on tourist and business travel, transit ridership, and remote work is currently unknown but likely will affect personal vehicle use and airline travel for years or even decades, with uncertain impacts on the state’s economy and level of environmental pollution.
Reducing transportation emissions significantly likely will require lower VMT from passenger cars, less passenger air travel, or significant fuel efficiency improvements and clean energy alternatives for these travel modes. While progress is being made to increase the efficiency of road vehicles, including more and easier use of electric cars, trucks and buses, technological advancements in aviation have not yet occurred.
Policymakers should continue to consider policy changes to achieve these goals. Implementing congestion pricing in Manhattan should reduce emissions. State leaders also should consider how transportation emission reductions can be encouraged when making tax policy, state spending, and local aid decisions. Governor Kathy Hochul recently signed legislation mandating that 100 percent of new passenger cars and trucks sold in NYS be zero-emissions by 2035. The State also should consider other options, such as carbon fees to build the cost of carbon emissions in the price of fossil fuel heavy transport options like gas cars and aviation with the intent to reduce their use.
Download Report
4 Facts About New York’s Transportation EmissionsFootnotes
- For more information on the CLCPA, see: Citizens Budget Commission, Getting Greener: Cost-Effective Options for Achieving New York State’s Greenhouse Gas Goals (prepared by Strategic Energy Advisory Services, LLC, December 2019), https://cbcny.org/sites/default/files/media/files/REPORT_GettingGreener_120602019_6.pdf; David Friedfel, Green In Perspective: 6 Facts to Help New Yorkers Understand the CLCPA (Citizens Budget Commission, July 24, 2019), https://cbcny.org/research/green-perspective; and Climate Leadership and Community Protection Act, Chapter 106 of the Laws of 2019 of New York State, www.nysenate.gov/legislation/bills/2019/s6599.
- The closure of the Indian Point Energy Center in 2021 and increased reliance on natural gas power plants as a result will increase emissions in the electric power sector in the coming years that are not yet reflected in the available data. This will result in the transportation sector’s share of emissions declining even if absolute emissions from the sector itself do not change.
- U.S. Department of Energy, Energy Information Administration, “State energy-related carbon dioxide emissions by sector” (accessed October 29, 2021), www.eia.gov/environment/emissions/state/excel/table4.xlsx.
- U.S. Department of Energy, Energy Information Administration, “Glossary” (accessed November 2, 2021), www.eia.gov/tools/glossary/index.php?id=T.
- Data are available since 1981, but 1990 was chosen as the base year for this analysis because it is the base year for New York State’s emissions goals under the CLCPA. Emissions temporarily fell in the early 1980s, likely due to high oil prices and an economic recession at the time. The sector’s emissions fell from 71.7 MMT CO2 in 1980 to a low of 49.3 MMT in 1984, before beginning a generally increase thereafter.
- CBC staff analysis of U.S. Department of Energy, Energy Information Administration, “State carbon dioxide emissions from fossil fuels tables: New York” (accessed October 27, 2021), https://www.eia.gov/environment/emissions/state/excel/states/new%20york.xlsx.
- According to the 2019 5-Year American Community Survey, 34 percent of the nation’s commuters, defined as workers over the age of 16 using public transportation to commute to work, are in New York State (and 29 percent in New York City); the next highest concentration was in California, with 12 percent of the nation’s commuters. Furthermore, the share of workers who commute via public transportation is relatively high, at 28 percent for New York State as a whole, and 56 percent of New York City. Only the District of Columbia was higher than NYS, at 35 percent. United States Census Bureau, “2019: ACS 5-year Estimates Subject Tables: Table S0802” (accessed November 9, 2021), https://data.census.gov/cedsci/table?q=commute%20to%20work&tid=ACSST5Y2019.S0802&hidePreview=true&moe=false.
- New York City’s emissions are calculated and reported by the NYC Mayor’s Office of Sustainability using the Global Protocol for Cities (GPC) BASIC level of reporting, a different calculation system used by the Energy Information Administration for New York State’s emissions. As a result, reported emissions between the City and State are not directly comparable. Due to the way aviation emissions are calculated under the GPC, the City’s reported transportation emissions are likely lower than they would be if calculated by the EIA. Greenhouse Gas Protocol, “Global Protocol for Community-Scale Greenhouse Gas Inventories” (Accessed November 2, 2021), https://ghgprotocol.org/sites/default/files/standards/GPC_Full_MASTER_RW_v7.pdf; City of New York, Mayor’s Office of Sustainability, “Inventory of New York City Greenhouse Gas Emissions” (accessed October 27, 2021), https://nyc-ghg-inventory.cusp.nyu.edu/; and City of New York, Department of City Planning, “Current Estimates of New York City’s Population for July 2018“ (accessed October 27, 2021), https://www1.nyc.gov/site/planning/planning-level/nyc-population/current-future-populations.page#:~:text=The%20U.S.%20Census%20Bureau%20has,decennial%20census%20count%20of%208%2C175%2C133.
- U.S. Department of Energy, Energy Information Administration, “State Carbon Dioxide Emissions from fossil fuels tables” (accessed October 27, 2021), www.eia.gov/environment/emissions/state/; Federal Reserve Bank of St. Louis, Federal Reserve Economic Data (FRED), “Resident Population in New York (NYPOP)” (accessed October 27, 2021), https://fred.stlouisfed.org/series/NYPOP, and “U.S. Population” (accessed October 27, 2021), https://fred.stlouisfed.org/series/B230RC0A052NBEA.
- Since aviation emissions are calculated based on the amount of jet fuel and aviation gasoline used at airports in the state, the higher number of flights coming through New York’s airports corresponds with increased emissions.
- New York State Department of Transportation, Aviation Bureau, “Passenger & Cargo Data” (accessed November 2, 2021), www.dot.ny.gov/divisions/operating/opdm/aviation/passenger-cargo-data.
- The Port Authority of New York and New Jersey, Airport Traffic Report 2018 (April 9, 2019), www.panynj.gov/content/dam/airports/statistics/statistics-general-info/annual-atr/ATR2018.pdf; and Airport Traffic Report 2002, www.panynj.gov/content/dam/airports/statistics/statistics-general-info/annual-atr/air_traffic_report_2002.pdf.
- CBC staff analysis of data from the U.S. Department of Energy, Energy Information Administration, “Open Data API” (accessed October27, 2021), www.eia.gov/opendata/qb.php?category=2251703.
- U.S. Department of Transportation, Federal Highway Administration, Office of Highway Policy Information, “Highway Statistics Series 2019” (accessed October 27, 2021), www.fhwa.dot.gov/policyinformation/statistics/2019/ps1.cfm; and Eno Center for Transportation, “U.S. VMT Per Capita by State, 1981-2017” (accessed October 27, 2021), www.enotrans.org/eno-resources/u-s-vmt-per-capita-by-state-1981-2017/.
- U.S. Department of Transportation, Federal Highway Administration, Office of Highway Policy Information, “U.S. Highway Statistics” (accessed October 28, 2021), www.google.com/publicdata/explore?ds=gb66jodhlsaab_#!ctype=l&strail=false&bcs=d&nselm=h&met_y=VMT&scale_y=lin&ind_y=false&rdim=state&idim=state:NY&ifdim=state&hl=en_US&dl=en_US&ind=false; and U.S. Department of Energy, Energy Information Administration, “Open Data API” (accessed October 27, 2021), www.eia.gov/opendata/qb.php?category=2251703.
- Transportation Alternatives, “New Data Shines Light on Growing Dangers and Growing Ownership of SUVs in New York City” (press release, May 25, 2021), www.transalt.org/press-releases/new-data-shines-light-on-the-growing-dangers-and-growing-ownership-of-suvs-in-new-york-city.