5 Myths About School Crowding in New York City
Myth 1: There aren't enough seats for all New York City public school students.
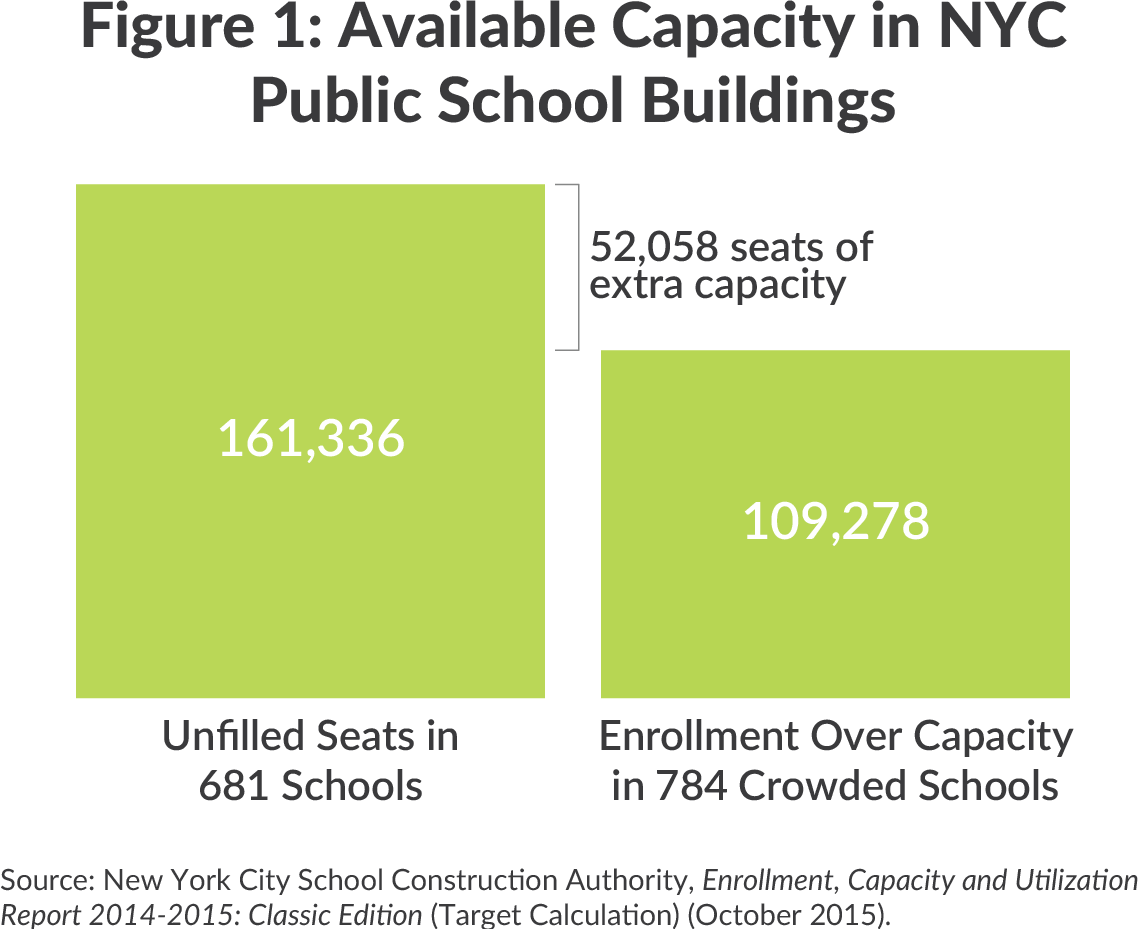
Fact: Public school buildings have enough room for 1.14 million students, but only 1.09 million students are enrolled.
Citywide, there are 52,000 seats of extra capacity. That is not to say that crowding is not a problem; crowded school buildings have a total of 109,278 more students than they have the capacity to hold. However, there are a total of 161,336 unfilled seats in other school buildings (See Figure 1).1 In total 47 percent of school buildings have more capacity than they use.
Myth 2: Crowding is a pervasive problem in every district.
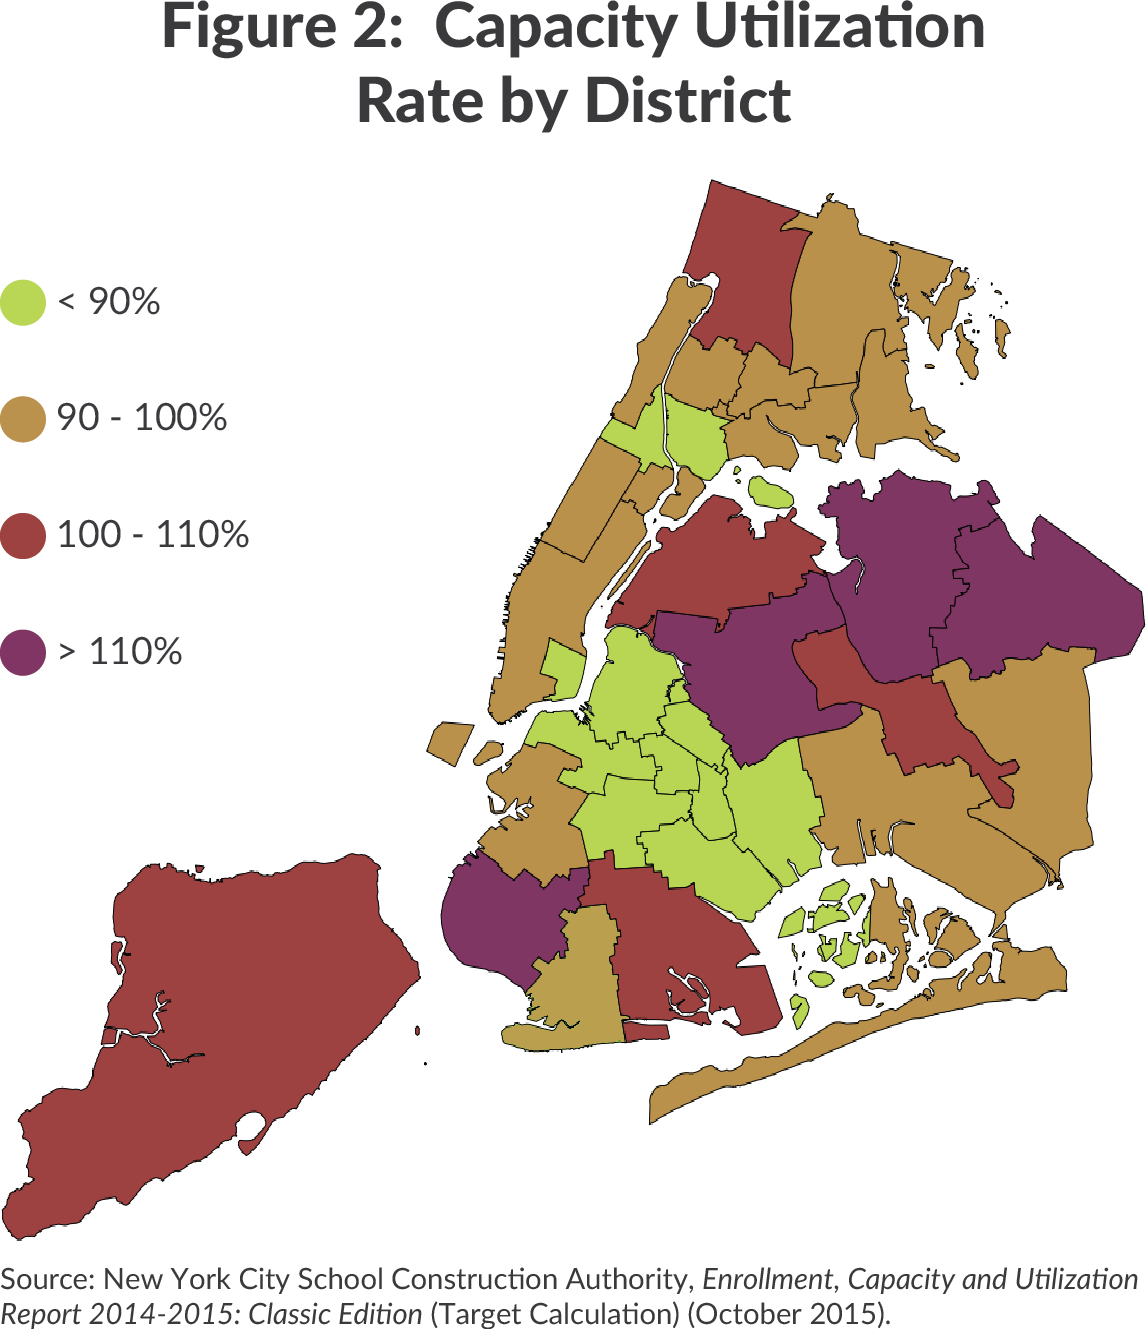
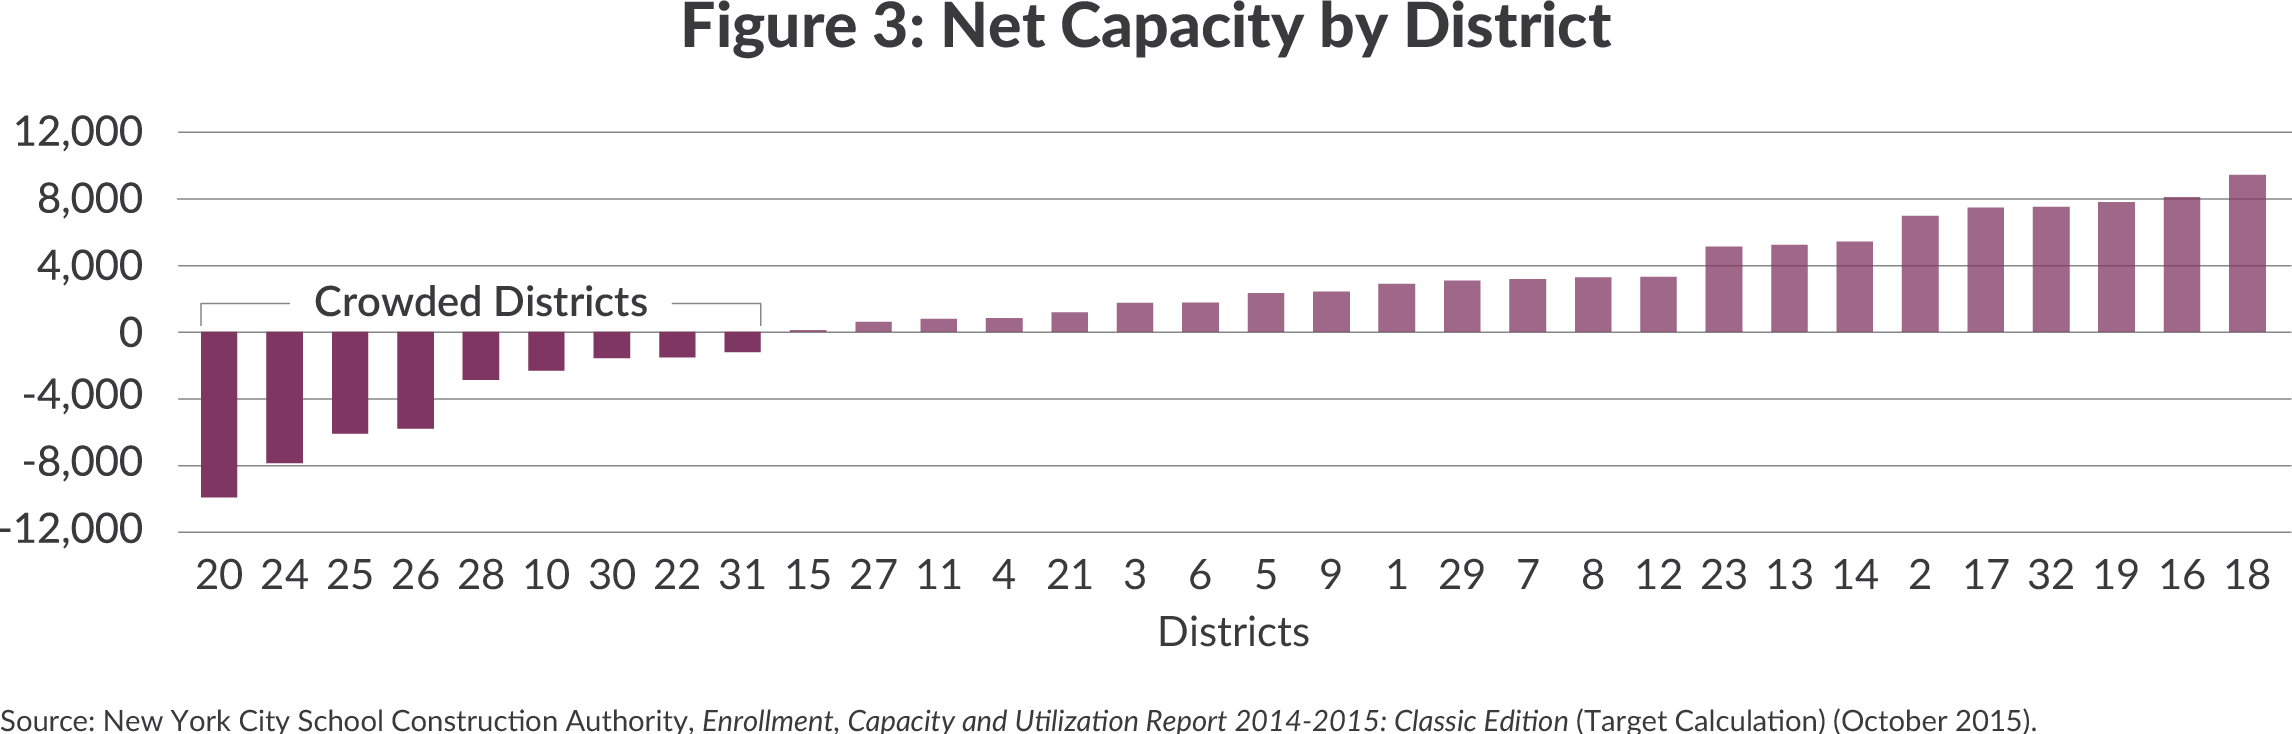
Fact: There are pockets of severe crowding, but most districts have excess seats.
Out of 32 districts in the city, 23 have excess capacity (See Figure 2). Only nine districts have more students than total capacity. Five of these districts are in Queens, two are in Brooklyn, one is in the Bronx, and one covers Staten Island (See Figure 3). Crowding is concentrated in District 20 in southwest Brooklyn (including Bay Ridge, Borough Park, and Dyker Heights) and Districts 24, 25, and 26 in northeast Queens (including Corona, Elmhurst, Fresh Meadows, College Point, Whitestone, and Flushing). Districts in northern Brooklyn, covering neighborhoods including East New York, Brownsville, Canarsie, Crown Heights, Bushwick, and Stuyvesant Heights, have far fewer students than available seats, with some buildings less than half full.2
Myth 3: Middle and high school students face the worst crowding conditions.
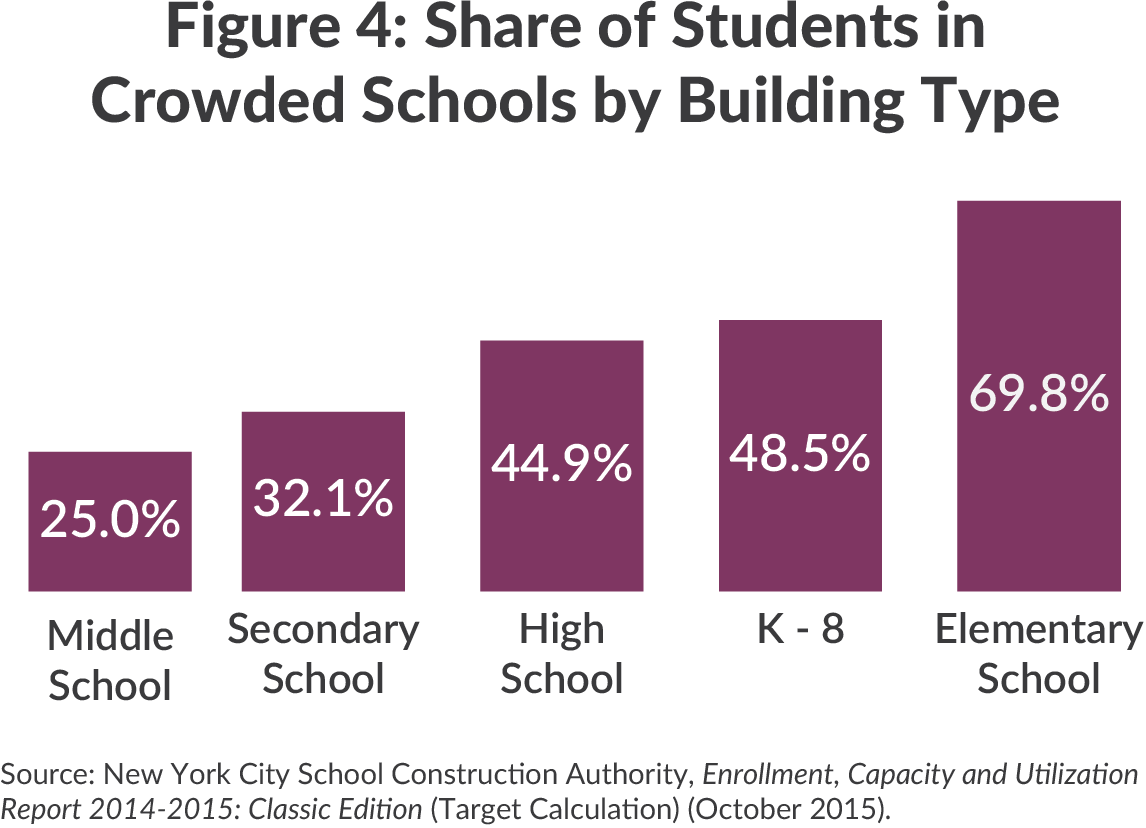
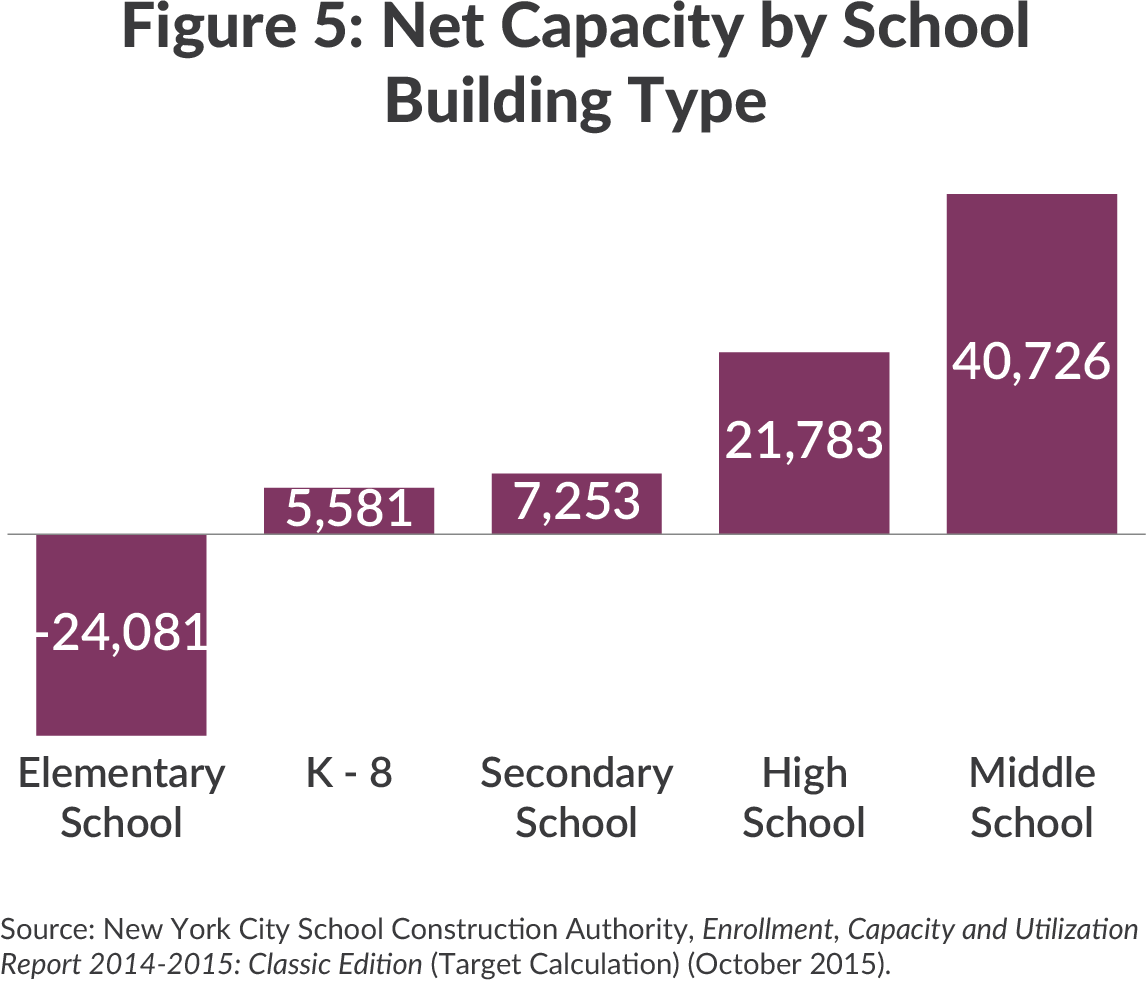
Fact: Although some high school buildings are crowded, the worst crowding is in elementary schools.
Seventy percent of elementary school students are in crowded school buildings (See Figure 4). Two-thirds of elementary school buildings citywide are over capacity, in contrast to 43 percent of high school buildings and 24 percent of middle school buildings. Elementary school buildings have a total capacity shortfall of 24,000 seats, while middle school buildings have an excess of 41,000 seats (See Figure 5).3
Myth 4: School buildings in poorer neighborhoods suffer from the most crowded conditions.
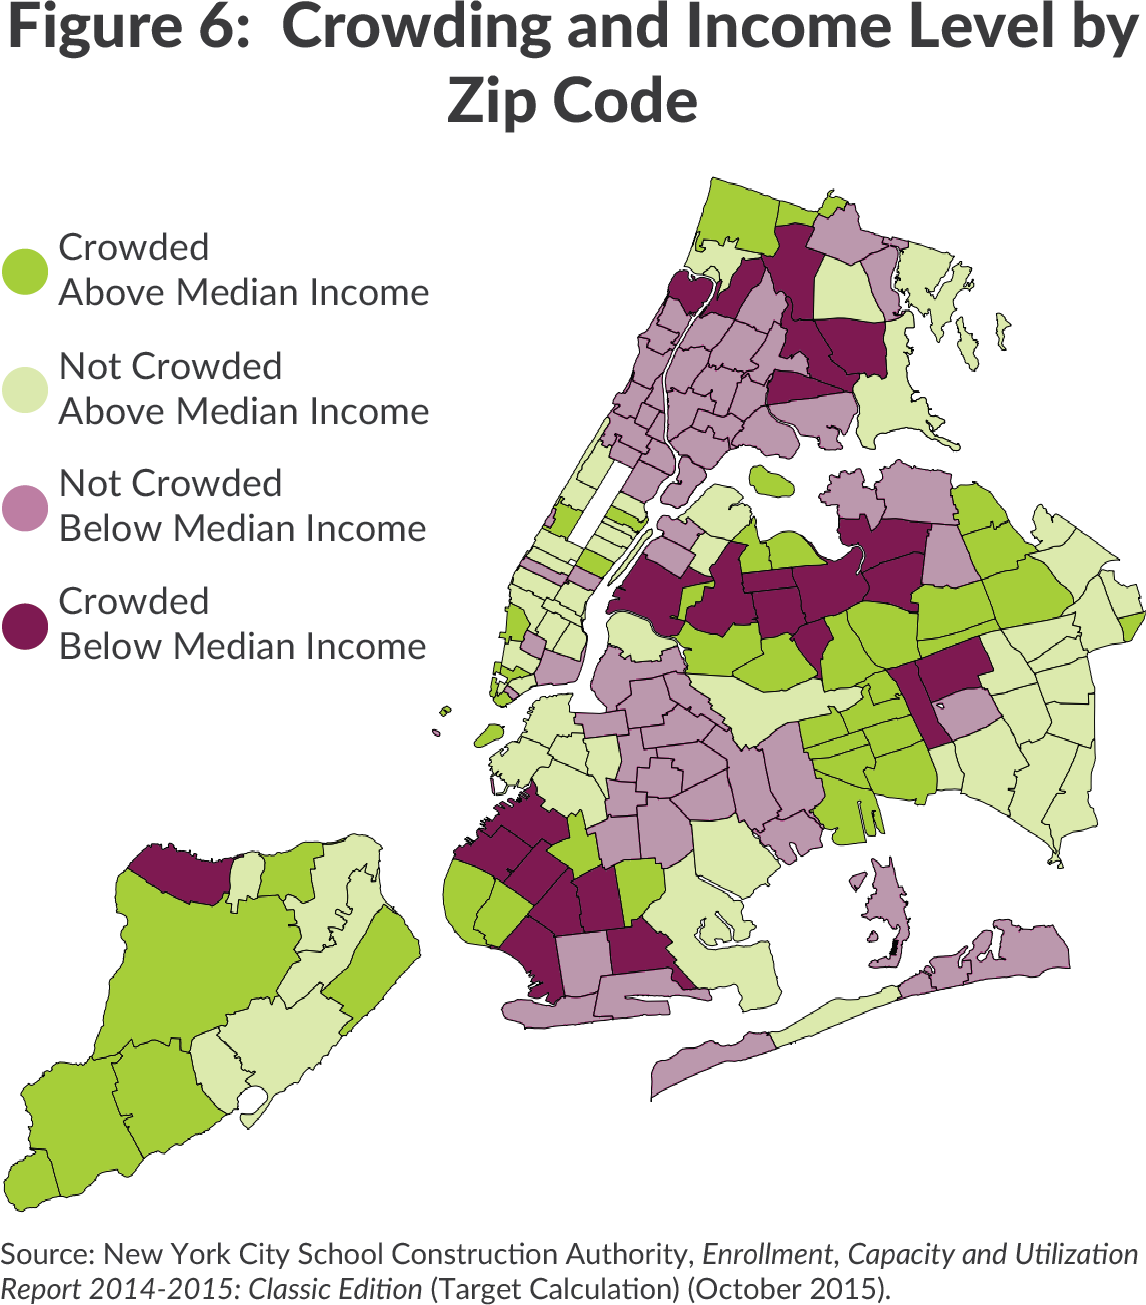
Fact: A larger share of students in high-income areas goes to crowded schools than in less wealthy areas.
Fifty-three percent of students in zip codes below the median household income attend school in buildings that are not crowded. In zip codes above the median household income, 57 percent of students are in crowded buildings. For zip codes above the median income, total enrollment is 99 percent of total capacity. For zip codes below the median income, total enrollment is 93 percent of total capacity, leaving more unfilled seats.4 In the map below, green zip codes are those where the median household income is above the citywide median household income, and purple zip codes are where it is below the citywide median. Darker colors represent zip codes where enrollment exceeds capacity, and light colors represent zip codes where capacity exceeds enrollment. Forty percent of zip codes below the median income are crowded, while 53 percent of zip codes above the median income are crowded.
Myth 5: Plans to build new schools will solve the problem.
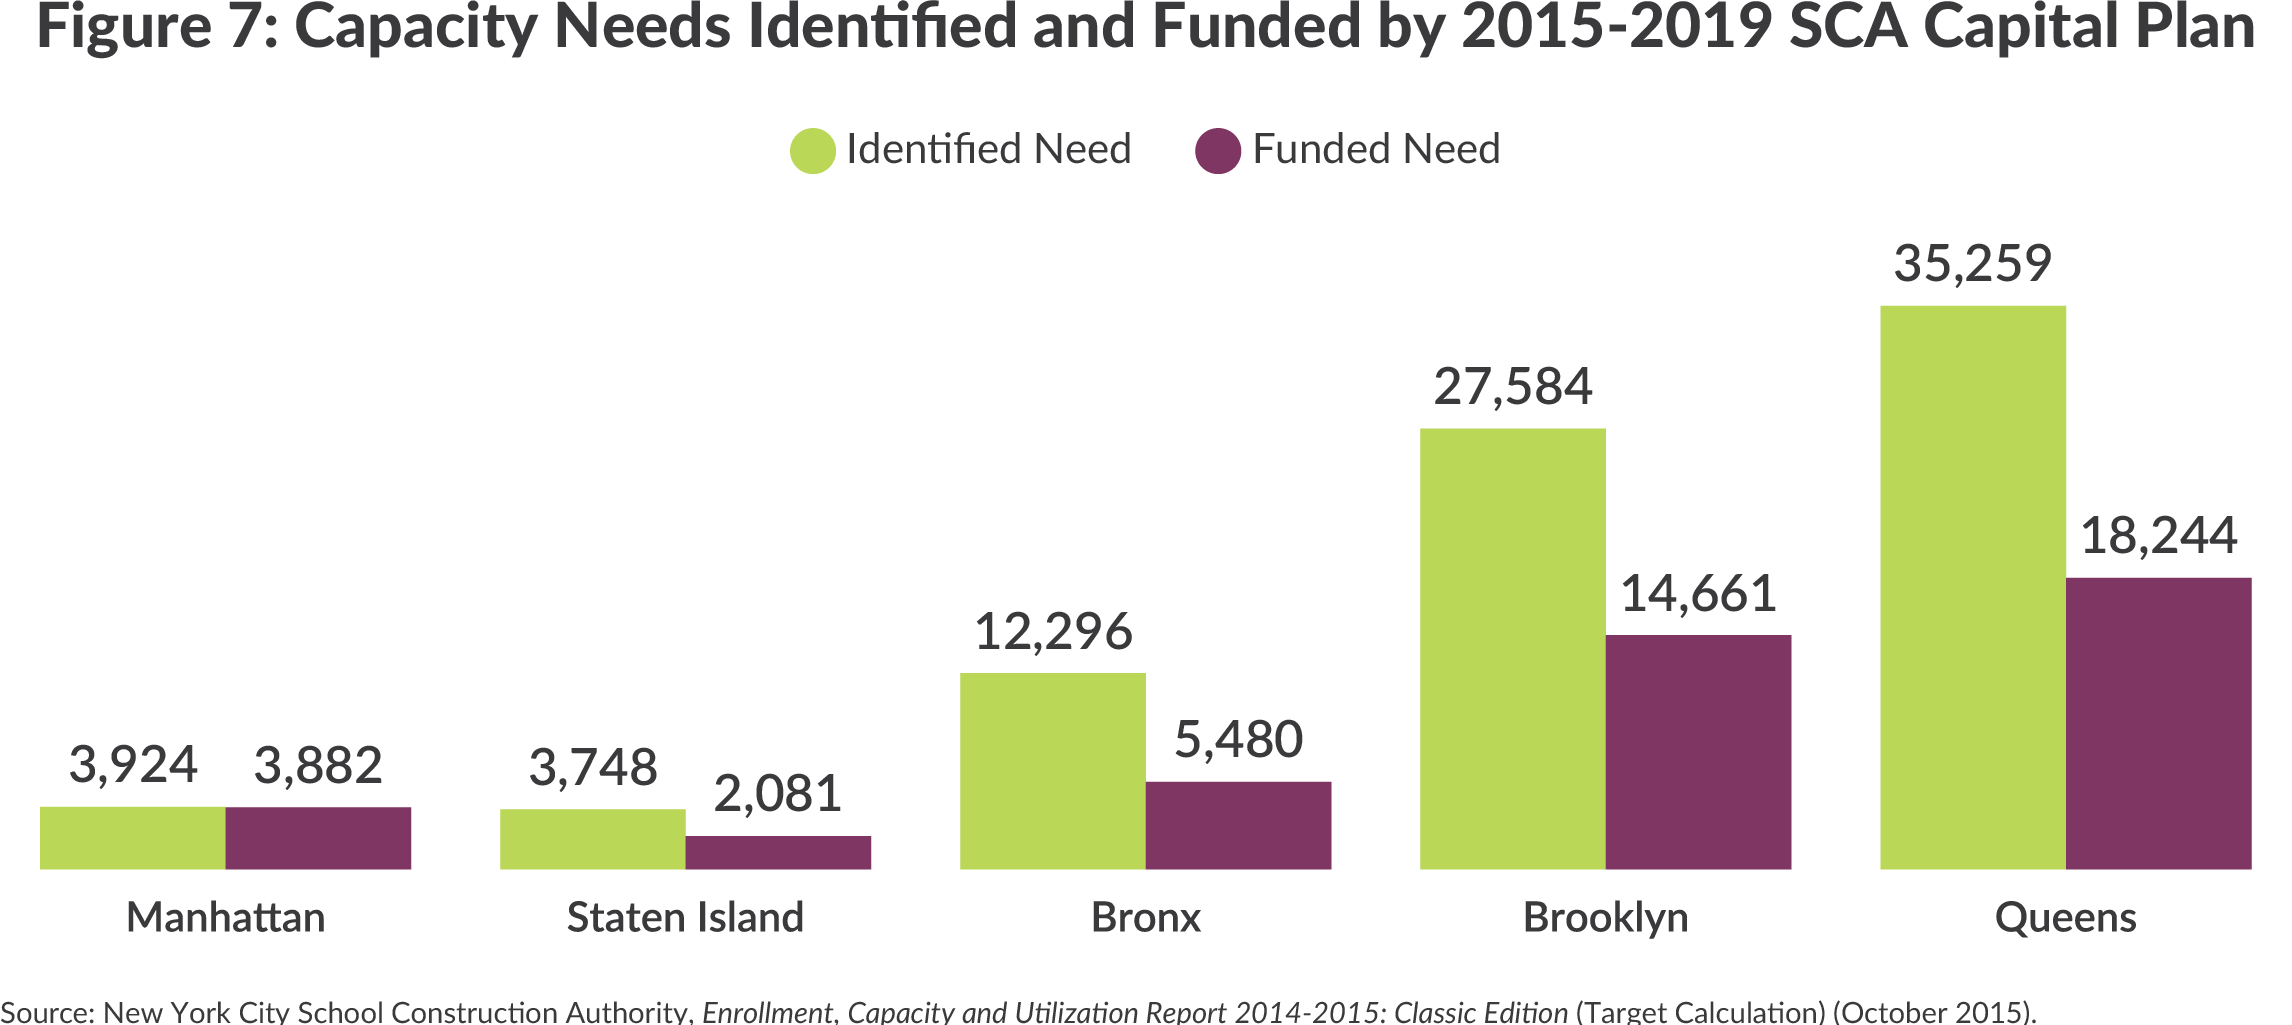
Fact: The 2015-2019 Department of Education (DOE) Capital Plan funds only 53 percent of identified need.
The Capital Plan leaves 38,463 needed seats unfunded (See Figure 7). Most districts that have excess space are projected to decline in enrollment over the capital plan period, while the most crowded districts are projected to grow further.5 Planned new capacity in the capital plan will not meet the projected need of these crowded and fast-growing districts. At the same time, the plan funds the creation of additional capacity in some districts that are not currently crowded and are projected to decline in enrollment over the capital plan period. Building new schools takes years, while shifting students to different schools or moving schools to different buildings could address crowding faster and without unnecessary capital expenditure.
Several factors are putting additional pressure on the DOE’s existing school capacity:
- The commitment to remove Transportable Classroom Units (TCUs), which are no longer counted as capacity;
- Changes in 2015 to DOE standards for adequate space allocation, which provide for more space for teacher workrooms, guidance counseling, and classrooms for special subjects such as art;
- The universal pre-kindergarten initiative, which greatly expanded enrollment; and
- Recent legislation that requires the DOE to provide space to charter schools in DOE facilities or pay for rental costs for a private facility.6
Coupled with enrollment growth in already crowded districts, these pressures will increase the need for space management solutions that take advantage of existing unused space and adequately meet the needs of the 1 million students in the city’s public school system.
Download Report
5 Myths About School CrowdingFootnotes
- New York City School Construction Authority, Enrollment, Capacity and Utilization Report 2014-2015: Classic Edition (Target Calculation) (October 2015), pp. 1-222, www.nycsca.org/Community/Capital-Plan-Reports-Data#Enrollment-Capacity-Utilization-69.
- New York City School Construction Authority, Enrollment, Capacity and Utilization Report 2014-2015: Classic Edition (Target Calculation) (October 2015), pp. 1-222, www.nycsca.org/Community/Capital-Plan-Reports-Data#Enrollment-Capacity-Utilization-69.
- New York City School Construction Authority, Enrollment, Capacity and Utilization Report 2014-2015: Classic Edition (Target Calculation) (October 2015), pp. 1-222, www.nycsca.org/Community/Capital-Plan-Reports-Data#Enrollment-Capacity-Utilization-69.
- New York City School Construction Authority, Enrollment, Capacity and Utilization Report 2014-2015: Classic Edition (Target Calculation) (October 2015), pp. 1-222, www.nycsca.org/Community/Capital-Plan-Reports-Data#Enrollment-Capacity-Utilization-69; and U.S. Census Bureau, American Community Survey, 2014 One-Year Estimates, Table DP03.
- Statistical forecasting. New York City School Construction Authority, Enrollment Projections for the New York City Public Schools, 2015-16 to 2024-25, Volume 1 (May 2015), pp. 11-49, www.nycsca.org/Community/Capital-Plan-Reports-Data#Demographic-Projection-68.
- New York City Department of Education, Space Overutilization in New York City Public Schools: Report on the 2014-2015 School Year (June 1, 2016), p. 5, http://schools.nyc.gov/NR/rdonlyres/40C1E850-6E4B-4511-9D5D-4CE499E6773D/198862/OverutilizationReportFINAL6_1_15.pdf.