Access-A-Ride
Ways to Do the Right Thing More Efficiently
Introduction
When most New Yorkers think about public transportation they picture buses, trains, the iconic New York City subway map, or Grand Central Terminal. However disabled persons thinking about public transportation often conjure a list of challenges in getting themselves and their belongings from one part of the city to another—multiple and steep stairways, dangerous platforms, and distant bus stops. In response to many transit systems inaccessibility, federal and state laws mandate the widely shared sentiment that public transportation services should be accessible to people with disabilities. Nationally and in New York, public opinion and the law support doing the right thing by making mass transit widely accessible.
In New York City two basic strategies promote this desired goal. First, facilities and equipment are modified to make existing services accessible to many of those with disabilities. Between 1981 and 1998 the local public transit agency, the Metropolitan Transportation Authority (MTA), converted its fleet of about 4,400 buses to be wheelchair-accessible.1 In addition in 1984 the MTA began a multiyear program to make 100 of its 469 subway stations accessible to the disabled by installing elevators and other features; the 100 selected stations were those with particularly high volumes of users or at key transfer or end points. So far work has been completed or is underway on 89 of these stations as well as 14 non-key stations; the remaining 11 key stations are to be addressed in the MTA’s 2015-2019 capital investment program.2
The second strategy recognizes that these enhancements to existing services may not be sufficient to enable many of the disabled to use the subway and buses to meet their travel needs. Additional aid may be necessary because the nature of their disability prevents them from using the facilities or because bus routes or accessible subway stations are not available at their travel origin or destination. To meet these needs the MTA and other transit agencies around the country rely on paratransit services; that is, special services providing origin-to-destination service, often with smaller vehicles and usually for the mobility impaired, that supplement the fixed-route systems. The MTA’s paratransit program is known as Access-A-Ride (AAR). It is the focus of this report.
AAR is a vital service that pursues an important and desirable mission. It serves about 144,000 disabled New Yorkers who take more than 6 million trips annually. Though the MTA has taken substantial steps to reduce growth in costs, saving the agency nearly $2 billion from projected totals since 2009, the current AAR program remains expensive. AAR had a higher per trip cost in 2014, about $71, than nearly any other paratransit service in the nation, and supplies a relatively high number of trips per capita when compared to other systems. The high unit cost and volume of service drive total expenditures to nearly one-half billion dollars annually, more than the combined cost of the next three largest paratransit systems in the nation. Moreover, the service is financed in an inappropriate manner. Tax subsidies from state or local government that should finance the bulk of the cost cover only about 40 percent; fares are a minor share of revenues, about 4 percent. The MTA is obliged to cover the remaining share of expenses, more than half, from other fares, tolls, and dedicated taxes and subsidies. The cross-subsidy is equivalent to 11 cents per transit ride.3
This report analyzes the challenges of AAR and presents options for making the service more efficient and more rationally financed. The first section describes the evolution of the system including efforts by the MTA to curb the growth in expenses. The second section provides a comparative perspective showing the unit cost and utilization of paratransit systems in other large U.S. cities. The third section presents options for improving AAR’s efficiency, better managing demand for its services, and altering its revenue structure. The final section presents potential improved outlooks for AAR based on implementing a combination of the options in order to lower unit costs, better manage demand, and reduce the financial burden on straphangers.
Evolution of the System
Although the federal Americans with Disabilities Act (ADA) of 1990 is widely regarded as a landmark in promoting transit accessibility, in New York City major initiatives were already underway before its passage. Based on provisions of the federal Rehabilitation Act of 1973 and the New York State Public Buildings Law, advocates pursued litigation to require wheelchair-accessible buses, investments in “key stations” in the subway system, and new paratransit service using wheelchair lift-equipped vans. In 1984 the City, State, and MTA consolidated these challenges and reached an agreement with plaintiffs by passing the New York State Handicapped Transportation Act. It stipulated the MTA would make 100 key subway stations fully accessible and that the entire bus fleet would be wheelchair-accessible by 2020.4 In addition the act established a paratransit committee to study the issue in New York City and design a paratransit program. In 1987 the City began developing a paratransit program, and service began in 1990.5
The ADA and Federal Standards
The ADA of 1990 required transit systems progressively to make bus and rail systems accessible to persons with disabilities. Moreover, the ADA recognizes some disabled persons lack the functional ability to use conventional transit irrespective of accessibility aids; accordingly, transit agencies must provide an alternative in the form of paratransit comparable to fixed-route service.6
The Federal Transit Administration (FTA) is responsible for enforcing these requirements and has set six criteria for paratransit services:
- A service area defined as within ¾ mile of a fixed-route;
- The same hours and days of service as the fixed-route;
- Fares that may not exceed twice the fare a comparable user of the fixed-route would pay at a similar time of day;7
- Response time that allows for reservations made before the close of business the day prior to a requested trip;
- No restrictions or priorities based on the type of trip or purpose of trip; and
- No capacity constraints by rationing trips, maintaining waiting lists, delaying trips due to untimely pickups, denying substantial numbers of trips, or forcing customers to take part in trips of excessive length.8
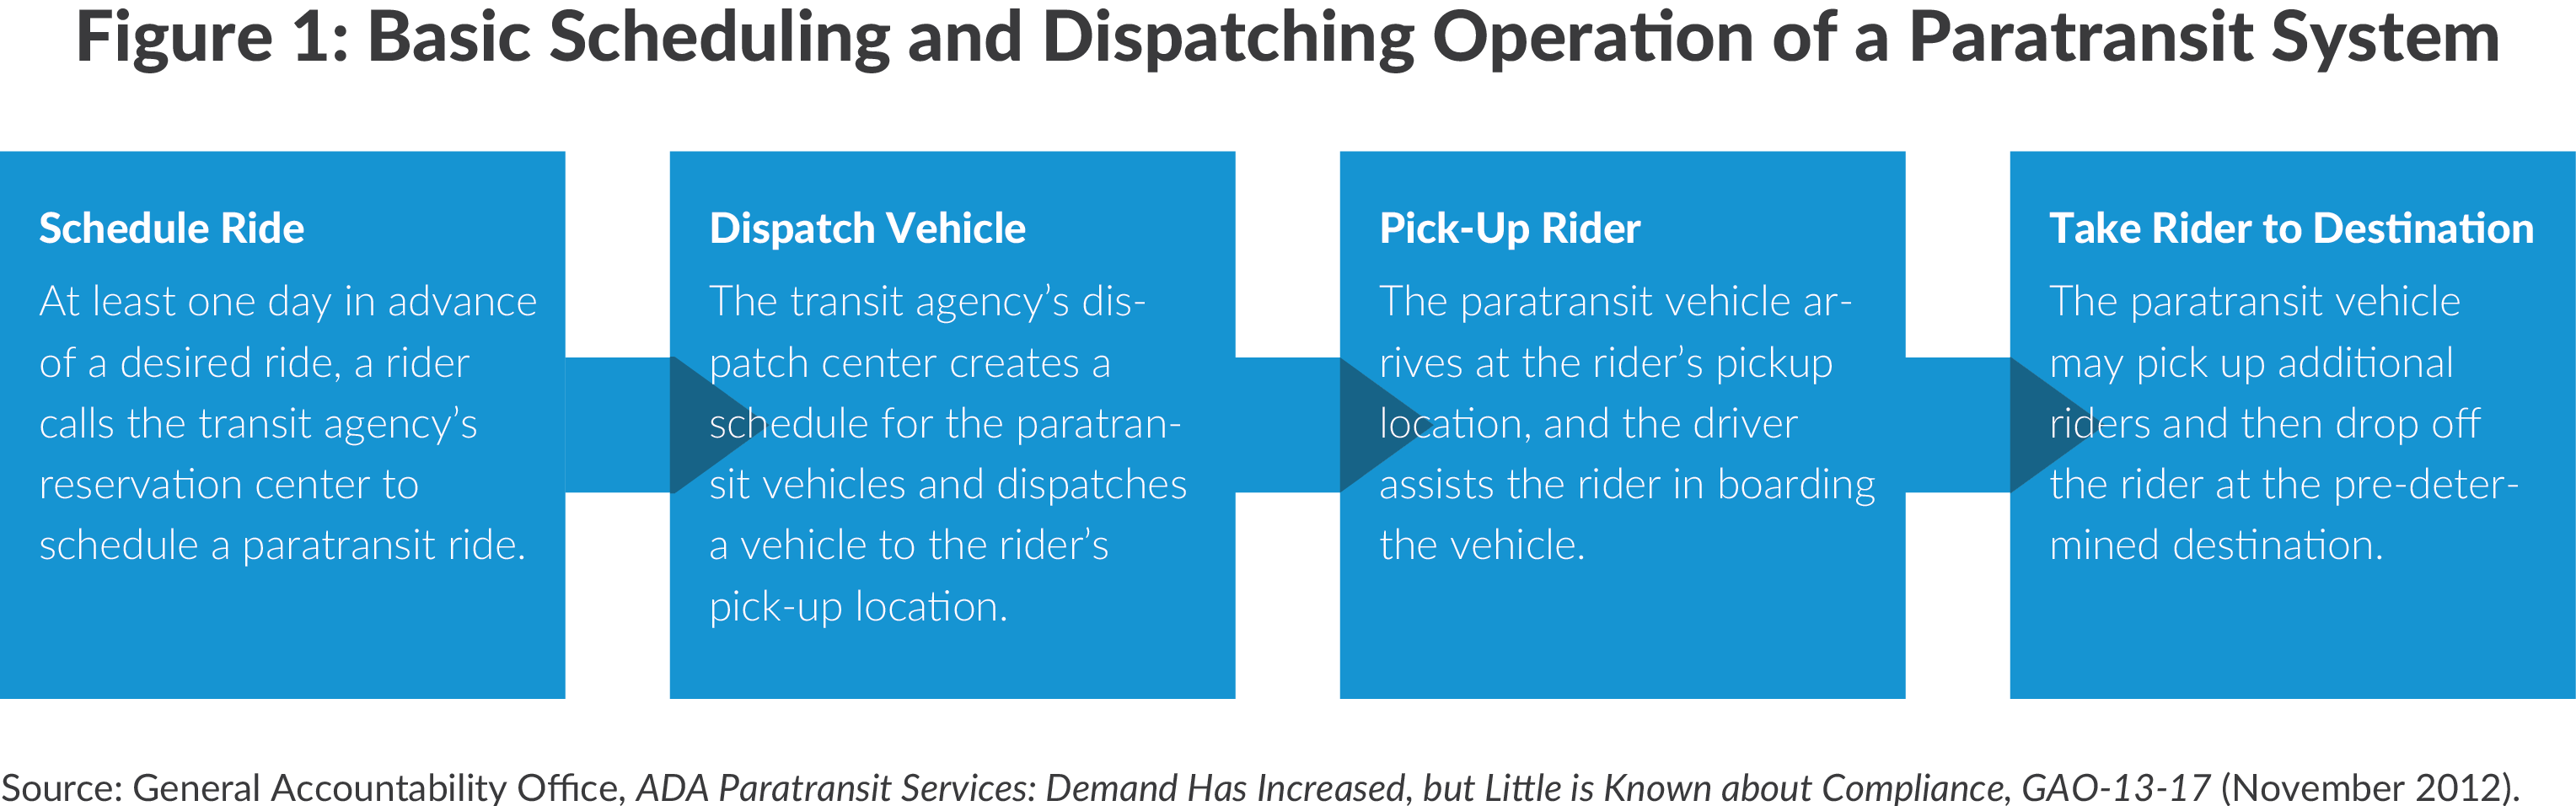
The paratransit service may take an eligible rider from a point of origin to desired destination or may be a “feeder” service. For applicable users, feeder service provides transportation to and/or from an accessible bus stop or rail station.9 Paratransit providers are expected to provide “origin-to-destination” service, which ensures users are able to use paratransit service to get from their point of origin to their point of destination even if that requires assistance outside the vehicle. Rather than stipulate “curb-to-curb” service, where providers are expected to assist passengers in entering and exiting vehicles, or “door-to-door” service, where providers must assist passengers from the entrance of their origin to the entrance of their destination, federal rules allow local jurisdictions to choose, recognizing certain individuals may be more suited to one or the other.10 With the exception of trips completed by taxicab or for-hire vehicle, AAR provides door-to-door service to all registrants rather than determining the needed level of service for each trip individually.
Figure 1 illustrates the steps in scheduling and dispatching an ADA paratransit trip. Though each transit agency operates differently, the figure explains a generic model.
Transit agencies must establish a process for determining eligibility; however, neither the ADA nor the FTA stipulates a method for doing so. Most agencies use some combination of self-certification, medical professional verification, in-person interviews, and in-person functional and cognitive assessments.11
Access-A-Ride’s Founding and Transfer to the MTA
New York City’s paratransit program, AAR, was operated by the municipal Department of Transportation and began service in January 1990 in compliance with the State’s Handicapped Transportation Act. The program offered door-to-door service in wheelchair lift-equipped vans, operating from 7 a.m. to 7 p.m. on weekdays and 10 a.m. to 6 p.m. on weekends and holidays. In 1991 the program cost the City $12 million for 225,294 trips, and in 1992 cost $10 million for 297,462 trips.12
However, the City’s program did not meet the federal ADA standards for paratransit service comparable to fixed-route service. First, AAR operated on limited hours, not 24 hours a day like New York City’s subway and bus systems. Second, the City’s program denied a large share of trip requests owing to capacity constraints; from 1990 to 1992 AAR denied almost one in five trip requests. These denials were not permitted under ADA regulations. The ADA also placed responsibility for paratransit with local transit agencies; in New York City this was the MTA rather than the local Department of Transportation. Federal ADA standards would not be fully effective until 1997, but compliance would require changes in the New York City service.
In May 1993 the City and the MTA agreed to transfer AAR to the MTA in July of that year. As part of the transfer agreement, State law was amended to dedicate a portion of the Urban Tax (a tax on certain real estate transactions in New York City) to the MTA for its paratransit program, and the City committed to annual appropriations to the MTA to support AAR. The City’s subsidy was set at one-third the operating deficit of AAR with a cap of 120 percent of the previous year’s appropriation.13
The MTA sought to bring AAR into compliance with federal requirements. From 1992 to 1996 total trips grew from 297,000 annually to 575,000. Over this period program costs grew from $10 million to $23 million annually, and the average cost per trip increased from $34 to more than $40. (See Figure 2.)

1997 to 2008: Mushrooming Growth
Beginning in 1997, AAR experienced 12 years of extraordinary growth. Ignited by expanded ADA regulations, registrants grew by a factor of 3.6; completed trips and contracted vehicles in service grew by a factor of 9.4; and total expenses grew by a factor of 15.8.14 (See Figure 3.)
The first major change occurred when federal courts ruled ADA paratransit service must ensure all eligible individuals can obtain a paratransit reservation at any time fixed-route service is available. 15 For the MTA this was particularly onerous, as the transit system operates 24 hours a day, 365 days a year. Complying with this ruling led to an increase in the share of trip requests completed from 68 percent in 1998 to 76 percent by 2000. To meet this increase in completed trips the MTA increased the size of the paratransit fleet to meet 100 percent of demand and contracted additional vehicles to anticipate future capacity needs. From 1996 to 2000 the MTA more than tripled the number of vehicles in service from 201 to 633. Improving service led to lower productivity when measured as the number of AAR trips completed per hour of service. In 1996 AAR completed 1.29 trips per hour; by 2000 that had fallen 24 percent to 0.98 trips per hour of service.16

A second major regulatory change occurred in 2001 after a legal settlement further limited the MTA’s flexibility by requiring paratransit travel times comparable to the public transit system. In order to meet these guidelines, the MTA had to purchase additional vehicles and pay contractors for the additional hours needed to complete the same number of trips in a more timely fashion, decreasing the service’s efficiency. Between 2000 and 2002 AAR productivity fell another 7 percent, dipping below 0.92 trips per hour of service.17
As paratransit service improved, growing demand required more vehicles, which involved expanding carrier contracts. New carrier contracts exposed the MTA to renegotiated reimbursement rates and increased vehicle maintenance and insurance costs. In response, the MTA began shifting some trips from the dedicated vehicles under contract to other carriers. Beginning in 2002 AAR began supplying paratransit trips for ambulatory customers with taxicabs, liveries, and black cars. At that time, more than three-fourths of paratransit registrants did not require a wheelchair lift-equipped vehicle, and delivering service with a lower-cost sedan met ADA guidelines and saved money. Particularly during peak demand, shifting appropriate customers to taxicabs and liveries allowed the MTA to provide service more cheaply and eased the need to increase the number of contracted vehicles. By 2006 the City of New York Independent Budget Office calculated the use of taxicabs and liveries helped AAR reduce costs by 7 percent.18
Even with these efforts, AAR expenses continued to grow. From 2002 to 2007 the program’s cost grew at an average annual rate of nearly 17 percent. The MTA’s financial plans began referring to AAR as an “uncontrollable cost.”19 As the 2008 recession upended public sector budgets, the MTA faced a paratransit budget projected to double again by 2011.
2009 to 2016: Reining in Costs
By 2009 paratransit growth was unsustainable: AAR costs had grown 56 percent over two years and subsequent updates to the MTA’s financial plan anticipated paratransit expenses to grow to $913 million by 2014. Public budget crises brought on by the 2008 recession magnified the need to reform the paratransit program.
The MTA’s 2009 budget included a paratransit savings plan that proposed cutting costs and raising revenues to save $57 million. This proposal included doubling paratransit fares, reforming cancellation and no-show policies, expanding use of taxis and for-hire vehicles, and renegotiated rates with contracted carriers.20 However, the MTA struggled to meet its savings target.21 The 2010 budget included new targets; $40 million in 2010 and $80 million annually thereafter.22 This commitment began paying dividends saving more than $230 million annually by 2012. (See Table 1.)

The largest savings, $107 million, came from reduced trips, which the MTA attributes to a closer alignment with ADA eligibility guidelines and converting trips to fixed-route service. Converting more trips to taxicabs saved $34 million, and fleet reduction savings from reduced insurance costs and fewer vehicle purchases saved $24 million. Changes to carrier contracts—the termination of two carrier contracts and a paratransit rate reduction applied to all other carriers—combined saved more than $40 million. A variety of administrative efficiencies and other initiatives account for the remainder. With these efforts and continued vigilance in identifying and implementing paratransit savings, the MTA has made AAR less costly. By the end of 2016 the agency expects to have reduced its projected annual paratransit expense by more than $850 million, with cumulative savings approaching $2 billion.
Two policy changes have been instrumental to these results. The first is the expanded use of in-person assessments to determine eligibility. Prior to 2007, the MTA required only selected applicants to visit eligibility centers for an in-person assessment: applicants requesting personal care attendants (PCAs), applicants with cognitive disabilities, applicants recertifying, and children. These applicants represented approximately half of the total. Beginning in 2007, all applicants were required to perform an in-person assessment with a certified professional at the eligibility determination unit, providing more scrutiny to the eligibility process and an increase in denials. From 2005 to 2009 AAR denied 6.5 percent of applicants; from 2010 to 2013 the rate more than doubled to 13.6 percent. Wider use of in-person assessments helped reduce registrants to 144,692 in 2016, down 15 percent from the program’s peak of 170,140 five years earlier.23
The second policy change is the introduction of feeder service.24 In 2010 the MTA began scheduling paratransit trips that either originated or terminated at bus stations. This trip-by-trip screening and extension of feeder service resulted in significant savings in two forms. First, feeder service reduced vehicle service hours by generating shorter trips; these savings are often modest. For the nearly 10,000 feeder trips completed in 2015, the MTA estimates a one-third reduction in vehicle service hours. Assuming these trips replaced average trips in terms of vehicle service hours this represents $125,000 in savings.25 Second, the offer of a feeder trip is more likely to be turned down by registrants than a door-to-door trip. While other factors may be involved, the share of requested trips not scheduled increased from 6 percent in 2009 to 11 percent in 2010 when AAR introduced feeder service, a drop of an estimated 336,000 trips.26 (See Figure 4.) In 2015 the MTA recorded 34,014 feeder trips refused, representing an estimated $2 million in savings.27 Since its inception, feeder service has saved the MTA $30 million in direct costs, which does not include dampened demand on trip requests.28

The MTA expected a third initiative, the Zero-Fare MetroCard program, to further reduce trips and costs. First proposed in 2012 by a consultant report, the program seeks to encourage use of mass transit rather than individualized paratransit service whenever feasible by offering registrants free use of the fixed-route system.29 The MTA planned to issue Zero-Fare MetroCards to all AAR registrants, eventually using the card as a customer’s primary identification for AAR services; however, the agency has pared back this goal, instead issuing Zero-Fare MetroCards only to AAR registrants who request them. Citing the consultant’s report, the MTA expected to reduce paratransit demand by 15 percent.30 While the growth in trips has slowed since the introduction of the Zero-Fare MetroCard in 2013, it is unclear how much of this deceleration is attributable to this program. Moreover, in its July 2016 financial plan the agency has proposed changing the program from a Zero-Fare program into a reduced fare program.31
After increasing 43 percent from 2007 to 2009, paratransit trips grew a more modest 6.2 percent in 2010 and decreased 2.5 percent in 2011. (Refer to Figure 3.) Completed trips increased 3.2 percent in 2012 but have fallen each year since, totaling less than 6.4 million in 2015. Total paratransit expense growth has slowed, averaging 0.8 percent annually since 2009. Despite these trends, the MTA anticipates faster growing costs in the future.
Access-A-Ride Today
Currently AAR offers shared-ride, door-to-door, and feeder paratransit service 24 hours a day, 365 days a year and provides service to a corridor within three-quarters of a mile from the local bus and subway system through New York City and in portions of Nassau and Westchester counties. Customers pay the single-ride transit fare—currently $2.75—to use the system and may travel with a pre-approved personal care attendant (PCA) free of charge. Customers may also travel with additional guests as can be accommodated on a case-by-case basis; guests must pay $2.75 to ride.
To apply for AAR potential registrants schedule an in-person assessment at one of six eligibility centers where they undergo an interview or a functional test with a health care professional, or both, to determine their ability to use the fixed-route system. The eligibility determination unit, staffed by physical and occupational therapists, reviews assessments and verifies whether or not an applicant meets the requirements for either full or conditional eligibility, which is only for times when certain conditions limit travel on a fixed-route such as weather or navigational conditions.32 Eligibility may be continual, meaning a condition is permanent and the customer is not required to reapply, or temporary, for customers with short-term limitations. With the exception of those with continual eligibility, all registrants must recertify their eligibility every five years.33
To schedule service, customers call to reserve a trip from one to two days in advance between 7 a.m. and 5 p.m. and provide a preferred pickup time or an appointment time—the time a customer wishes to arrive at his/her destination. The MTA also accepts reservations online. For some trips, a reservation may not be scheduled immediately; in these cases, AAR collects additional requests before bundling trips together into the most efficient routes possible. Customers receive a response by 7 p.m. with their pickup time. Moreover, customers may be denied door-to-door service and instead offered feeder service.
AAR provides its services through a constellation of for-profit and not-for-profit contractors. Separate contracts govern AAR’s eligibility determination unit, command center which receives trip requests and designs schedules and routes, and carriers that complete these routes.34 Though the transit agency owns vehicles used by its contracted carriers, the maintenance of these vehicles is the responsibility of the carrier.
AAR engages three types of contracted carriers. The first type are dedicated service carriers (DSC), for-profit and not-for-profit firms that operate specifically equipped vans and cars purchased and owned by the MTA that are solely dedicated to delivering paratransit service. In 2015 the MTA contracted with 15 separate DSC firms to complete 4.7 million trips, approximately three-fourths of total paratransit trips. The second type are broker car services (BCS), which consist of two brokers responsible for scheduling and dispatching paratransit trips for ambulatory customers. BCS brokers subcontract with black car and livery providers. In 2015 BCS completed nearly 1.3 million trips, approximately one-fifth of all paratransit trips. The third type is taxicabs and independent liveries and black cars, which the MTA uses to supplement service for ambulatory customers. The majority of these trips are approved for reimbursement, meaning customers pay the appropriate fare—metered in the case of taxicabs or street-hail liveries (“green cabs”) or negotiated in the case of black cars and liveries—and AAR reimburses the customers this amount less the paratransit fare ($2.75). In 2015 this third category of providers was responsible for nearly 400,000 trips, about 6 percent of the total.35
DSC contracts include variable payments based on the amount of time a vehicle is in service, fixed payments for maintenance of paratransit vehicles, and fixed payments associated with a firm’s overhead. BCS brokers and their subcontracted drivers receive per-trip payments determined using a zone-based rate schedule.36 The MTA purchases wholesale fuel and insurance coverage on behalf of DSCs according to the number of vehicles contracted. In addition, the MTA employs 213 direct employees who administer AAR, primarily by monitoring contractor performance.37
AAR’s 2015 expenses of $472 million were divided among paratransit service contracts, personal services, and other than personal services. (See Table 2.) Paratransit service contracts account for 81 percent of the total and include carrier services ($349 million), command center ($24 million), and eligibility certification and other ($10 million). Personal services totaled $22 million and funded the 213 paratransit staff at the MTA. Other than personal services totaled $67 million and included general liability insurance ($36 million), fuel ($15 million), and other expenses ($16 million), mostly related to various professional services to support AAR.

AAR is supported with four revenue sources. Fares collected from customers and their guests totaled nearly $18 million in 2015 and covered 4 percent of total program cost. Receipts from the City’s Urban Tax, a combination of real estate transfer and transaction taxes on certain properties in New York City, totaled $63 million or 14 percent of total program costs. The third source is the subsidy from the City of New York, which in 2015 was $124 million or 27 percent of program costs.
The fourth and largest source is an internal MTA cross-subsidy—revenues generated by other agency activities, as well as dedicated taxes necessary to balance the paratransit budget. This cross-subsidy totaled $266 million in 2015, more than half of total AAR costs. This sum is equal to 11 cents per MetroCard swipe, or 6.3 percent of the average fare revenue per transit ride.38 The heavy reliance on this cross-subsidy underscores the impact of the AAR program on the rest of the MTA’s financial plan.
In addition to operating expenses and revenues, AAR requires capital outlays. The MTA’s capital program includes purchases of paratransit vehicles for DSCs to operate. In the 2010-2014 capital plan period, the MTA purchased 192 paratransit vehicles for $9.4 million. During this capital plan, the MTA shifted its purchasing strategy, investing in lower-cost vehicles than AAR’s traditional lift-equipped vans. Under this procurement reform, the MTA will be able to fund future vehicle purchases through AAR’s operating budget.
The Outlook to 2020
The MTA’s latest financial plan anticipates significant growth in AAR trips and expenditures through the end of the financial plan period. Trips are projected in increase by 7.4 percent in 2017 and thereafter 6.5 percent annually with expenditures reaching $646 million in 2020.39 (Refer to Table 2.) Since trip volume is the major driver of expenses, it is important to assess the reasonableness of the assumed growth rate of 6.5 percent. A case can be made that this rate is too high. Since 2009 trips have grown at an average annual rate of 0.3 percent, and a shift to steady growth after seven years of relative stability could be questioned. But a case an also be made that the assumed rate is appropriate. The recent stability is the result of special efforts to limit eligibility and trips that may have had a one-time effect; moreover, absent new policy initiatives and given the maturing of the large baby boomer cohort, a return to the double-digit growth of previous years is plausible. Given these uncertainties, the 6.5 percent figure appears reasonable, but is subject to wide variations in the coming years.
Total expenses are expected to grow an average of 8 percent annually, mostly driven by average annual increases in carrier services of 6.9 percent. While carrier expenses largely track trip growth, DSC payment rates include adjustments for cost of living increases, leading to expense growth above 6.5 percent. Insurance and fuel are expected to increase at relatively high average annual rates, 15 percent and 14 percent respectively. As a variable cost, fuel expense follows trips completed but is also a function of wholesale fuel prices, which have fallen from 2014 levels, but that the MTA conservatively assumes will rebound in the future. Insurance premiums are expected to grow as rates increase and as the MTA increases the number of vehicles contracted to meet increasing demand.
Other expenses are expected to more than double in 2017, from $10 million to $24 million, as the MTA will begin funding vehicle purchases through the operating budget. These expenses are expected to decrease 18 percent in 2018 before increasing at an average rate of 9 percent through 2020.
Fare revenue is projected to grow 6.7 percent annually. This projection assumes the MTA keeps the base transit fare at $2.75 during the agency’s planned fare increases in 2017 and 2019.40
Urban Tax receipts are expected to fall 8 percent in 2016, 6 percent in 2017, and 3 percent in 2018 owing to the cyclical nature of this revenue source and larger-than-expected real estate tax receipts in New York City in 2015. The MTA conservatively estimates Urban Tax receipts will remain flat in 2019 and grow 4 percent in 2020. However, a downturn in the local economy, particularly if such a downturn has an outsized effect on commercial real estate, can lead to significant decreases in Urban Tax receipts. For example, following the historically harsh 2008 recession Urban Tax receipts fell 84 percent. The dynamic nature of Urban Tax revenues affects the City’s subsidy. Direct payments from the City are expected to grow at an average annual rate of 9.5 percent.
Despite significant increases in fare revenue and the City subsidy, the necessary internal MTA cross-subsidy will also grow notably. Annual average increases of 9 percent are needed, bringing the sum to nearly $385 million in 2020.41 In that year the cross-subsidy would equal about 16 cents for every MetroCard swipe on the subways and buses.
The MTA is seeking to keep the cross-subsidy down by finding ways to lower AAR expenses. The agency’s July 2016 financial plan highlights fuel savings, lower insurance, and lower scheduling and certification costs to help reduce paratransit costs by an additional $58 million cumulatively from 2017 to 2020. The MTA expects to meet these savings goals by more closely aligning with requirements of the ADA.42 However, even if this goal is realized, the necessary cross-subsidy from transit would still be equal to about 15 cents per ride.
In brief, the current fiscal problems of AAR are projected to worsen. The high rate of utilization likely will grow, the cost per trip will increase, and the cost burden imposed on the rest of the transit agency, and by extension regular subway and bus riders, will become greater.
A Comparative Perspective
New York City’s extensive transit network makes comparative analysis difficult. New York’s 469 subway stations dwarf the total for the next largest number in the United States—146 in Chicago—and the bus system’s 1,711 directional route miles could stretch from Midtown Manhattan to Atlanta and back.43 New York City is both the nation’s largest Metropolitan Statistical Area by population and has the largest share of residents using public transportation to commute to work, 30.4 percent, or six times the national share.44 The ridership is immense: 2,500 passengers boarded New York’s subways and local buses in the time used to read this paragraph. The scale and pervasiveness of transit in New York is a major reason AAR completes more trips than the paratransit programs in Boston, Philadelphia, Washington D.C., and New Jersey combined.
Nonetheless, comparative analysis can be instructive. Fully 28 other transit agencies in the United States completed at least one-half million paratransit trips in 2014 including 14 with more than 1 million annually.45 With appropriate adjustments for population size and regional cost factors, comparisons among this group can be meaningful. Three key findings emerge from this analysis:
- (1) AAR has a relatively high volume of registered users and utilization per capita;
- (2) AAR’s cost per trip is unusually high; and
- (3) AAR has relatively low productivity based on a frequently used indicator.
High Utilization
In New York a larger share of the population is registered to use paratransit than in any of the other cities with large paratransit services. With 144,692 registrants, AAR has 17 registrants for every 1,000 service area residents, highest among the 29 peer systems. (See Table 3.) AAR also has the fifth highest number of paratransit trips per capita, completing 759 trips per 1,000 residents in 2014, 49 percent higher than the median for all large systems. Though the number of disabled persons and seniors living in a region may affect paratransit registration, the data suggest this is not the cause of the MTA’s relatively high number of registrants: the share of seniors—individuals older than 64—residing in the MTA’s service area is 12.2 percent, slightly below the median for all large systems, and the share of disabled persons residing in the MTA’s service area is 10.3 percent, the median for all large systems.46
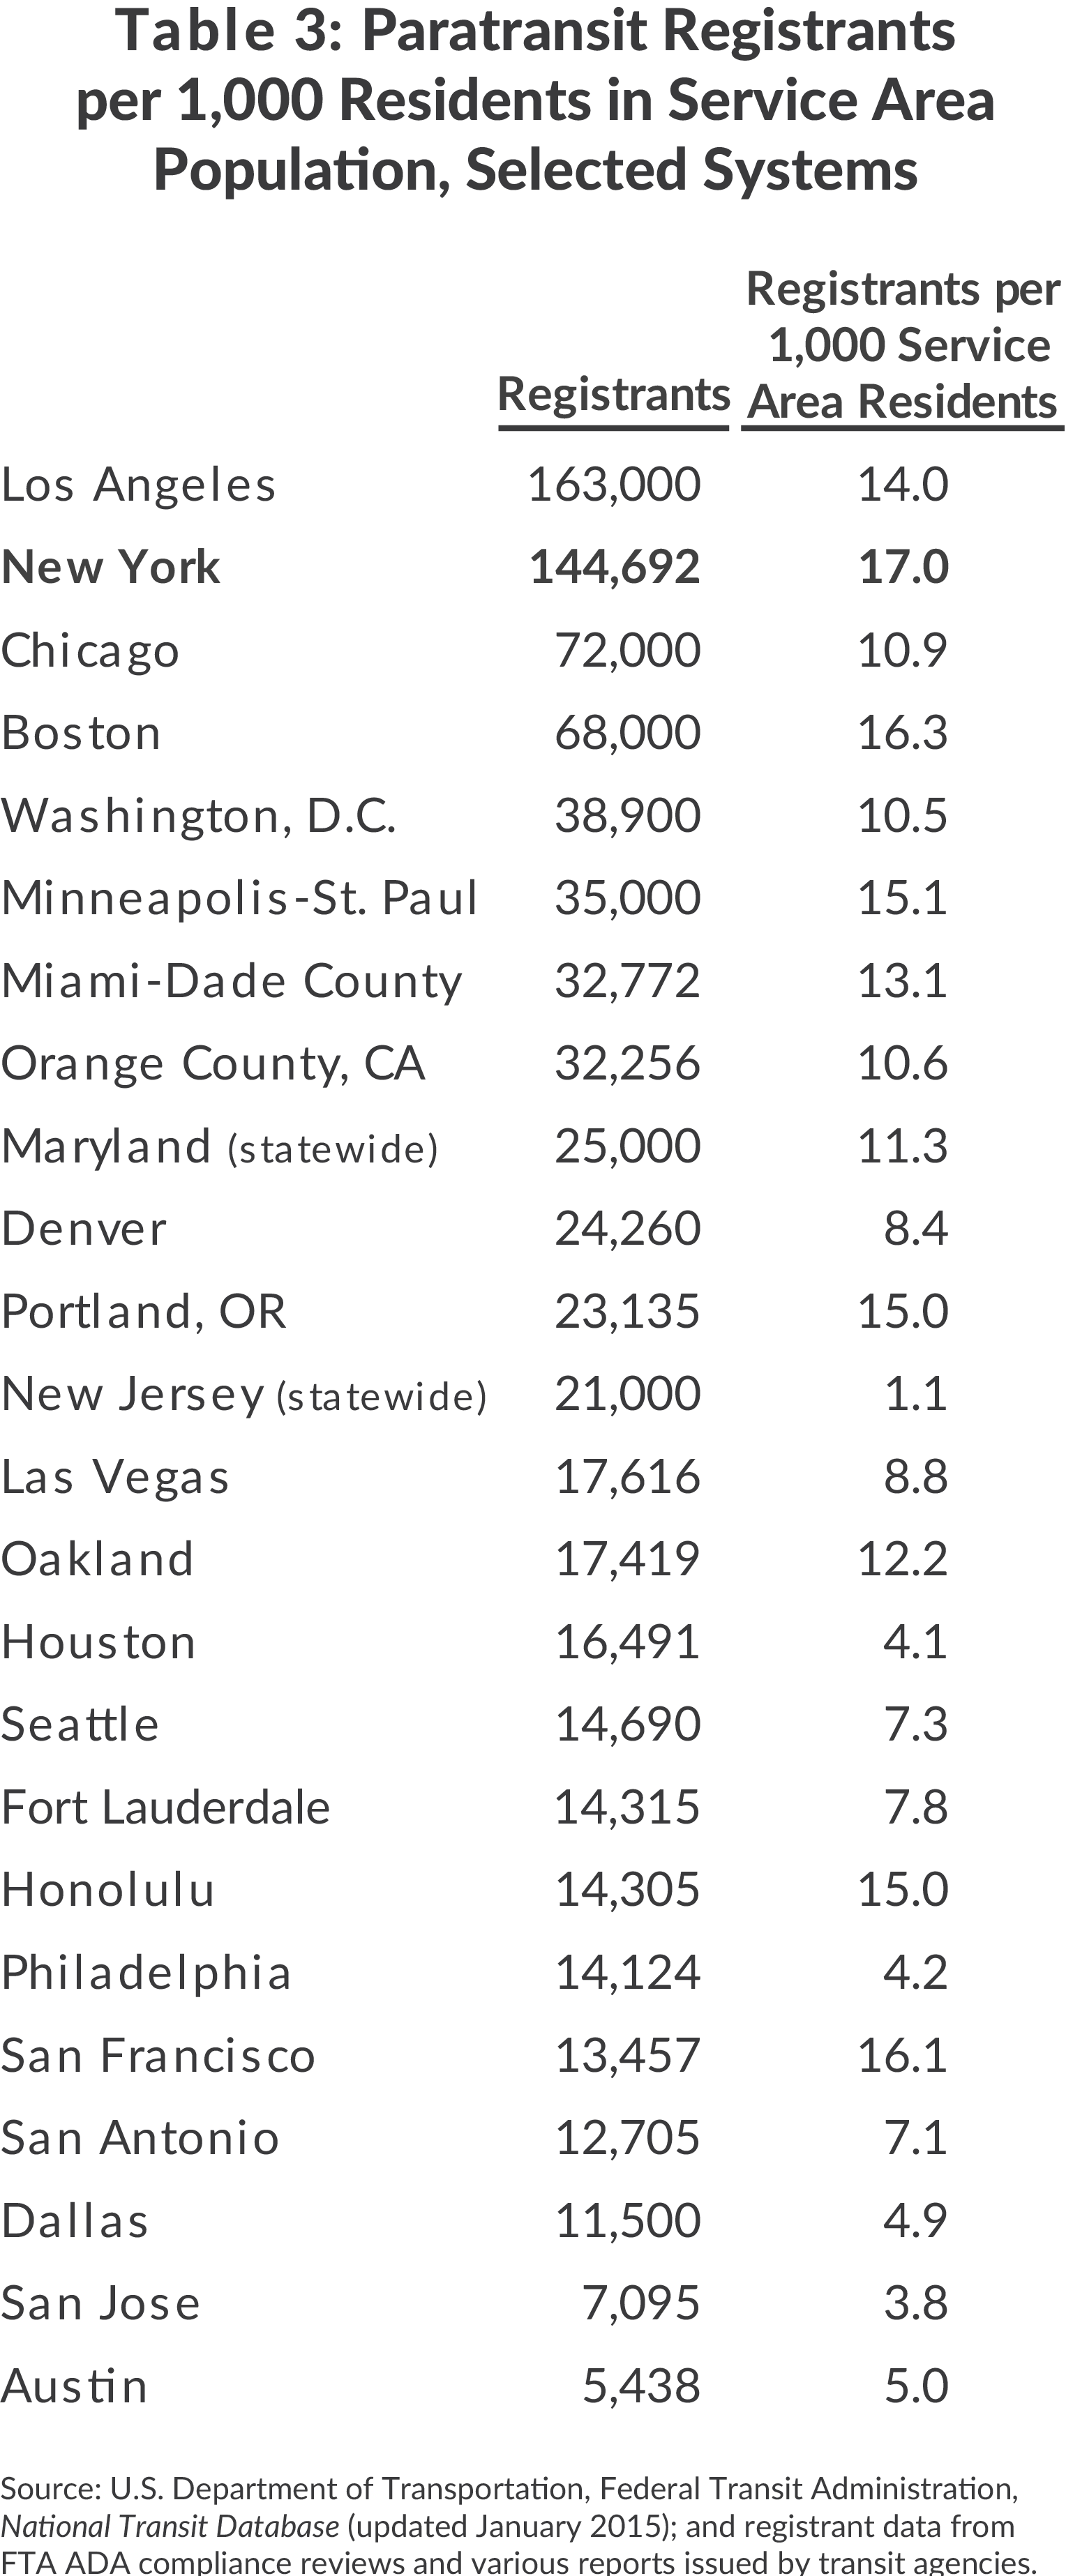
One possible alternative explanation for the higher number of registrants in the service area is that the AAR service area covers a larger share of the city’s land area than is the case for other systems. In addition it is possible that paratransit is more heavily used in New York City because disabled persons have fewer mobility options than in other places. For example, relatively few social service programs provide paratransit service in the city, and car ownership is significantly lower than in other major metropolitan areas, which may impede other types of ridesharing with family members or friends.47
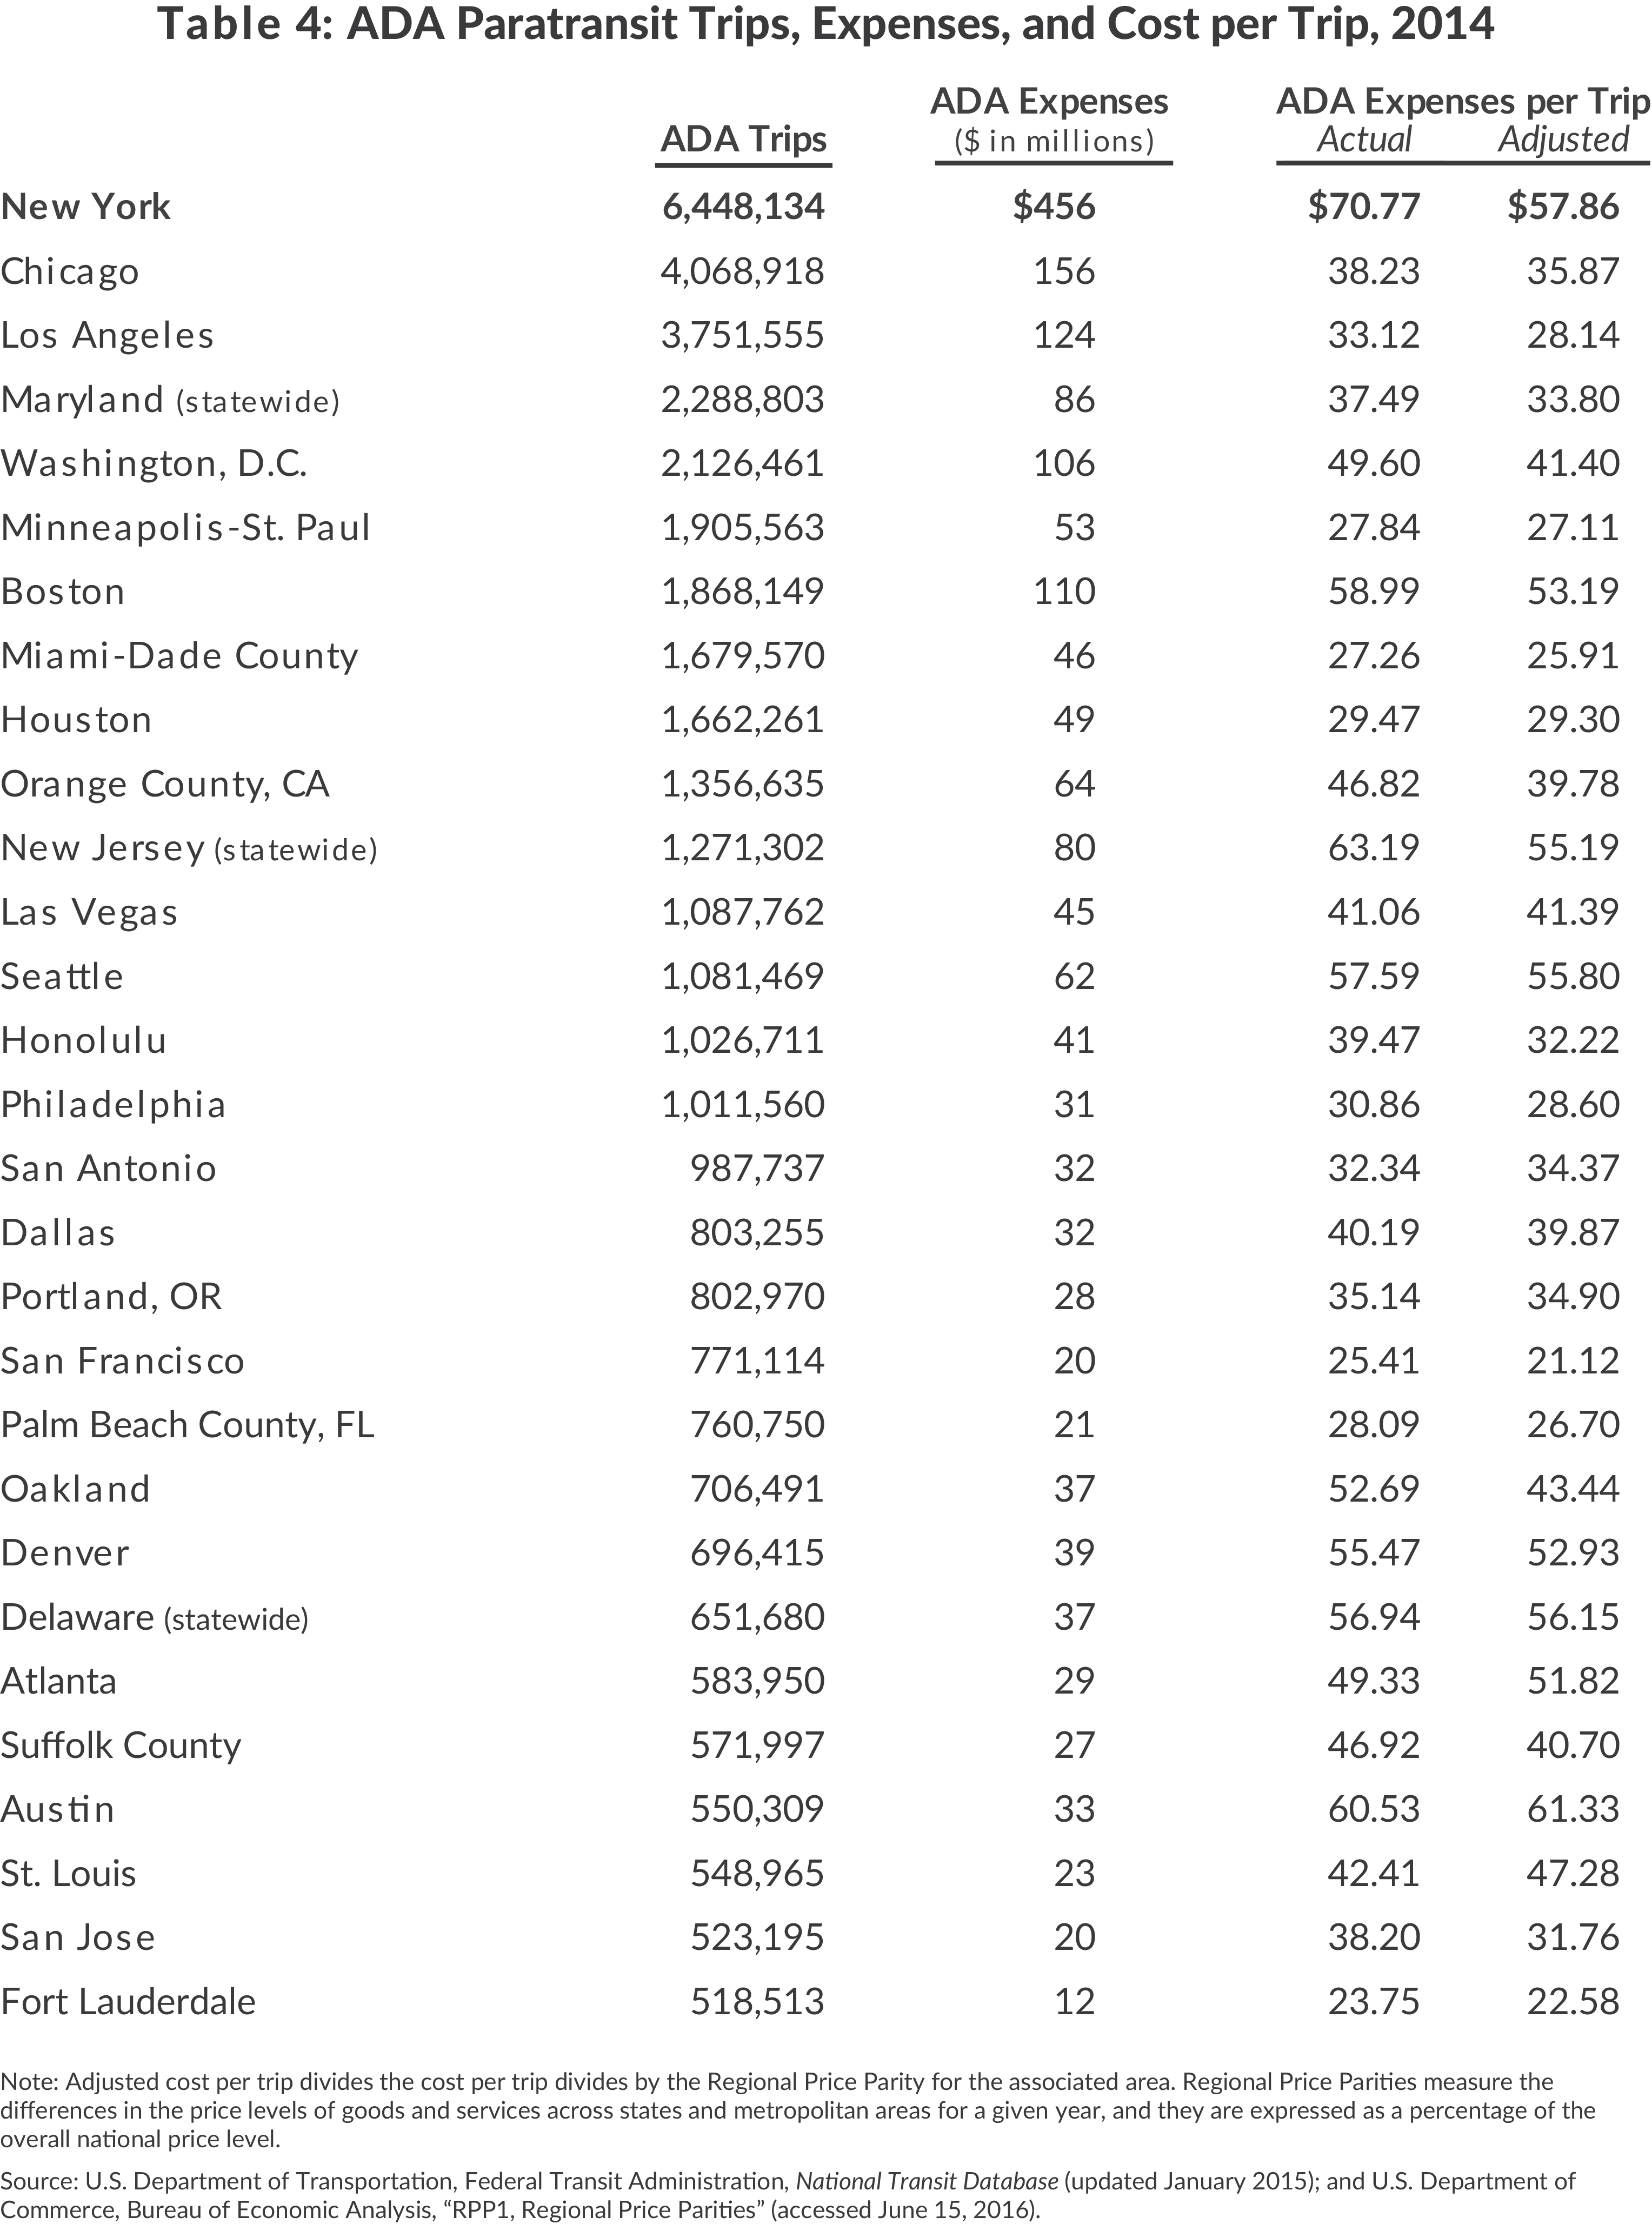
Based on data from 2014, the latest year for which comparative data are available, AAR’s cost per trip of more than $70 is the highest in the nation and well above second place New Jersey Transit at $63. (See Table 4.) Adjusting for regional cost differences makes AAR only slightly less an outlier; it falls to second place behind only Austin, Texas but still well above other large cities such as Chicago, Los Angeles, and Washington, D.C.
Low Productivity
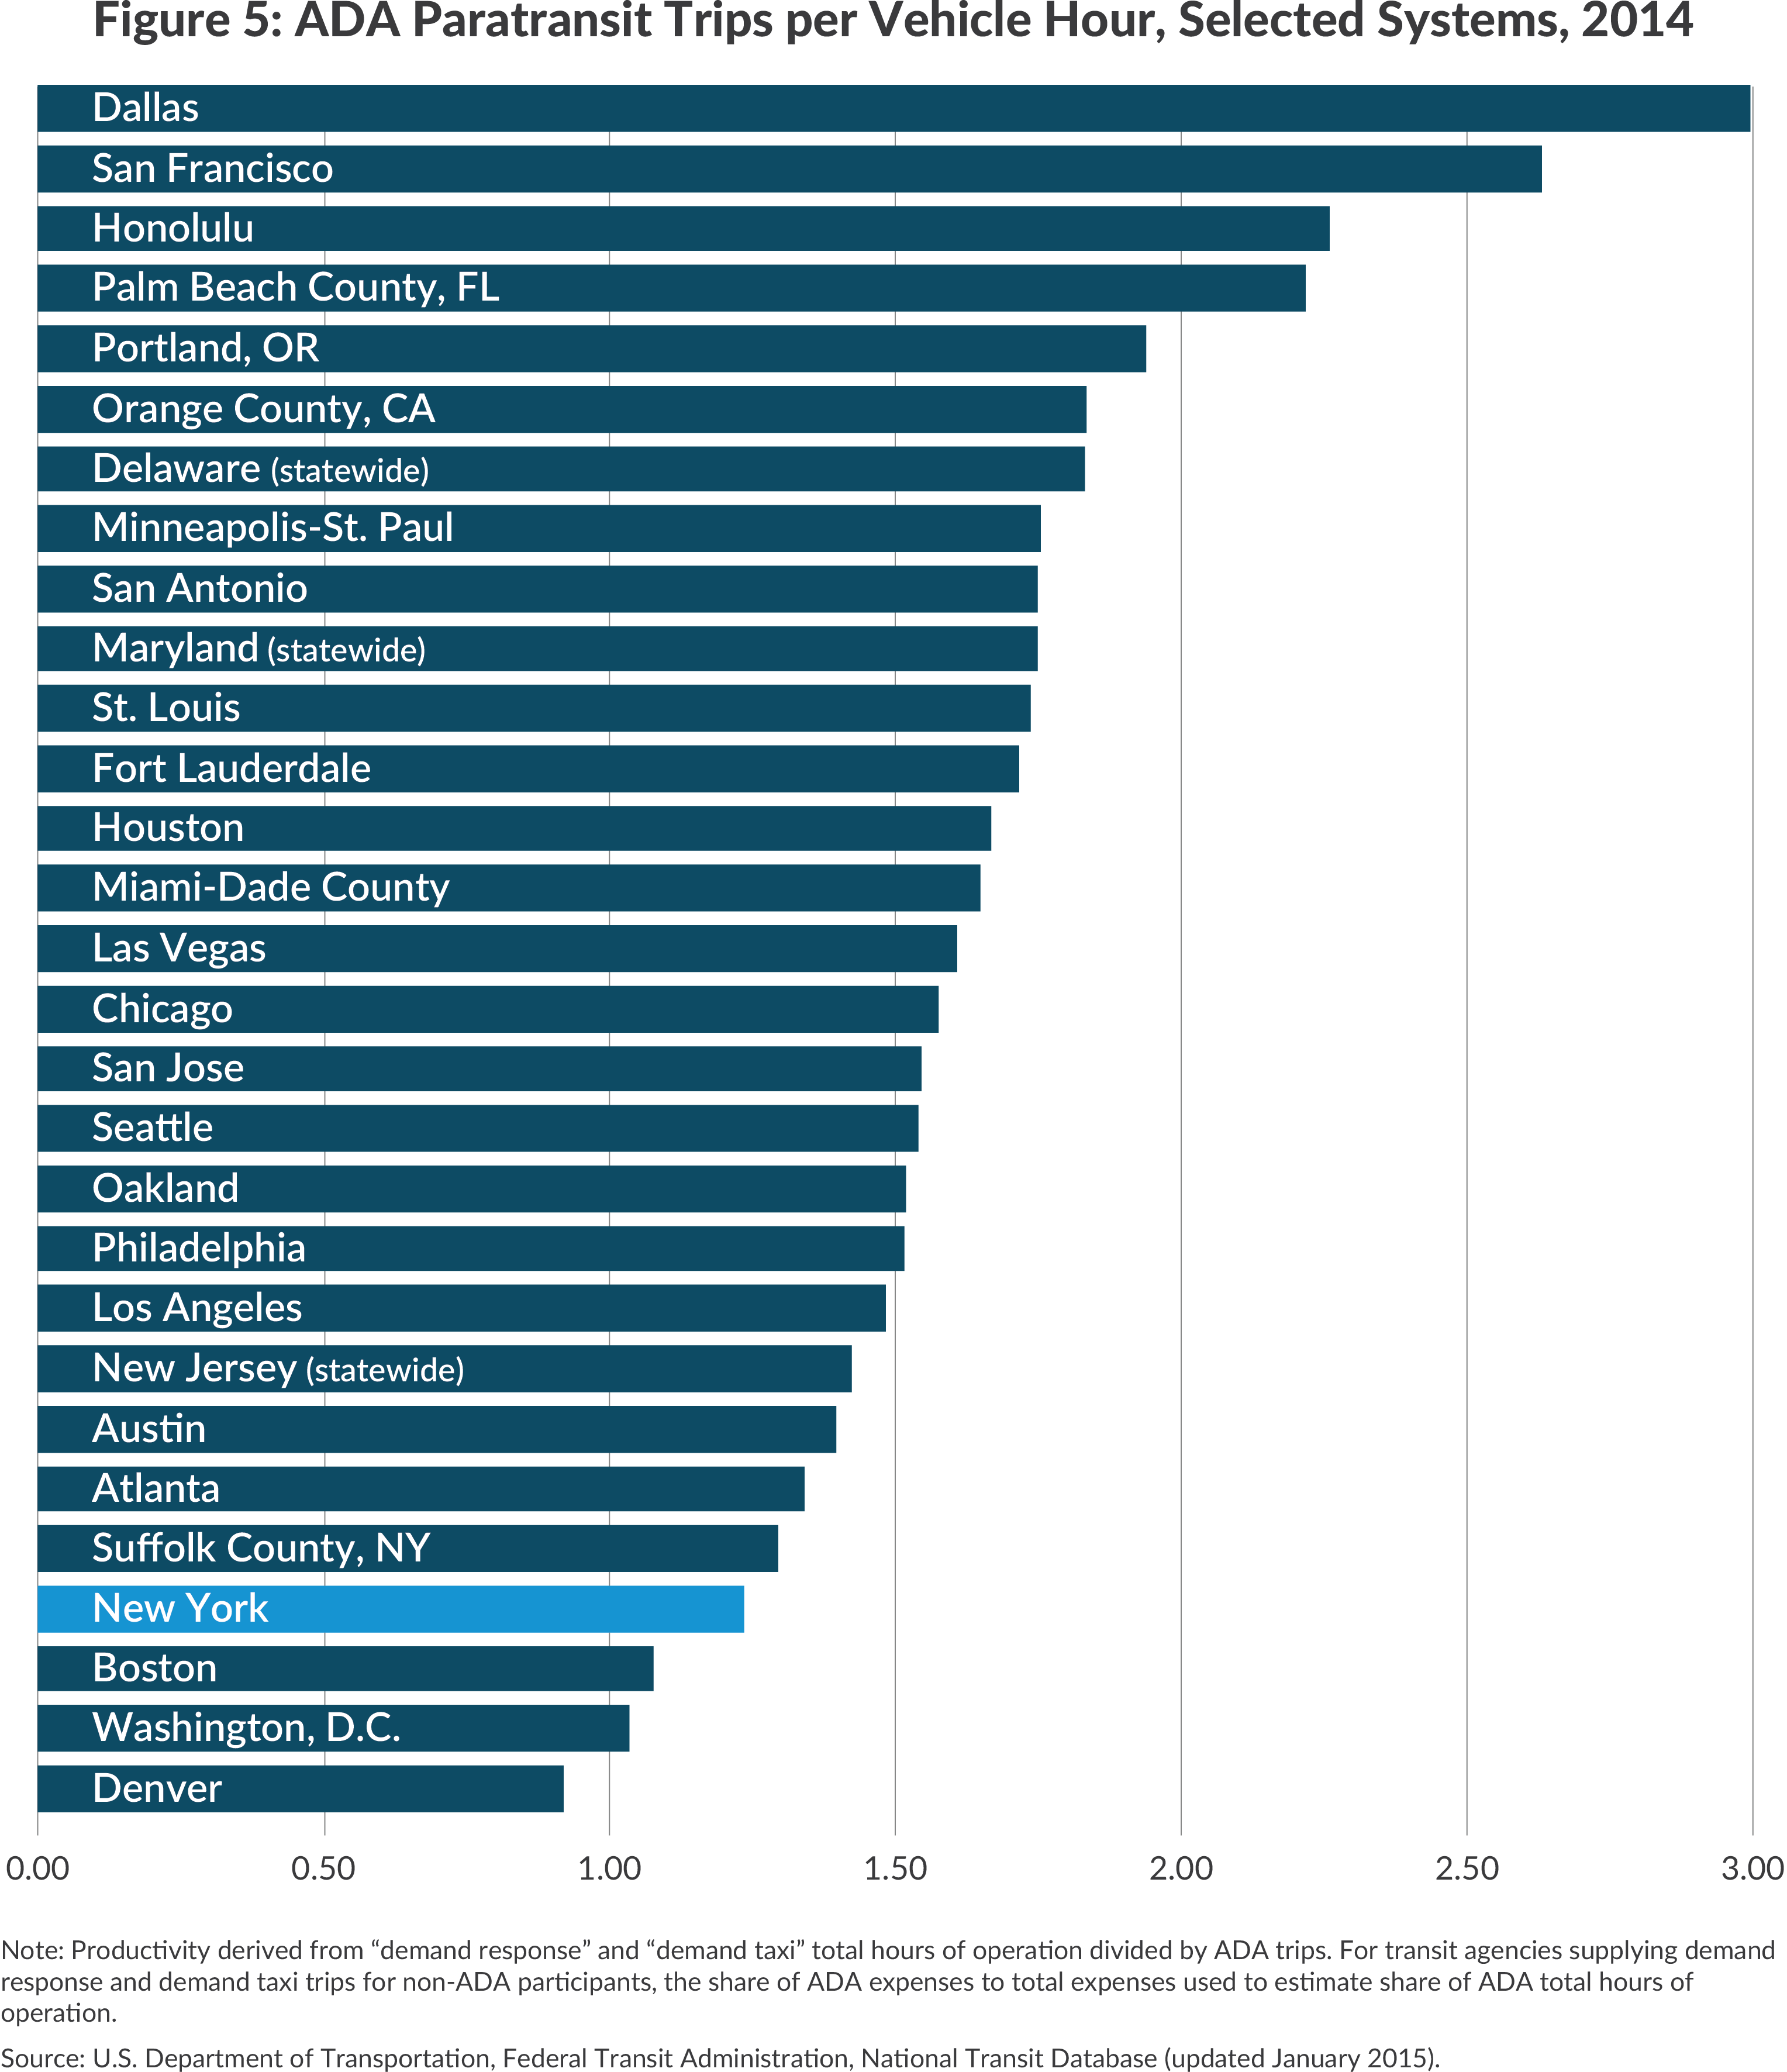
AARs’ high cost per trip is related to low productivity. A commonly used measure of paratransit productivity is the number of trips completed per hour of service. On this indicator AAR ranked 26th of the 29 systems. (See Figure 5.) AAR’s productivity of 1.23 trips per revenue hour was lower than all but Boston, Washington, D.C., and Denver and only 77 percent of the median for all large systems.48
Two factors that might be expected to influence this measure of productivity do not appear to be the source of AAR’s relatively low productivity. First, average trip length affects the number of trips a vehicle can complete in a service hour; a longer distance will take more time. Among the 29 systems, longer trips correlate with lower productivities, but AAR’s average miles per trip of 9.6 is the 5th lowest. The 4th and 6th ranked systems, Orange County, California and Chicago, traveled an average of 9.5 miles and 9.6 miles per trip and recorded 48 percent and 28 percent higher productivity than AAR, respectively.49
Second, the degree of traffic congestion in an urban area might influence productivity; more congestion would likely yield slower traveling speeds, increasing the number of service hours required to complete trips. However, data on congestion compiled by the Texas A&M Transportation Institute does not support this hypothesis. Among the 29 peer systems studied, higher placement on the Travel Time Index correlates with higher productivity.50
Two other factors may contribute to AAR’s low productivity compared to its peers. First, unlike any other system, AAR operates 24 hours a day. While traffic congestion may fall at night, fewer riders means the paratransit system is less able to combine trips and maximize efficiency while completing overnight trips. Second, the ADA requirement to keep paratransit travel times comparable to public transit trips is an added challenge in New York City, where bus and subway headways can be significantly smaller than other transit systems.51
While AAR operates in a unique transit environment, it is still much more expensive than other systems that also must navigate dense and congested urban regions. Given these findings, the MTA should pursue policies and practices that will make AAR more cost-effective.
Options for Improving Efficiency and Financing
Though AAR costs have remained below projected levels since 2010 and are on pace to decline in 2016, the program remains the most expensive in the country owing to high unit costs and high utilization. Moreover, its financing places a burden on users of the regular mass transit services rather than being more heavily supported by fares and general tax subsidies. Each of these problems is projected to worsen in the coming years.
Given this troubling outlook, the MTA should pursue three strategies to improve AAR’s efficiency and financing—lower the cost per trip, better manage demand for the service, and shift revenues from an internal cross-subsidy to other sources. Table 5 summarizes the estimated savings from eight options falling in these three categories.

Lowering the Cost per Trip
Although the MTA has had some success in containing AAR expenditures, the gains have resulted almost entirely from lowering the projected volume of trips rather than lowering the cost per trip. As shown in Figure 6, the $72.65 cost per trip in 2015 is the highest ever and is 4.5 percent above the figure for 2009 when serious cost containment measures were initiated. Taking into account general price inflation improves the trend somewhat, but the constant dollar (in 2015 dollars) cost per trip has remained within the range of $66 to $77 since 2003.

Increase Use of Broker Car Service
One way to increase efficiency is to ensure the least expensive type of appropriate vehicle is dispatched to complete a trip. Not all AAR users are the same; though the MTA distinguishes between trips requiring a wheelchair-accessible vehicle and trips than may be completed with a sedan, each may require either curb-to-curb or door-to-door service. The MTA meets the needs of its customers by providing three types of service: conventional, door-to-door paratransit completed by DSCs using wheelchair-accessible vans or sedans, trips by black cars and liveries associated with one of two BCS brokers, and taxicab trips pre-approved on a case-by-case basis.52
Table 6 shows the distribution of AAR trips by carrier type since 2008 and the 2015 average cost per trip by type. In 2008 non-DSC services accounted for 8 percent of all trips. This share grew as high as 37 percent in 2012 but has since declined to 26 percent.53 While the average DSC trip cost about $66 in 2015, rates vary based on the DSC. According to a report from the City Comptroller, per trip rates ranged from $47.57 to $92.15 per trip or between 2.0 and 3.9 times the cost of the average BCS trip and between 2.8 and 5.5 times the cost of the average taxicab trip.54 Approximately one-quarter of all trips are completed with non-carrier modes and more than half of all paratransit trips are completed by ambulatory customers. Approximately 1.1 million trips, 17 percent of the 2015 AAR total, do not require door-to-door service and likely could have been completed by a less-expensive, yet appropriate, carrier.55

Shifting appropriate customers from a DSC provider to a BCS provider could save between $24 and $69 per trip on carrier services using 2015 figures. Moreover, the MTA could gain fuel cost savings by shifting these trips to BCS, as black car and livery operators pay for their own fuel. Using 2015 trip totals as a base, each 1 percent of rides shifted from DSCs to BCSs would save between $1.7 million and $4.5 million in carrier service and fuel costs. Eliminating the nearly 1.1 million ambulatory, curb-to-curb eligible trips completed by DSCs could save between $29 million and $76 million.56
Additionally, the New York City Taxi and Limousine Commission (TLC), which licenses taxicab, for-hire vehicle, and paratransit vehicle drivers, could require all BCS drivers to provide door-to-door paratransit when applicable. Doing so would allow the estimated 702,000 ambulatory trips that may require door-to-door service to use BCS as well, saving up to an additional $50 million.
Taxicab and For-hire Vehicle Fare Subsidy Program
Another way the MTA could promote the use of more efficient modes is to establish a subsidy program for AAR trips completed by taxicabs and other for-hire vehicles. In such a program, paratransit registrants would be able to hail a cab or secure a black car or livery without reserving the trip in advance. The user would be responsible for paying the normal paratransit fare and the MTA would pay any metered fare above this amount. This subsidy would be delivered via a special debit card, voucher issued to the registrant in advance, or other fare media the MTA procures as part of a new fare payment system.
From 2010 to 2015 the MTA offered a similar service to selected customers based on their frequent use of certain trips, mostly those with regular trips to work and patients with recurring medical appointments for treatment such as renal dialysis. AAR pre-approved participants and issued them prefunded debit cards to use in taxicabs. Every two weeks the registrant would be billed the paratransit fare for each trip taken with the debit card and have their debit card recharged. Customers gained flexibility and the MTA achieved savings on these trips. Despite its success, the MTA’s vendor at the time ended its prepaid card program, and the transit agency was unable to replicate the prepaid card structure with another bank owing to customer privacy laws and know-your-customer rules. Rather than allowing a bank to issue cards directly to AAR customers, the MTA ended the program.57 Other jurisdictions, including Chicago and Denver, have also instituted programs like these, issuing vouchers to registrants to redeem with taxicabs or other for-hire vehicles. Like taxi service, a trip using Transportation Network Companies (TNCs)—such as Uber or Lyft—may fit this model, lowering costs and improving access for paratransit service. A pilot program in Boston will offer a debit card that works with Uber. The agency hopes to improve service by providing paratransit customers with the flexibility of same-day booking as well as a way to track vehicle rides.58 More than lowering unit costs, tapping into TNCs’ networks can provide the MTA with private sector software platforms that may be able to more efficiently deploy vehicles than its own systems, as well as more easily adapt to new technologies.59
The estimated average metered taxi fare in 2015 was $20.79 per trip. If the MTA created a subsidy program for taxi trips whereby customers paid the AAR fare ($2.75) and the MTA paid the remaining metered fare (on average approximately $18), the per trip cost would be lower than for DSCs or black cars or liveries operated through BCS. Assuming all of the 11 percent of AAR trips originating within the taxicab “hail zone” in Manhattan—south of 110th Street on the West side and south of 96th Street on the East side—were completed using such a program, the MTA could save an estimated $28 million.60 If customers using TNCs were encouraged or required to use carpooling options such as UberPool, LyftLine, or Via, savings could be as high as $37 million.61 Moreover, it may be appropriate to expand this expectation to the outer boroughs. Particularly with the advent of street-hail liveries and app-hailed for-hire vehicles, a fare subsidy might extend beyond Manhattan’s hail zone. Removing these trips from the manifests of DSC vehicles would also enable them to serve their remaining customers more quickly and efficiently.
Such a subsidy would raise two potential issues—induced demand and driver reluctance to accept paratransit trips. In many cases customers would rather reserve a vehicle on the day of the trip—or better still, hail a cab or connect with a TNC immediately—than wait for conventional paratransit service the next day. If such more convenient service were available, then registrants might take more trips. While the MTA could take steps to mitigate this concern, such as limiting the subsidy and requiring registrants to pay the metered fare above the AAR amount, such limitations would not comply with ADA standards on fares. As a result, the MTA would be required to continue offering conventional paratransit service.62 Even if such a program induced demand, each trip replaced would save enough on average to supply 2.1 additional trips, meaning paratransit trips of this type would need to increase 25 percent to increase total costs; paratransit trips of this type would need to increase up to 118 percent if implemented as a carpool option.63 Such a level of induced demand is unlikely. Moreover, if paired with a proportionate increase in service and customer satisfaction, some share of induced demand may be acceptable.
Drivers may see a paratransit trip as less appealing and either openly or covertly avoid such a trip in favor or a more attractive fare. A paratransit trip may require more time and effort on behalf of the driver, and unlike DSCs or vehicles associated with BCS, they are not assigned. A stick and carrot approach may be necessary to steer drivers toward accepting paratransit trips. Protections must be in place to ensure taxicab, street-hail liveries, TNCs, and other for-hire vehicles do not avoid paratransit service for such a program to be effective; however, incentives such as higher fares or bonus payments may be more effective in ensuring drivers provide satisfactory paratransit service. The use of ratings for such TNC applications like Uber and Lyft could be one way to ensure registrants are able to commend or condemn a driver appropriately. The MTA and TLC should collaborate to help increase the wheelchair-accessible fleet and ensure all drivers are receiving the proper training.
Increasing the use of non-carrier modes with these methods will require solving technical problems as well. Payment of providers will require a separate system from the current model, one that can verify a customer’s eligibility and deliver payments to drivers. Leveraging benefits from TNC-provided trips may require smartphone access and ability to use the associated application. However, paratransit dispatchers may be able to tap directly into these networks to schedule and coordinate trips on a registrant’s behalf.
New Organizational Model
The MTA’s core competency is moving large numbers of people through the region using its major transportation assets, namely the bus, subway, and commuter rail systems. Though ADA compels the agency to provide paratransit service, such operations lie outside the agency’s greatest strengths. In response, the MTA has contracted with private firms to provide most paratransit functions while it performs only administrative functions. This design has the benefit of fostering competition among contracted carriers and coordinating the reservation and dispatch functions under a single command center contract. Using a private firm to manage call center operations at the command center also allows for smoother adjustments to staffing levels and introduction of new technologies. However, contracting these functions separately divides responsibility for performance among several firms and places a heavy burden of coordination on the MTA.
Other paratransit system designs may provide additional benefits. A full-service brokerage model allows transit agencies to set policy and oversee the broker’s contract while leaving all other administrative functions—including procurement, contract management and monitoring, recordkeeping, and customer service—to a single contracted entity. Good brokers can foster competition and redirect trips to better performers. Additionally private brokers put distance between a transit agency and the entities they contract with to provide paratransit services. This separation can allow a broker to bargain more effectively than a public authority. Private brokers also have the advantage of greater flexibility when procuring services, particularly contracted carriers.64
In 2014 AAR spent 19 percent of total paratransit expenses on general administration costs, slightly less than the median for other large systems.65 However, AAR’s $13.22 spent in general administration expenses per trip ranked 9th most expensive of 29 other large systems, 59 percent higher than the median.66 A move to a full-service brokerage might reduce these costs. The Santa Clara Valley Transportation Authority (VTA) manages its paratransit in this manner. When VTA adopted this approach in 2012 they were able to lower operating costs by 13 percent. This system design allowed OUTREACH, VTA’s broker, more flexibility to implement strategies to improve routing and scheduling, use more non-dedicated service providers, and centralize vehicle maintenance. Under this system design, VTA spends 7 percent of all paratransit expenses on administration, the lowest share of all systems studied.67
Another paratransit provider that uses this model is Access Transportation Systems, Inc. (ATS), a full-service brokerage coordinating service for the Port Authority of Allegheny County Transit (PAT) in Pittsburgh.68 Paratransit costs are based on a per trip fare structure that takes into account the type of vehicle and service provided. Like the MTA, ATS reimburses providers based on vehicle-revenue hours; however, ATS requires contractors meet agreed upon productivity goals based on the mix of trips assigned. Contractors exceeding its productivity goal may gain additional trips while contractors failing to meet their productivity goal may see trips shifted to other contractors. By working with ATS, PAT has kept its general administration expenses as a share of total expenses equal to 8 percent, or $1.82 per trip. Moreover, ATS has recorded one of the highest productivities in the United States, completing 2.27 trips per hour in 2014, 184 percent of AAR’s productivity.
The success of this organizational model in other transit agencies is worth studying. While lowering general administration expenses per trip to less than $2 is ambitious, lowering the share of total expenses dedicated to general administration to the same level as these other systems could save between $25 million and $30 million.69
Better Managing Demand
Since 2002 the number of paratransit trips has grown at an average annual rate of 8.4 percent, nearly five times that of subway ridership (1.7 percent) and 12 times that of commuter rail ridership (0.7 percent).70 Thus far much of the MTA’s paratransit savings have been accomplished by slowing this trip growth; however, more could be done to reduce trips. Two approaches are to facilitate and encourage shifting rides to the accessible fixed-route services and to raise fares to cover more of the cost of the most discretionary uses of paratransit.
Encourage Use of the Fixed-Route System
Options for shifting appropriate rides to the fixed-route system are an improved Zero-Fare MetroCard program and increased use of feeder services. The MTA in 2011 began a Zero-Fare MetroCard program, allowing some AAR registrants to travel the fixed-route system for free in lieu of a more expensive AAR trip. The program has suffered from weak internal controls to limit use of the cards by ineligible individuals and has faced difficulties in marketing the cards to registrants most able to use the fixed-route system.71
Based on experience in other cities, improving the Zero-Fare MetroCard program may be made more effective by targeting it to new AAR applicants and accompanying it with an increase in the paratransit fare. (For more on fare increases, see section below.) In Washington D.C. Metro Access began allowing paratransit customers to ride buses and subways for free while raising paratransit fares, in some cases doubling them. From 2010 to 2013 paratransit trips declined 14 percent, and the agency estimated free use of the fixed-route system alone saved the agency up to $25 million annually.72 Other transit agencies have implemented similar fare incentives and achieved significant savings. Programs for paratransit customers in Boston and Utah demonstrated estimated savings of 9 percent and 7 percent, respectively.73
Introduction of the Zero-Fare MetroCard in New York was not accompanied by proper controls to deter improper use of the program. According to a report from the MTA’s Inspector General in 2014, the transit agency did not have procedures in place to detect fraud.74 Since that time the MTA has stopped sending MetroCards to all paratransit registrants, instead offering them only to those customers who request one. Moreover, in its July 2016 financial plan the agency proposed turning the Zero-Fare program into a reduced fare program. This shift has a high possibility of being counterproductive. If less than 3 percent of the rides currently taken using Zero-Fare MetroCards convert to paratransit rides, then any net benefits are eliminated.
The MTA will continue to review the program to determine its impact and improve fraud detection.75 Even if the MTA increased trips diverted to a modest 2.5 percent of the 6.4 million total AAR trips in 2015 to the fixed-route system, the MTA could have saved $11 million. If 5 percent of all trips had been diverted to the fixed-route system, the annual savings could surpass $22 million.76
Another way to encourage use of the fixed-route system is to offer feeder service more often. According to FTA regulations, feeder service may be offered so long as the trip is deemed accessible and comparable to a trip taken by a conventional user of the fixed-route system. However, in 2015 fewer than 44,000 trip requests were met with an offer of feeder service, merely 0.6 percent of total requests. Of this group, AAR customers declined 34,014 offers of feeder service resulting in the reduction of a paratransit trip, while the remaining 9,668 accepted trips generated 33 percent fewer vehicle service hours than a similar door-to-door paratransit trip.77
Currently the MTA provides feeder service only to bus stops, not subway stations, and only for outgoing, not return, trips. The restriction on subway stops, despite 100 stations being made accessible, is because the escalators and elevators are not deemed sufficiently reliable and because FTA guidelines require transit agencies assure sidewalk infrastructure issues or other obstacles do not make a customer’s pathway unnavigable. The restriction on feeder service for return trips is because these trips are often subject to unpredictable or changing schedules, and offering feeder service pickups may result in long wait times for customers at the end of their fixed-route journey.
Promoting greater use of feeder service by the MTA would require more collaboration with the City to remove navigational hazards between common fixed-route stops to widen the pool of potential trips. For example, street improvements to bus stops could elevate sidewalks to cut down on the time needed to load and unload wheelchairs, allowing buses to reduce dwell time while accommodating the mobility impaired. To permit feeder service on return trips, the MTA is working on options for users to provide coordinates and times while on board a bus. The MTA should accelerate this work and further improve its scheduling software to incorporate more feeder service in an efficient manner. If the share of trip requests met with an offer of feeder service increased from the current 0.6 percent to 2.5 percent, $8.6 million would be saved in fewer trips and service hours. If feeder service responses were increased to 5 percent, then the savings would be $20 million.78
Higher Fares
The ADA stipulates paratransit fare may not exceed twice the single-ride fare of a similar trip. Since 1993 the MTA has set the AAR fare at the same level as the transit base fare.79
Efforts to double the AAR fare as part of the 2009 MTA budget failed; however, as AAR costs continue to grow, the agency should revisit the policy.80 Such a change may be politically unpopular and would require the cooperation of other stakeholders. Yet without efforts to reduce demand, growing use of paratransit vehicles for discretionary trips will escalate costs and put pressure on the quality of service for more essential trips. Fare elasticities for paratransit service have been measured between -0.13 and -0.41, meaning that doubling fares could result in ridership declines between 13 percent and 41 percent.81 The fiscal benefits from a fare increase are primarily the reduced variable cost for the trips eliminated, but also include the net gain in fare revenue from the loss of revenue at the current price for eliminated trips and the added revenue at the higher price for the remaining trips. Based on 2015 data, a doubling of fares would generate net fiscal benefits of between $71 million and $184 million annually. A more modest fare increase from $2.75 to $3.50 or $4.00—paratransit fares in Washington, D.C. and Philadelphia, respectively—would net between $20 million and $86 million annually.82
Changing the Revenue Mix
As previously described, the current revenue mix supporting AAR is 4 percent from fares, 14 percent from the dedicated portion of the Urban Tax, 27 percent from a subsidy from City of New York general fund revenues, and 55 percent from an internal MTA cross-subsidy drawing on fares paid by regular subway and bus riders. A better mix would be one in which the internal cross-subsidy was lower and other sources were higher.
The most effective strategy for lowering the cross-subsidy is lowering total costs. This is the case because the cross-subsidy covers a deficit left after the other source are tapped; the other revenue would change little or not at all even if expenses were lower. Thus the options identified above to lower expenses are also key strategies for lowering the internal cross-subsidy.
Fares are unlikely to become a substantially increased source of revenue. Even under the politically unlikely scenario discussed above of doubling the current fare, $181 million of the total $184 million in fiscal benefits comes from lower cost from eliminated rides while about $3 million comes from the net gain in fare revenue. Under that scenario the increase in fare revenue as a share of expenses is a modest 3.9 percent to 7.5 percent. However the MTA may be completing trips that another source can fund—payments from the joint federal-state Medicaid financing medical care for low income residents.
Medicaid Payments
Under federal law States must ensure Medicaid patients receive necessary transportation to and from medical providers, including trips related to medical appointments. The benefit applies not only to emergency transportation by ambulances, but to non-emergency medical transportation (NEMT) trips as well. These trips may be completed using ambulettes (including wheelchair-accessible vans), taxis or liveries, and mass transit.83 Although AAR registrants are not required to state the nature of their trip to the MTA when securing a reservation, it is likely that a share of current trips qualifies as NEMT and may be eligible for Medicaid payments. But the MTA has no way of knowing when this is the case or of documenting and billing for the service.
The MTA has attempted to establish that a share of its paratransit trips ought to be considered NEMT; however, Medicaid authorizes transports using the least costly, most medically appropriate mode of transport. It has indicated it would reimburse the MTA only the fare paid by AAR registrants. The difference between the AAR fare and Medicaid reimbursement for ambulettes, taxis, and liveries is significant, and could defray some of the cost of paratransit service for eligible trips.
For example, in New York City, depending upon the level of care, Medicaid pays for eligible trips between $25 and $33.84 Assuming the same share of AAR registrants is enrolled in Medicaid as the rest of the City adult population, approximately 52,250, or 36 percent, of AAR customers are Medicaid eligible.85 If 1 in 20 trips by these Medicaid eligible customers are NEMTs, the MTA could generate an additional $3 million annually in Medicaid payments. If 1 in 5 of these trips is eligible for Medicaid reimbursement, the MTA could generate an additional $10 million to $14 million annually.
Reforming federal and state policies to allow NEMT reimbursement for relevant paratransit trips may be a welcome change for other paratransit providers in New York State as well, including those in the MTA service region. According to federally reported data, ADA paratransit trips provided by New York transit agencies other than the MTA surpassed 5.7 million in 2014, costing more than $276 million.
Redesigning Access-a-Ride's Future
Under current policies AAR’s problems will get worse. The program will become increasingly expensive as the volume of trips grows and the cost per trip increases. The fiscal burden on general taxpayers and on subway and bus riders who pay regular fares will also get worse. The MTA’s leaders should purse new policy directions to create a better future for AAR.

Table 7 compares the MTA’s latest projections for AAR with an alternative scenario that incorporates changes based on the policy options identified in this report. A combination of available options could be implemented to achieve the goals of containing the growth in number of trips, lowering the cost per trip, and reducing the role of the internal cross-subsidy in financing AAR. Instead of the projected annual growth in trips of 6.5 percent, the goal should be to keep trip volume flat at the 2015 level. Instead of allowing the cost per trip to rise to $77, the goal should be to lower it 16 percent to about $65. If these targets are achieved, the necessary City tax subsidy would decline $76 million, or 42 percent, and the cross-subsidy from transit would decline $160 million, or from about 16 cents to 9 cents per MetroCard swipe.
The options identified in this report can lead to these fiscal benefits while also improving the quality of service available to AAR registrants who can makegreater use of alternative vehicles that better meet their needs and pick them up more promptly. All of AAR’s stakeholders— registrants, MTA and City officials, and ordinary straphangers should support the types of changes needed to realize a better future for this important service.
Download Report
Access-A-Ride: Ways to Do the Right Thing More EfficientlyFootnotes
- Permanent Citizens Advisory Committee to the MTA, Welcome Aboard, accessibility at the MTA (October 2008), pp. 1-8, www.pcac.org/wp-content/uploads/2014/09/Welcome-Aboard-Accessibility-at-the-MTA.pdf.
- Metropolitan Transportation Authority, Capital Plan 2015-2019, Renew, Enhance, Expand (April 20, 2016), p. 56, http://web.mta.info/capital/pdf/MTA_15-19_Capital_Plan_Board_WEB_Approved_v2.pdf.
- Sources and methods used to calculate these figures are described in later text and tables.
- State of New York, Joint Senate Bill 10133 and Assembly Bill 11981 (June 28, 1984).
- Service began in January 1990 in the Bronx, Brooklyn, Manhattan, and Queens and in July 1990 on Staten Island. See: City of New York, Executive Budget, Fiscal Year 1992, Message of the Mayor (May 10, 1991), p. 189.
- 49 CFR Sec. 37-123(e); and General Accountability Office, Americans With Disabilities Act: Challenges Faced by Transit Agencies in Complying With the Act’s Requirements, RCED-94-58 (March 1994), p. 1, www.gao.gov/products/RCED-94-58.
- Additionally, personal care attendants may not be charged a fare.
- General Accountability Office, ADA Paratransit Services: Demand Has Increased, but Little is Known about Compliance, GAO-13-17 (November 2012), Table 1: ADA Minimum Paratransit Service Requirements for Comparability to Fixed-Route Service, p. 5, www.gao.gov/products/GAO-13-17.
- The MTA does not include the subway system in scheduling consideration at this time because many stations are inaccessible and matching trip origins and destinations to accessible stations is problematic. A paratransit fare may be charged, but customers may not be charged for transfer to the fixed-route. See: 49 CFR Sec. 37-129, Appendix D to Part 37-Construction and Interpretation of Provisions of 49 CFR.
- U.S. Department of Transportation, Federal Transit Administration, “Origin-to-Destination Service” (accessed July 29, 2016), www.transit.dot.gov/regulations-and-guidance/civil-rights-ada/origin-destination-service.
- Three categories of eligibility are (1) those that cannot independently board, ride, or exit a bus or train accessible to persons in wheelchairs, (2) disabled persons who can use accessible fixed-route vehicles who wish to travel a route that does not have these vehicles, and (3) persons with specific impairment-related conditions preventing travel to or from fixed-route boarding locations. Agencies may also require applicants to self-certify, provide professional verification of need via documentation, or both. See: General Accountability Office, ADA Paratransit Services: Demand Has Increased, but Little is Known about Compliance, GAO-13-17 (November 2012), Table 2: Types of ADA Paratransit Eligibility Determination Processes Used by Transit Agencies, p. 6, www.gao.gov/products/GAO-13-17.
- City of New York, Mayor’s Management Report (annual editions 1990 to 1993), Department of Transportation, Missions and Indicators, and Executive Budget, Supporting Schedules (annual editions 1990 to 1993).
- Paratransit Agreement Between City of New York and the Metropolitan Transportation Authority (May 28, 1993), pp. 1-2.
- Metropolitan Transportation Authority, Paratransit Division, email to Citizens Budget Commission staff (May 23, 2016).
- Leye Jeannette Chrzanowski, “DOT Guidance Clarifies Paratransit Regulations,” The Disability News Service, Inc. (March 3, 2000; accessed April 5, 2016), www.uic.edu/orgs/ada-greatlakes/adanews/003dotguidance.htm.
- Metropolitan Transportation Authority, Paratransit Division, email to Citizens Budget Commission staff (June 21, 2016).
- The lack of data regarding the number of non-dedicated service carrier trips completed from 2002 to 2007 make determining actual productivity difficult. Productivity is presumed to be lower in all years owing to the completion of some ADA trips by non-DSC providers. See: Metropolitan Transportation Authority, Paratransit Division, email to Citizens Budget Commission staff (May 23, 2016).
- New York City Independent Budget Office, Using Taxi Vouchers to Lower the Cost of Paratransit Service (June 2007), pp. 6-8, www.ibo.nyc.ny.us/iboreports/WebTaxiVouchersJune07.pdf.
- Metropolitan Transportation Authority, 2008 Final Proposed Budget, November Financial Plan 2008-2011 (November 2007), p. 70, http://web.mta.info/mta/budget/.
- Metropolitan Transportation Authority, 2009 Adopted Budget, February Financial Plan 2009-2012 (February 2009) and MTA New York City Transit/Staten Island Railway Additional Actions for Budget Balance-Proposed Savings, p. 293, http://web.mta.info/mta/budget/.
- Metropolitan Transportation Authority, 2010 Final Proposed Budget, November Financial Plan 2010-2013 (November 2009), Volume II, p. 113, http://web.mta.info/mta/budget/.
- Metropolitan Transportation Authority, Final Proposed Budget, November Financial Plan (annual editions 2009 and 2010) and MTA New York City Transit, Budget Reduction Program Summary, p. 472, http://web.mta.info/mta/budget/.
- Metropolitan Transportation Authority, Paratransit Division, email to Citizens Budget Commission staff (May 23, 2016); and Office of the New York State Comptroller, Metropolitan Transportation Authority: An Overview of the Paratransit Program, Report No. 1-2015 (April 2014), pp. 1-2, www.osc.state.ny.us/osdc/rpt1-2015.pdf.
- The MTA introduced a feeder service pilot program in 2007; however, the agency halted expansion as the call center found it easier to schedule individuals for full door-to-door service. See: U.S. Department of Transportation, Federal Transit Administration, National Transit Database (updated January 2015), www.ntdprogram.gov/ntdprogram/data.htm; and Metropolitan Transportation Authority, 2010 Adopted Budget, February Financial Plan 2010-2013 (February 2010), http://web.mta.info/mta/budget/.
- Savings calculated using average vehicle service hour cost of $30. See: City of New York, Office of the Comptroller, Audit Report of the Metropolitan Transportation Authority’s Oversight of the Access-A-Ride Program, FK15-098A (May 2016), http://comptroller.nyc.gov/reports/audit/?r=05-17-16_FK15-098A.
- Metropolitan Transportation Authority, Paratransit Division, email to Citizens Budget Commission staff (May 23, 2016).
- Average cost per trip of $57.53 used to determine savings from foregone trips, equal to average per trip payment to contracted carriers in 2015. See: Metropolitan Transportation Authority, Paratransit Division, email to Citizens Budget Commission staff (June 7, 2016).
- Metropolitan Transportation Authority, Paratransit Division, email to Citizens Budget Commission staff (July 26, 2016).
- Zero-Fare MetroCards allow AAR users to swipe into a subway station or onto a bus multiple times in order to allow personal care attendants or guests to ride with them.
- Metropolitan Transportation Authority, Committee on Finance, Staff Summary – Paratransit Cost Savings Initiative (June 2012), p. 1, http://web.mta.info/mta/news/books/docs/staffsummary_finance_1206.pdf.
- Metropolitan Transportation Authority, 2017 Preliminary Budget, July Financial Plan 2017-2020 (July 2016), V-254, http://web.mta.info/mta/budget/.
- These categories include Stairs Restricted, Extreme Cold/Heat, Other Weather, Unfamiliar Places, and Excessive Distance.
- Metropolitan Transportation Authority, New York City Transit, “Access-A-Ride Service Application” (2015), http://web.mta.info/nyct/paratran/access_application.pdf.
- The MTA retains the right to review appeals of eligibility determinations, as well as the hardware and software systems responsible for aggregating reservations and dispatching drivers and vehicles.
- Metropolitan Transportation Authority, Paratransit Division, email to Citizens Budget Commission staff (June 23, 2016) and presentation to Citizens Budget Commission staff (April 25, 2015); and New York City Independent Budget Office, Access-A-Ride: With More Riders, Costs Are Rising Sharply (October 2006), p. 4, www.ibo.nyc.ny.us/iboreports/FBparatransit10306.pdf.
- City of New York, Office of the Comptroller, Audit Report of the Metropolitan Transportation Authority’s Oversight of the Access-A-Ride Program, FK15-098A (May 2016), http://comptroller.nyc.gov/reports/audit/?r=05-17-16_FK15-098A.
- Metropolitan Transportation Authority, 2017 Preliminary Budget, July Financial Plan 2017-2020 (July 2016), p. V-263, http://web.mta.info/mta/budget/.
- Calculations use 2015 total for transit cross-subsidy for AAR and transit ridership. See: Metropolitan Transportation Authority, 2017 Preliminary Budget, July Financial Plan 2017-2020 (July 2016), MTA New York City Transit Ridership Traffic Volume (Utilization), p. V-242, http://web.mta.info/mta/budget/, and Paratransit Division, email to Citizens Budget Commission staff (May 23, 2016).
- Metropolitan Transportation Authority, 2017 Preliminary Budget, July Financial Plan 2017-2020 (July 2016) and MTA New York City Transit Paratransit Operations, p. II-69, http://web.mta.info/mta/budget/.
- Though the MTA typically increases the base fare during a fare increase, it is not required.
- Per transit trip equivalent calculated using New York City subway and bus projected ridership. See: Metropolitan Transportation Authority, 2017 Preliminary Budget, July Financial Plan (July 2016), Volume II, MTA New York City Transit Paratransit Operations, p. II-69, and MTA New York City Transit Ridership/Traffic Volume (Utilization) p. V-242, http://web.mta.info/mta/budget/.
- Metropolitan Transportation Authority, 2017 Preliminary Budget, July Financial Plan (July 2016), Volume II, p. V-240, http://web.mta.info/mta/budget/.
- Directional route miles of local bus and select bus service reported in the 2014 National Transit Database. Distance to and from Atlanta calculated using driving directions in Google Maps.
- U.S. Census Bureau, American Community Survey (2014), S0801 Community Characteristics, http://factfinder.census.gov/faces/nav/jsf/pages/index.xhtml.
- Selected systems include all paratransit providers reporting 500,000 ADA trips or more and reporting ADA-related expenses in 2014—the latest year for which data are available. This list includes: Alameda-Contra Costa Transit District (Oakland), Access Services (Los Angeles), Bi-State Development Agency of the Missouri-Illinois Metropolitan District (St. Louis), PalmTran (Palm Beach County, Florida), Broward County Transit Division (Fort Lauderdale), Capital Metropolitan Transportation Authority (Austin, Texas), City and County of Honolulu Department of Transportation Services, Dallas Area Rapid Transit, Delaware Transit Corporation, Denver Regional Transportation District, King County Metro Transit (Seattle), Maryland Transit Administration, Massachusetts Bay Transportation Authority (Boston), Metro Mobility (Minneapolis), Metropolitan Atlanta Rapid Transit Authority (California), Metropolitan Transit Authority of Harris County, Texas (Houston), Miami-Dade Transit, New Jersey Transit, Orange County Transportation Authority, Pace-Suburban Bus Division (Chicago), Regional Transportation Commission of Southern Nevada (Las Vegas), San Francisco Municipal Railway, Santa Clara Valley Transportation Authority (San Jose), Southeastern Pennsylvania Transportation Authority (Philadelphia), Suffolk County Department of Public Works (Long Island, New York), Tri-County Metropolitan Transportation District of Oregon (Portland), VIA Metropolitan Transit (San Antonio), and Washington Metropolitan Area Transit Authority. See: U.S. Department of Transportation, Federal Transit Administration, National Transit Database (updated January 2015), and Table 19: Transit Operating Statistics: Service Supplied and Consumed, www.transit.dot.gov/ntd.
- Service area population is reported by transit agencies to the National Transit Database. Shares of service area population older than 64 years of age and disabled are calculated using the American Community Survey. When a precise service area is not known, American Community Survey geographies are approximated. See: U.S. Department of Transportation, Federal Transit Administration, National Transit Database (updated January 2015), www.transit.dot.gov/ntd; and U.S. Census Bureau, American Community Survey (2014), S0801 Community Characteristics, http://factfinder.census.gov/faces/nav/jsf/pages/index.xhtml.
- According to Census estimates, only 45 percent of households in New York City have access to a vehicle. That same figure is 91 percent nationally, 90 percent in Los Angeles County, 88 percent in the Chicago Metropolitan Area, and 86 percent in the Boston Metropolitan Area. See: U.S. Census Bureau, American Community Survey (2014), B08201, Household Size by Vehicle Available, https://factfinder.census.gov.
- U.S. Department of Transportation, Federal Transit Administration, National Transit Database (updated January 2015), and Table 19: Transit Operating Statistics: Service Supplied and Consumed, www.transit.dot.gov/ntd.
- U.S. Department of Transportation, Federal Transit Administration, National Transit Database (updated January 2015), and Table 19: Transit Operating Statistics: Service Supplied and Consumed, www.transit.dot.gov/ntd.
- The Travel Time Index compares peak period travel time to free-flow travel time. The Travel Time Index is an estimate of the conditions faced by urban travelers and can be used to compare different urban areas. The correlation coefficient for Travel Time Index to Trips Completed per Vehicle Hour for the 29 peer systems studied is 0.05. See: Texas A&M Transportation Institute, 2015 Urban Mobility Scorecard (August 2015), http://mobility.tamu.edu/ums/.
- Metropolitan Transportation Authority, Paratransit Division, email to Citizens Budget Commission staff (July 26, 2016).
- Some trips may be purchased with a pre-approved voucher. Additionally trips to AAR assessment centers to establish or renew eligibility and trips to Veterans Affairs Hospitals may be completed using taxicab vouchers. See: City of New York, Independent Budget Office, Taxi Vouchers for Paratransit (2007), pp. 2-3, www.ibo.nyc.ny.us/iboreports/WebTaxiVouchersJune07.pdf.
- This decline is largely owing to a retrenchment in use of taxicabs for ADA paratransit trips owing to concerns with fraud and abuse. See: Metropolitan Transportation Authority, Office of the Inspector General, Fraud Controls in the Paratransit Taxi Reimbursement Program, Report No. 2014-22 (January 2015), www.mtaig.state.ny.us/assets/pdf/14-22.pdf.
- Trip totals for individual DSCs come from City Comptroller’s report. Remaining taxicab trips and expense totals for each type of trip are calculated using data provided by the MTA. See: City of New York, Office of the Comptroller, Audit Report of the Metropolitan Transportation Authority’s Oversight of the Access-A-Ride Program, FK15-098A (May 2016), http://comptroller.nyc.gov/reports/audit/?r=05-17-16_FK15-098A; and Metropolitan Transportation Authority, Paratransit Division, email to Citizens Budget Commission staff (June 21, 2016).
- Metropolitan Transportation Authority, presentation to Citizens Budget Commission staff (April 25, 2015), and Paratransit Division, email to Citizens Budget Commission staff (July 26, 2016).
- Calculations assume the MTA incurs $3.08 in fuel costs per DSC trip.
- These new banking regulations required a bank to issue a prepaid card directly to a customer, and not through the MTA. Owing to privacy laws, once this relationship was established, the MTA could not view individual users’ transactions. This opacity would keep the MTA from certifying users were paying for the nature of trip the transit agency was authorizing. See: Dan Timmeny, New York City Taxi and Limousine Commission, phone interview with Citizens Budget Commission staff; and Metropolitan Transportation Authority, “A New Option for Access-A-Ride Customer” (press release, December 15, 2010), www.mta.info/news/2010/12/15/new-option-access-ride-customers.
- Luz Lazo, “Uber flirts with transit agencies across the U.S. for a share of paratransit services,” Washington Post (March 5, 2016), www.washingtonpost.com/local/trafficandcommuting/uber-flirts-with-transit-agencies-across-the-us-for-a-share-of-paratransit-services/2016/03/05/5eb8b118-d751-11e5-9823-02b905009f99_story.html.
- Joseph Kane, Adie Tomer, and Robert Puentes, Metropolitan Policy Program at Brookings, “How Lyft and Uber can improve transit agency budgets” (March 8, 2016), www.brookings.edu/research/papers/2016/03/08-lyft-uber-transit-agency-budgets-kane-tomer-puentes.
- The calculation estimates trips per cab per hour using the median number of taxicab trips per hour divided by active taxicabs. To estimate average fare, average gross taxicab driver revenue per hour is divided by estimated trips per hour. This figure is reduced by 15 percent to adjust for estimated tips received to arrive at an average fare. Approximately 11 percent of all AAR trips originated in the taxicab “hail zone” in 2015. Estimated savings calculated using per trip reimbursement rates for all AAR trips less voucher trips, which is equal to $55.45. Adjustment is made for customers paying the $2.75 paratransit fare. Calculation includes fuel savings as previously calculated. See: New York City, Taxi and Limousine Commission, 2016 TLC Factbook (2016), accompanying data, Tables 3 and 7, www.nyc.gov/html/tlc/downloads/excel/2016_tlc_factbook.xlsx.
- These services generally allow TNC drivers to pick up multiple customers with multiple drop-off locations. Customers in these cases pay a flat fare typically starting at $5.
- U.S. Department of Transportation, Federal Transit Administration, Transit Cooperative Research Program, Use of Taxis in Public Transportation for People with Disabilities and Older Adults, Synthesis 119 (March 2016), www.tcrponline.org/PDFDocuments/tcrp_syn_119.pdf.
- Calculation assumes full savings from all trips originating in Manhattan hail zone is offset by induced demand of the same type of trips.
- U.S. Department of Transportation, Federal Transit Administration, Accessible Transit Services for All, FTA No. 0081 (prepared by Disability Rights Education and Defense Fund and Marilyn Golden, December 2014), pp. 28-31, 43-44, 49-50, 56-57.
- In 2014 AAR spent 18.7 percent of total expenses on general administration. The median figure for abovementioned peer systems was 19.0 percent. See: U.S. Department of Transportation, Federal Transit Administration, National Transit Database (updated January 2015), Table 13: Transit Operating Expenses by Mode, Type of Service and Object Class, www.transit.dot.gov/ntd.
- U.S. Department of Transportation, Federal Transit Administration, National Transit Database (updated January 2015), Table 13: Transit Operating Expenses by Mode, Type of Service and Object Class and Table 19: Transit Operating Statistics: Service Supplied and Consumed, www.transit.dot.gov/ntd.
- U.S. Department of Transportation, Federal Transit Administration, Accessible Transit Services for All, FTA No. 0081 (prepared by Disability Rights Education and Defense Fund and Marilyn Golden, December 2014), Appendix D: Case Studies, pp. D-4- D-36.
- ATS and Pittsburgh’s transit agency, PAT, are not included in our list of peers because this paratransit service completed 485,703 ADA trips in 2014; however, when all non-ADA paratransit trips are included, ATS completed nearly 1.6 million trips in 2014, more than New Jersey Transit.
- Calculations used 2015 totals: $462 million in total expenses and $61 million administrative expenses, or 13 percent of the total. Range of savings assumes total expenses and administrative expenses both reduced in commensurate amounts so that administrative expenses are equal to 7.2 percent and 8 percent of total expenses. See: U.S. Department of Transportation, Federal Transit Administration, National Transit Database (updated January 2015), Table 13: Transit Operating Expenses by Mode, Type of Service and Object Class, www.transit.dot.gov/ntd.
- Metropolitan Transportation Authority, Paratransit Division, email to Citizens Budget Commission staff (May 23, 2016).
- Metropolitan Transportation Authority, Office of the Inspector General, Improving Safety Controls in the MTA NYC Transit Paratransit Broker Car Service Program, OIG Report No. 2013-18 (April 2014), p. 3,
- Daniel C. Vock, “Disabled in DC: Coping With Increasing Costs and Demand for Paratransit,” Governing (August 31, 2015), www.governing.com/topics/transportation-infrastructure/gov-washington-paratransit-series-one.html.
- Transportation Research Board, Transit Cooperative Research Program, Strategy Guide to Enable and Promote the Use of Fixed-Route Transit by People with Disabilities, Report 163 (2013), pp. 89-90 and Table 7-11 Sample cost savings for three levels of trip diversion, p. 101, http://onlinepubs.trb.org/onlinepubs/tcrp/tcrp_rpt_163.pdf.
- Metropolitan Transportation Authority, Office of the Inspector General, Fraud Controls in the Paratransit Zero-Fare MetroCard Program, OIG Report No. 2014-10 (August 2014), www.mtaig.state.ny.us/assets/pdf/14-10.pdf.
- Metropolitan Transportation Authority, Paratransit Division, email to Citizens Budget Commission staff (July 26, 2016).
- Savings calculated using average cost per trip of $66.40 and average fuel cost of $3.08 per trip. See: Metropolitan Transportation Authority, 2016 Adopted Budget, February Financial Plan 2016-2019 (February 2016), Paratransit Operations, p. III-18, http://web.mta.info/mta/budget/.
- Metropolitan Transportation Authority, Paratransit Division, email to Citizens Budget Commission staff (June 21, 2016).
- Savings estimates uses 2015 total trip requests and assumes paratransit users will reject the same share of feeder trip responses as in 2015. In this case, the average cost per trip is $69.48, the average per trip reimbursement for DSCs and average fuel cost per trip in 2015. Calculations for savings from reduced vehicle hours assumes each vehicle service hour costs $30.
- Under the paratransit agreement between the City and the MTA, restructuring the fare requires both written agreement from the City and approval by the FTA. Any effort to bypass this rule may be stopped by a claimant—that is, a paratransit registrant—by seeking an injunction. See: Paratransit Agreement Between City of New York and the Metropolitan Transportation Authority (May 28, 1993), pp. 13 and 21.
- As an attempt to minimize the paratransit costs, the MTA’s law department reviewed the agreement with the City to determine if the transit agency could single-handedly increase the fare. The agency later determined this was not possible. See: Metropolitan Transportation Authority, Paratransit Division, email to Citizens Budget Commission staff (June 28, 2016).
- Paul Metaxatos and Lise Dirks, “Cost Estimation of Fare-Free ADA Complementary Paratransit Service in Illinois,” Journal of Public Transportation (2012), Volume 15, No. 4, pp. 70-71; and Federal Transit Administration, Transit Cooperative Research Program, Improving ADA Paratransit Demand Estimation: Regional Modeling, TCRP Report 158 (prepared by Mark Bradley Research and Consulting and Nelson\Nygard Consulting Associates, 2012), p. 5, http://onlinepubs.trb.org/onlinepubs/tcrp/tcrp_rpt_158.pdf.
- Range of net benefits calculated using elasticities of -0.13 and -0.41, 2015 completed trips, and average cost per trip of $57.53, the average contract reimbursement per trip to contracted carriers in 2015. Net benefits include changes in fare revenue and operating expense. See: Washington Metropolitan Area Transit Authority, “MetroAccess Customer Guide” (accessed June 15, 2016), www.wmata.com/accessibility/metroaccess_service/customer_guide.cfm#fares; Southeastern Pennsylvania Transportation Authority, CCT Connect Senior Shared-Ride Program (2015), p. 2, www.septa.org/service/cct/pdf/SRP-Brochure-rev-113015.pdf; and Metropolitan Transportation Authority, 2016 Adopted Budget, February Financial Plan 2016-2019 (February 2016), Paratransit Operations, p. III-18, http://web.mta.info/mta/budget/.
- New York State, Department of Health, New York State Medicaid Program, Transportation Manual Policy Guidelines (April 2016), www.emedny.org/ProviderManuals/transportation/PDFS/Transportation_Manual_Policy_Section.pdf.
- This includes ambulettes as well as taxis, liveries, and vans for adult transportation, transportation to mental health programs, and medically necessary transport. Other reimbursement schedules exist for mileage-based reimbursements but are not considered in this calculation. See: eMedNY, “Transportation Manual” (accessed May 11, 2016), NYS Medicaid Transportation Fee Schedule, 4/1/2016, www.emedny.org/ProviderManuals/Transportation/index.aspx.
- Calculation assumes average beneficiaries for New York City less Temporary Assistance for Needy Families children, safety net children, and for Medicaid and Medicaid and Subsistence. See: New York State, Department of Health, “Medicaid Quarterly Reports of Beneficiaries and Expenditures by Category of Eligibility and Social Service District” (accessed May 16, 2016), 2014 Calendar Year, www.health.ny.gov/statistics/health_care/medicaid/quarterly/ssd/2014/cy/beneficiaries.htm.