BIDs - Organization, Oversight, and Transparency
There are currently 74 Business Improvement Districts (BIDs) in New York City serving 85,000 businesses in more than 42,000 properties. BIDs derive the bulk of their funding from a special assessment fee levied on property owners, and collectively BID assessment revenues totaled more than $100 million in fiscal year 2016. This report examines the process for setting assessment fees, their uses, and the city’s oversight of BIDs. It shows that assessment fees in smaller BIDs are slightly higher relative to property value than those of larger BIDs, and that they spend a greater share of their funds on personnel and administrative costs due to their limited size and budget. Because the assessment fee is essentially a tax on properties in the districts, the City should ensure that there is a public, transparent review and performance evaluation for each BID as a part of the contract renewal process.
Overview
Small Business Services (SBS), the agency charged with the development and oversight of BIDs, defines one as “a geographical area where local stakeholders oversee and fund the maintenance, improvement, and promotion of their commercial district.”1 BIDs were created as a response to the economic stress of many central cities during the second half of the 20th century. With governments facing declining tax bases, limited public resources, and depressed urban cores, business owners came up with a solution: self-taxation and self-governance.
In New York City the first BID (Fulton Mall in Brooklyn) was formed in 1976.2 At least one new BID has formed in most years since then, and as of August 2017, there are 74 BIDs throughout the five boroughs.

The establishment of a BID in New York City follows a lengthy process that involves both public outreach and legislative approvals. It begins with local community stakeholders working with SBS to prepare a statement of need, form a steering committee, draft a vision statement, identify boundaries, and determine resource needs and funding sources. The development of a District Plan includes conducting a needs assessment survey as well as determining services to be provided and a budget. Outreach is needed to gain support from business owners and respond to community input.3 The District Plan is first reviewed by the City Planning Commission. To formally establish a BID, legislation must be approved by the New York City Council and the Mayor. As is the case with other not-for-profit entities established by local law, once formed a BID can exist in perpetuity. If a BID wants to amend its District Plan, expand its boundaries, or increase its special assessment, however, it must go back to the City Council. The City Council also has the authority to dissolve a BID, at the request of the BID itself or by petition of the owners of 51 percent of the assessed value or 51 percent of the owners in the district.4
A BID is operated by a nonprofit district management association that is overseen by a Board of Directors and SBS. Boards provide oversight of operations and financial activities, hire an executive director to run day-to-day operations of the district, and are responsible for ensuring that BIDs adhere to all legally required reporting mandates.5 By law boards include each BID’s local Council Member, the City Comptroller, the respective Borough President, and the Mayor. The board must also include commercial property owners, commercial tenants, and residents elected by the members of the district.
SBS provides technical assistance and is tasked with making sure that BIDs fulfill the goals outlined in their District Plans. Public scrutiny is further enhanced by the submission of audited financial statements to the City Comptroller and contracts to the City’s Law Department. As nonprofits, BIDs are also subject to oversight by the State Attorney General.
The City’s 74 BIDs vary in geographic size, annual budget, and scope of services provided. SBS classifies BIDs according to their annual expenditures.6 (See Figures 2a and 2b.)
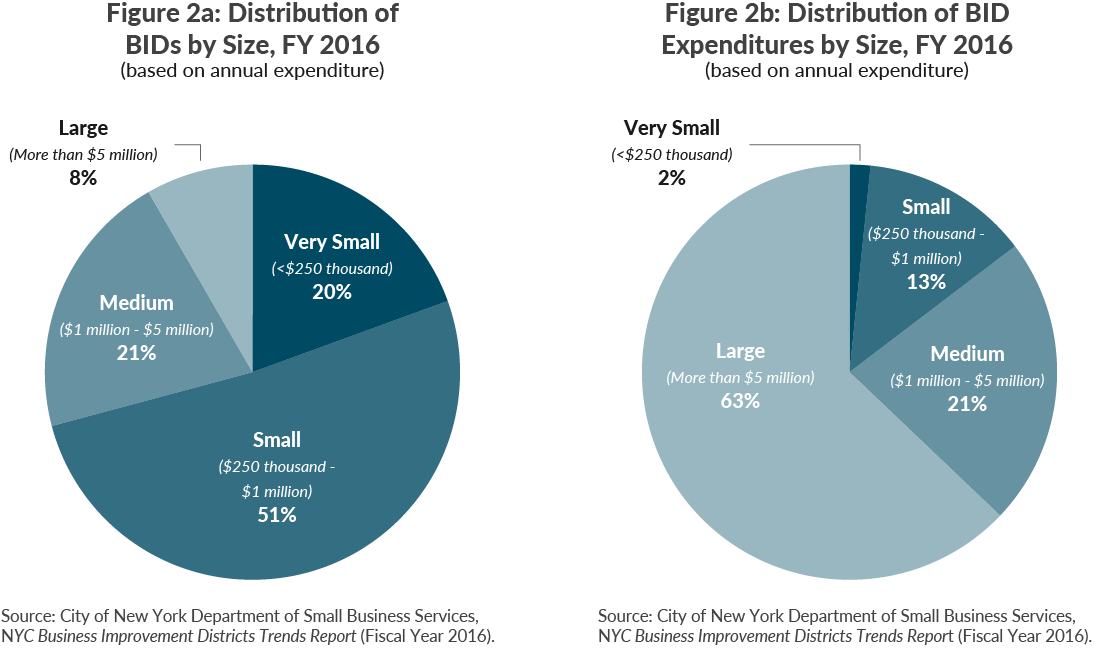
- Very Small BIDs: There are 14 BIDs with annual expenditures under $250,000. On average these BIDs contain 700,000 square feet of property with 133 storefront businesses. They are predominately retail corridors, with retail and mixed use comprising 45 percent of the square footage; another 20 percent is industrial and loft space.7 Very small BIDs account for 2 percent of expenditures.
- Small BIDs: There are 37 BIDs with between $250,000 and $1 million in expenditures. These BIDs average 2.0 million square feet of property with 276 storefront businesses. These BIDs have a significant retail presence, at 38 percent. Small BIDs account for 13 percent of expenditures.
- Medium BIDs: Another 15 BIDs have expenditures between $1 million and $5 million, containing 9.8 million square feet of property, on average, and 467 storefront businesses. These BIDs are likely to be in central business districts and tourist areas, with 51 percent of the space classified as office buildings and 7 percent as hotels. Medium BIDs account for 21 percent of expenditures.
- Large BIDs: Six large BIDs have annual budgets in excess of $5 million, including the Downtown Alliance and Grand Central Partnership. These BIDs are substantially larger—they average 43.5 million square feet of property with nearly 700 storefront businesses. Large BIDs are dominated by office space, with more than 75 percent of the square footage classified as office buildings; hotels are 9 percent. Large BIDs account for the remaining 63 percent of expenditures.
Some BIDs manage public spaces, like parks or plazas, with large BIDs having more such spaces. The overwhelming majority of BIDs host between 10 and 20 annual events; large BIDs host an average of 107 events per year, except Bryant Park, which hosts about 2,700 events per year.
BID Special Assessment Formulas
In fiscal year 2016 BIDs collected $134 million in revenue from all sources. The predominant revenue source is the special assessment fee, which was $106 million, or 79 percent. Other revenues were from fundraising, contracts, grants, and program fees.
The special assessment fee is essentially a tax levied on properties in the district, which is paid regardless of whether a business or property owner supported the creation of the BID. The Department of Finance bills and collects the fee as part of the administration of the property tax; the funds are remitted to the BIDs in two installments each year.
The District Plan, approved during the BID’s authorization, defines the BID’s initial operating budget and the formula(s) that will be used to calculate each property owner’s special assessment. The formulas differ from BID to BID and can be straightforward or complex, using a property’s square footage, assessed value, and/or street frontage.8 BIDs may have different formulas based on property type. In general, residential, nonprofit, and government-owned properties are exempt or charged a token fee.
What Do BIDs Do?
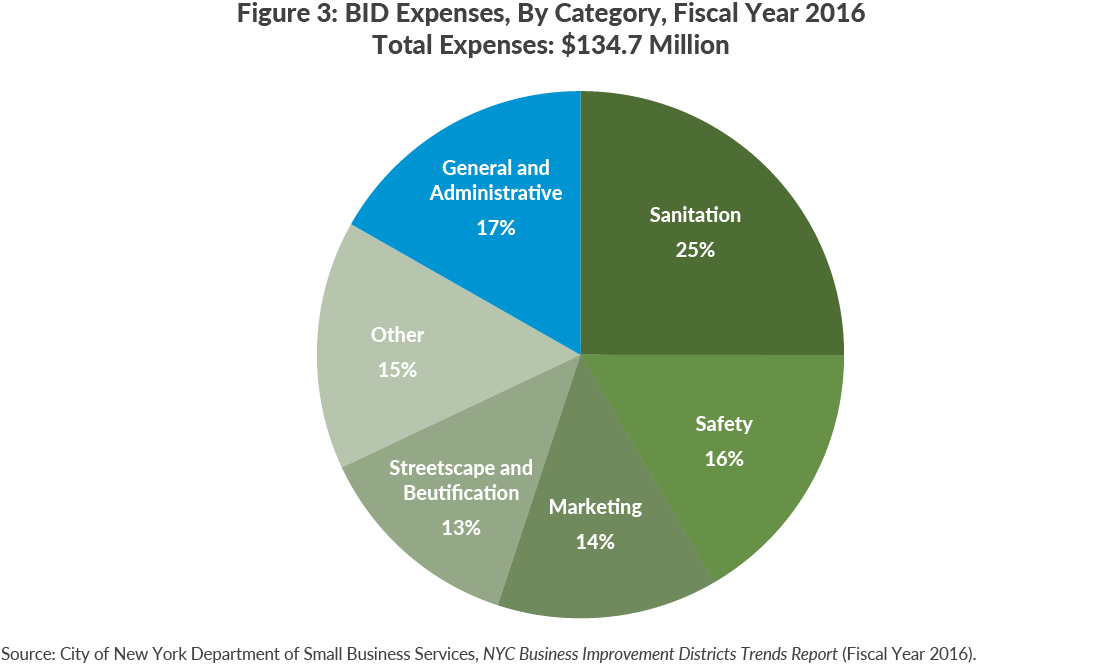
BIDs provide supplemental services to commercial districts that go beyond those delivered by the City of New York. While all BIDs fund similar services, there are differences in the relative shares allocated to specific functions. Figure 3 shows BID expenditures by category for fiscal year 2016. General and administrative expenses comprise 17 percent of BID expenditures; these expenditures include staff, rent, insurance, and supplies. The remaining spending is programmatic; the largest share is for sanitation services, which comprise one-quarter of all BID spending. Sanitation services—including street basket bagging, street sweeping, snow removal, and gum and graffiti removal—are generally contracted, though some BIDs hire employees directly. BIDs spend 16 percent of their expenditures on public safety, namely security personnel for street patrol and monitoring security cameras. Marketing and streetscape and beautification comprise 14 percent and 13 percent respectively, and the latter includes holiday lighting, plants, street furniture, and signage. Other programs make up the remaining 15 percent.
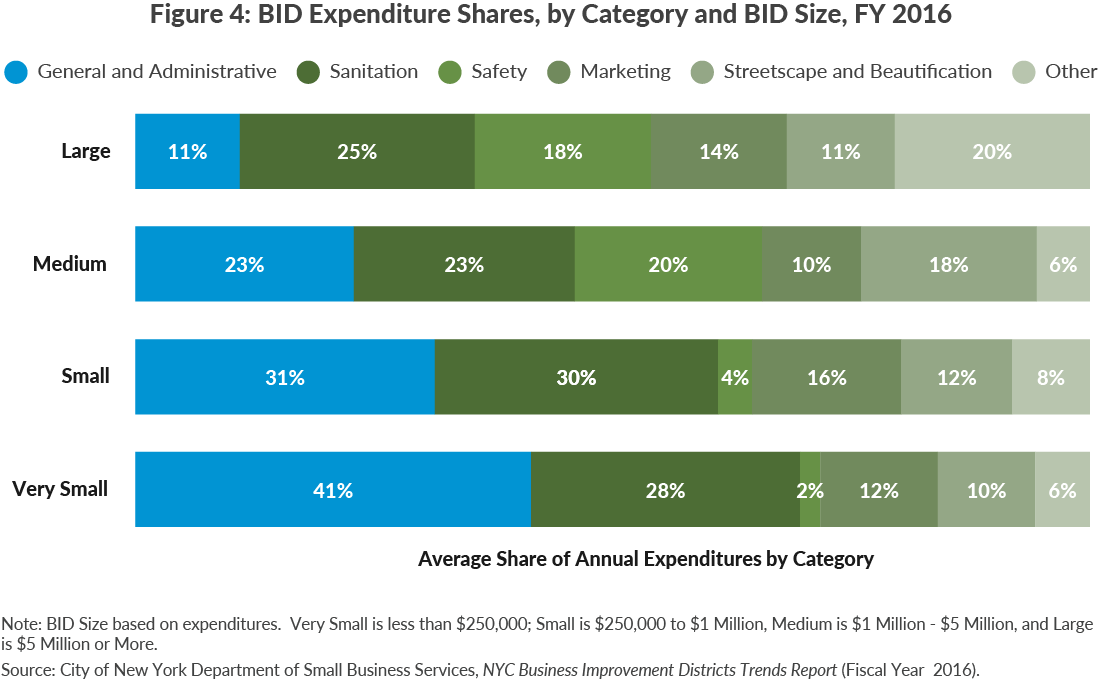
There are similarities and differences in spending by BIDs based on their size. (See Figure 4.) Smaller BIDs spend a greater share on general and administrative expenses, 41 percent, mainly for salaries, which includes payroll taxes and benefits, when offered. The share spent on administrative expenses decreases as BID size increases, with large BIDs spending just 11 percent. Very small and small BIDs generally have one or two full-time staff members, with some having only part-time or volunteer staff. Medium BIDs average eight full-time staff (ranging from 2 to 34), and the six large BIDs have an average of 99 employees, with four having more than 100 people on staff.9
The share spent on sanitation is fairly consistent, while the shares on marketing and streetscape and beautification vary within a narrow range. Spending on safety varies significantly; very small BIDs spend 2 percent on average, while small BIDs spend 4 percent, increasing to 20 percent for medium BIDs and 18 percent for large BIDs. The last category, other, is one-fifth of spending for large BIDs; this includes spending on business services, social services, visitor services, Wi-Fi, and debt service.10
How Costly are BID Assessment Fees to Property Owners?
With the median BID assessment fee under $1,000, many owners are assessed less than one-quarter of one percent of their properties’ market value. The data suggest the fee is somewhat higher relative to property value for properties located in BIDs with smaller operating budgets.
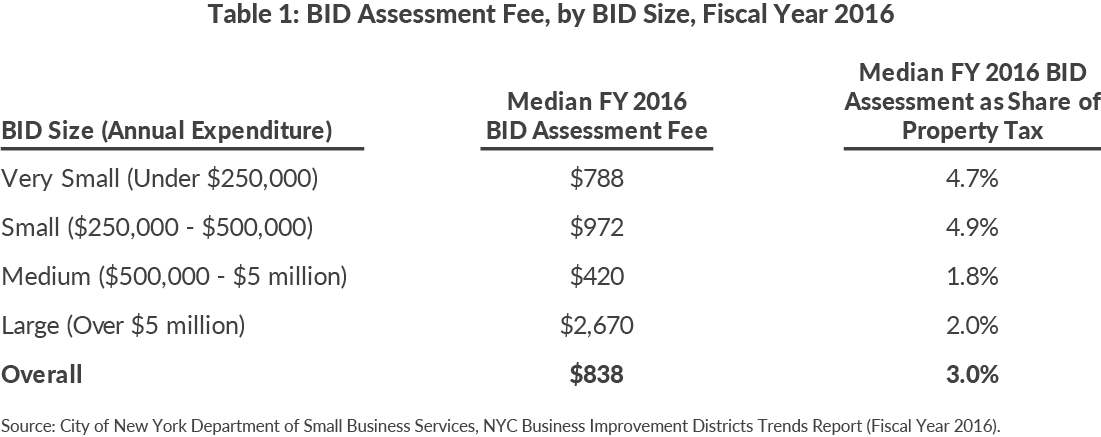
The average BID charge is nearly $6,000, but the median is much lower, at $838.11 Median charges, in dollar terms and as a share of the property tax, differ based on the size of the BID. As Table 1 shows, the median BID charge is less than $1,000 for properties in BIDs with less than $5 million in annual expenditures; however, the median is lowest for properties in BIDs between $1 million and $5 million. The six BIDs with expenses in excess of $5 million per year have a median BID charge of $2,670.12 The median property in very small and small BIDs have assessment fees that are 3.8 percent and 5.6 percent of the annual property tax, respectively. For the median property in a large or medium BID, the share is 2 percent.
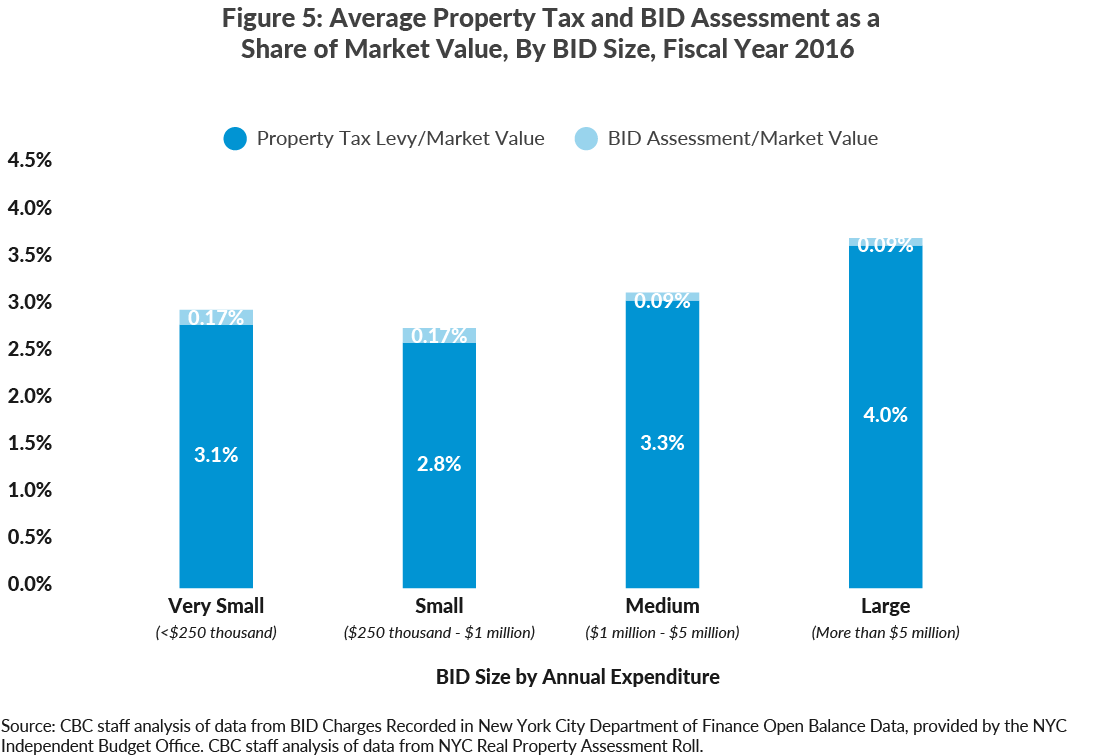
The preferred measure, when comparing property tax burdens, is an effective tax rate, which compares property tax liability to market value.13 Applying this method to BIDs, Figure 5 shows the average liability (both the property tax and the BID special assessment) as a percent of market value. When considered against market value, BID charges represent a very small share: 0.13 percent of a building’s market value on average; the median ratio is 0.09 percent.14 The average ratio is slightly higher for properties in very small and small BIDs, 0.16 to 0.18 percent, compared to large and medium BIDs, 0.09 to 0.10 percent.
BID Oversight
SBS and the City’s Law Department recently standardized the five-year contracts between the City and BIDs. The standardized BID contract is intended to increase transparency in BID operations and ensure that all BIDs are subject to the same regulatory standards. It empowers SBS to oversee BID operations and finances and requires the annual submission of audited financial statements to the City Comptroller and performance data on revenues, expenses, and programs to SBS. SBS uses this data to prepare an annual BID Report and makes it publically available on its website. SBS also has the right to conduct performance evaluations, order BIDs to address any failures or violations, and require BIDs to survey members on performance satisfaction.
Conclusion
Because BIDs are granted the authority to essentially tax properties, it is important to ensure that they are operating appropriately, cost-effectively, and in the interest of the property owners in their districts. The five-year contract expiration and renewal point provides opportunity for a public review of performance measurement data collected by SBS.
The current contract should be revised to specify that BID contract renewal is conditioned upon a thorough performance review and analysis of progress in implementing the BID’s strategic plan and should include specific evaluation criteria and performance metrics to be utilized by SBS. The contract should also require BIDs to survey their members at least once every five years to determine satisfaction with the BID’s strategic plan and performance. Elected officials, property owners, and business owners should be given the opportunity to comment during this periodic review process.
The additional performance measurement data, combined with the data SBS already collects, should be included in the annual BID Report for every BID for which a contract is renewed in that year. SBS should also disclose any written notices of violations it has issued to BIDs, as well as the actions taken by BIDs to correct these concerns.
The City Council should hold oversight hearings at least once each year to review the SBS’s oversight of BIDs with contracts up for renewal. The hearing would review performance metrics, financial statements, and member satisfaction surveys as part of the BID’s contract renewal process. Finally, while very small and small BIDs can provide valuable services in their districts, care should be taken during the formation process that new ones will have sufficient size and resources to operate efficiently.
Appendix
Download the Report
BIDs – Organization, Oversight, and TransparencyFootnotes
- City of New York, Department of Small Business Services, NYC Business Improvement Districts Trend Report (Fiscal Year 2016), p. 4, www1.nyc.gov/assets/sbs/downloads/pdf/neighborhoods/fy16-bid-trends-report.pdf.
- In 1976 the state passed legislation authorizing Special Assessment Districts, which is the legislation under which Fulton Mall was established. In 1981-1982, the City and State passed legislation permitting BIDs. The first BID formed under that legislation was Union Square (1982). See: City of New York, Department of Small Business Services, 11 Step BID Formation Guide, p. 2, www.nyc.gov/html/sbs/downloads/pdf/neighborhood_development/business_improvement_districts/11_step_bid_formation_guide.pdf.
- There must be “widespread support among property owners and commercial tenants.” See: City of New York, Department of Small Business Services, 11 Step BID Formation Guide, www.nyc.gov/html/sbs/downloads/pdf/neighborhood_development/business_improvement_districts/11_step_bid_formation_guide.pdf.
- City of New York, Administrative Code, Section 25-415 Dissolution.
- The City of New York Administrative Code specifies that the majority of directors must be property owners and that four members shall be appointed by the Mayor, Comptroller, Borough President, and City Council Representative. An SBS employee sits on the Board as the Mayor’s representative. See: City of New York, Administrative Code, Section 25-414(b); and City of New York, Department of Small Business Services, 11 Step BID Formation Guide, p. 4, www.nyc.gov/html/sbs/downloads/pdf/neighborhood_development/business_improvement_districts/11_step_bid_formation_guide.pdf.
- There are 74 BIDs in the City currently, but data in this brief are limited to the 72 BIDs that were in existence in fiscal year 2016. The two new BIDs created during fiscal year 2017 are Greater JFK in Queens and New Dorp in Staten Island. For simplicity, CBC collapsed two size groups reported separately by SBS: $250,000 to $500,000 and $500,000 to $1 million.
- Square footage data is limited to properties assessed a BID special assessment fee of $100 or more. Data on BID characteristics come from three sources: City of New York, Department of Small Business Services, NYC Business Improvement Districts Trend Report (Fiscal Year 2016), www1.nyc.gov/assets/sbs/downloads/pdf/neighborhoods/fy16-bid-trends-report.pdf; CBC staff analysis of data from BID Charges Recorded in City of New York, Department of Finance Open Balance Data for Fiscal Years 2012 to 2016 (provided by New York City Independent Budget Office, November 2016); CBC staff analysis of data from City of New York, Department of Finance, NYC Real Property Assessment Roll (Fiscal Year 2016), www1.nyc.gov/assets/finance/downloads/tar/avroll_16.zip.
- Including assessed value in the formula means the annual assessment will change with changes in the value. Factors like square footage and frontage will keep the assessment level unless there is an alteration in the building.
- City of New York, Department of Small Business Services, NYC Business Improvement Districts Trend Report Data Flat File (Fiscal Year 2016), www1.nyc.gov/assets/sbs/downloads/excel/neighborhoods/fy16-bid-trends-report-data-flat-file.xlsx.
- While all BIDs are authorized to issue debt, few do and larger BIDs are more likely to use this authority. In fiscal year 2016, five BIDs reported debt service expenses: one small, one medium, and three large BIDs.
- The substantial difference between the average and the median is due to a small number of buildings with very high assessments that skew the average.
- The mean charges are higher due to a small number of properties with high BID assessments. For example, in large BIDs the mean BID charge is $20,940; this is not unexpected given that these BIDs include swaths of the City’s central business districts and encompass large, highly valuable office buildings.
- The BID assessment fee, as a percent of property tax, can be high because the BID assessment is high, or the property tax bill is low (for example, due to property tax abatements).
- The special assessment is generally less than one-quarter of one percent of the property’s market value. For the 80 percent of properties in the middle of the distribution (excluding the top and bottom 10 percent), the BID assessment is between 0.02 percent and 0.26 percent of market value.