The Cost of a Growing City Workforce
Ballooning Budgets and Long-term Liabilities
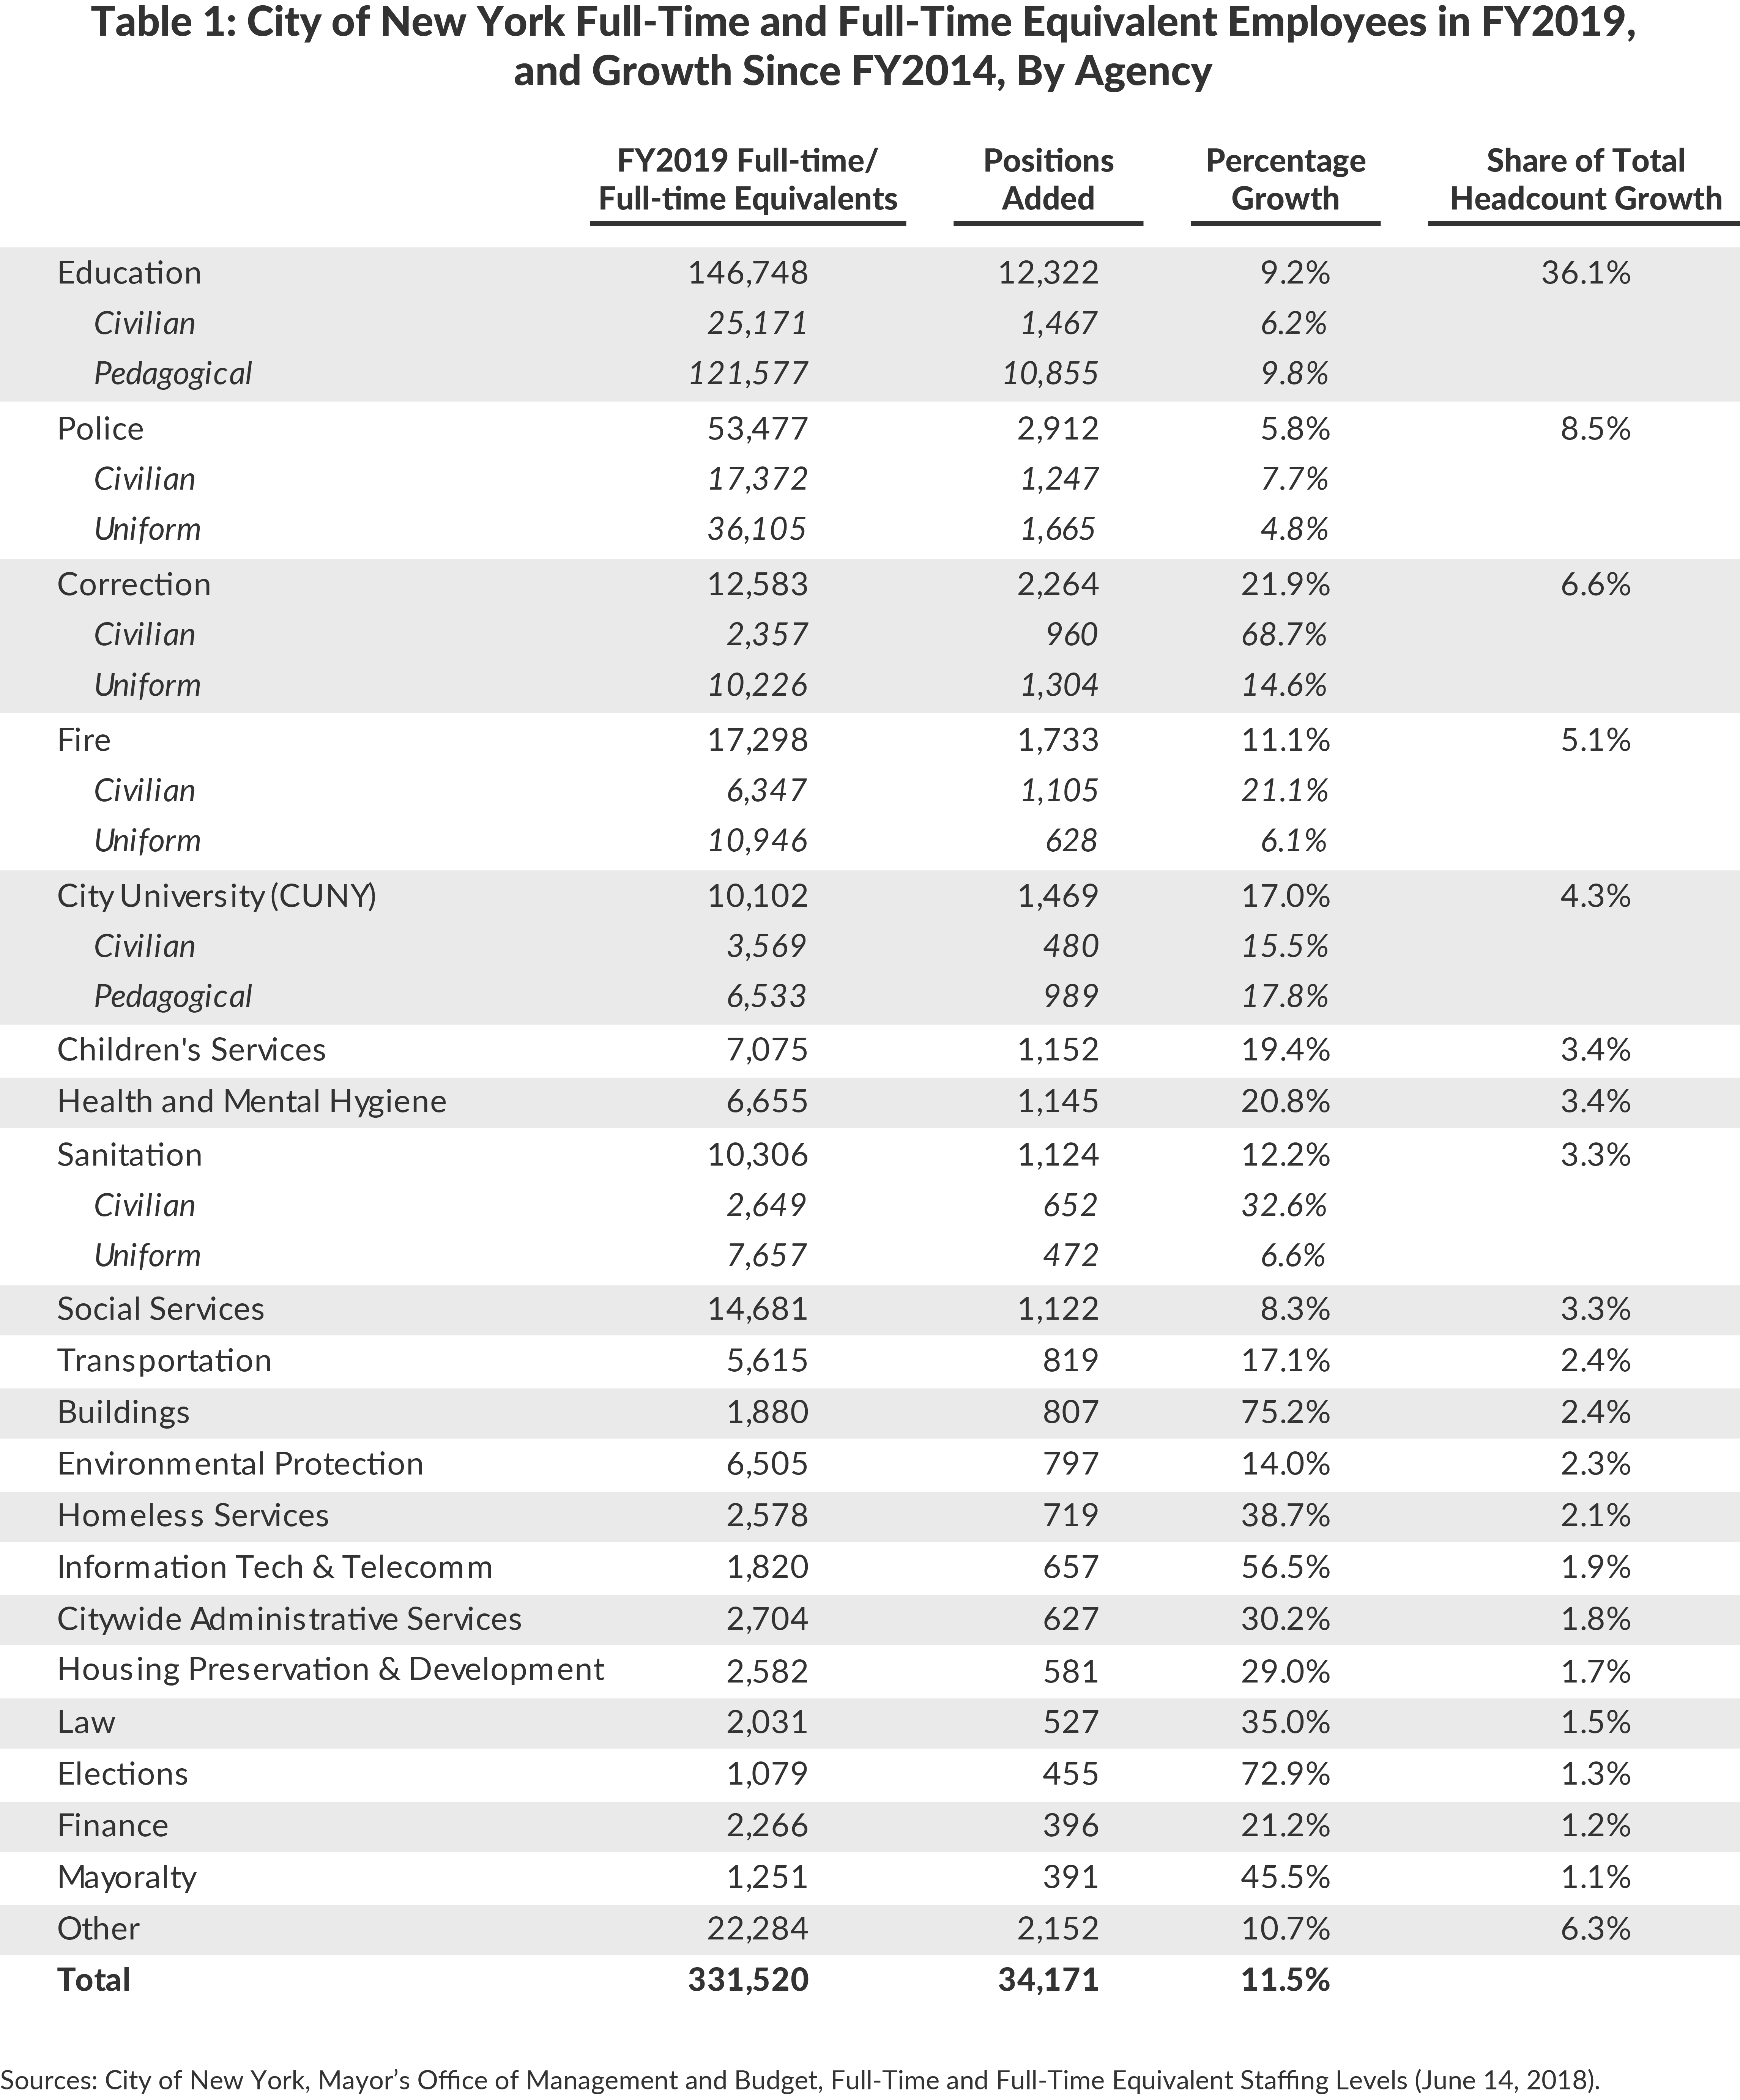
New York City’s municipal workforce is projected to reach a record 331,520 employees by the end of fiscal year 2019, an increase of 11.5 percent, or 34,171 positions, from the end of fiscal year 2014. Headcount expansion has a significant impact on the City’s budget and long-term financial position. CBC estimates full-time positions added to date account for $2.5 billion in personnel expenses in fiscal year 2019 and raise long-term liabilities by $521 million.
A strong local economy has enabled the City to pay for this expanded workforce; however, it will be hard-pressed to maintain this level of staffing when an economic downturn occurs. Moreover, the long-term liabilities associated with these employees will continue to grow in both good and bad economic times.
Citizens Budget Commission (CBC) has chronicled the growth of the municipal workforce under the de Blasio Administration in this online interactive feature.
Something for Everyone
New positions have been added primarily at the Department of Education (DOE) and the uniformed agencies. As shown in Table 1, headcount growth at DOE will account for 36.1 percent of the increase in budgeted headcount as new pedagogical positions have been created to implement the Universal Prekindergarten Program (UPK), as well as other educational initiatives. Uniformed agencies—the Police Department (NYPD), the Fire Department (FDNY), the Sanitation Department (DSNY), and the Department of Correction (DOC)—will account for 23.5 percent of the increase. Notable additions include expansion of the police force by 1,300 officers, increased hiring of traffic enforcement agents, increased firefighter hiring following a multiyear hiring freeze, and more correctional staffing in an effort to improve safety at New York City’s jails.
The growth has been universal across mayoral agencies and substantial in certain smaller agencies. Programmatic expansions and additional inspection personnel will increase the workforce at the Department of Buildings by more than 75 percent, from 1,073 positions in fiscal year 2014 to 1,880 in fiscal year 2019.1 Similarly, the workforce at the Department of Information Technology and Telecommunications (DoITT) will expand 57 percent, or 657 positions, by the end of fiscal year 2019 as certain contracts were insourced.2 Some priority service areas, particularly social services, have not seen a similar increase in headcount because of a reliance on contracted vendors to provide services.3
The Cost of a Growing City Workforce
The additional expenses associated with these new positions fall into two categories. The first category is current expenses such salaries and wages (including overtime and other pay), health insurance, and other fringe benefits such as payroll taxes and welfare fund contributions.4 The second category captures the long-term cost of providing retirement benefits, including defined benefit pensions and health insurance, for qualifying employees.
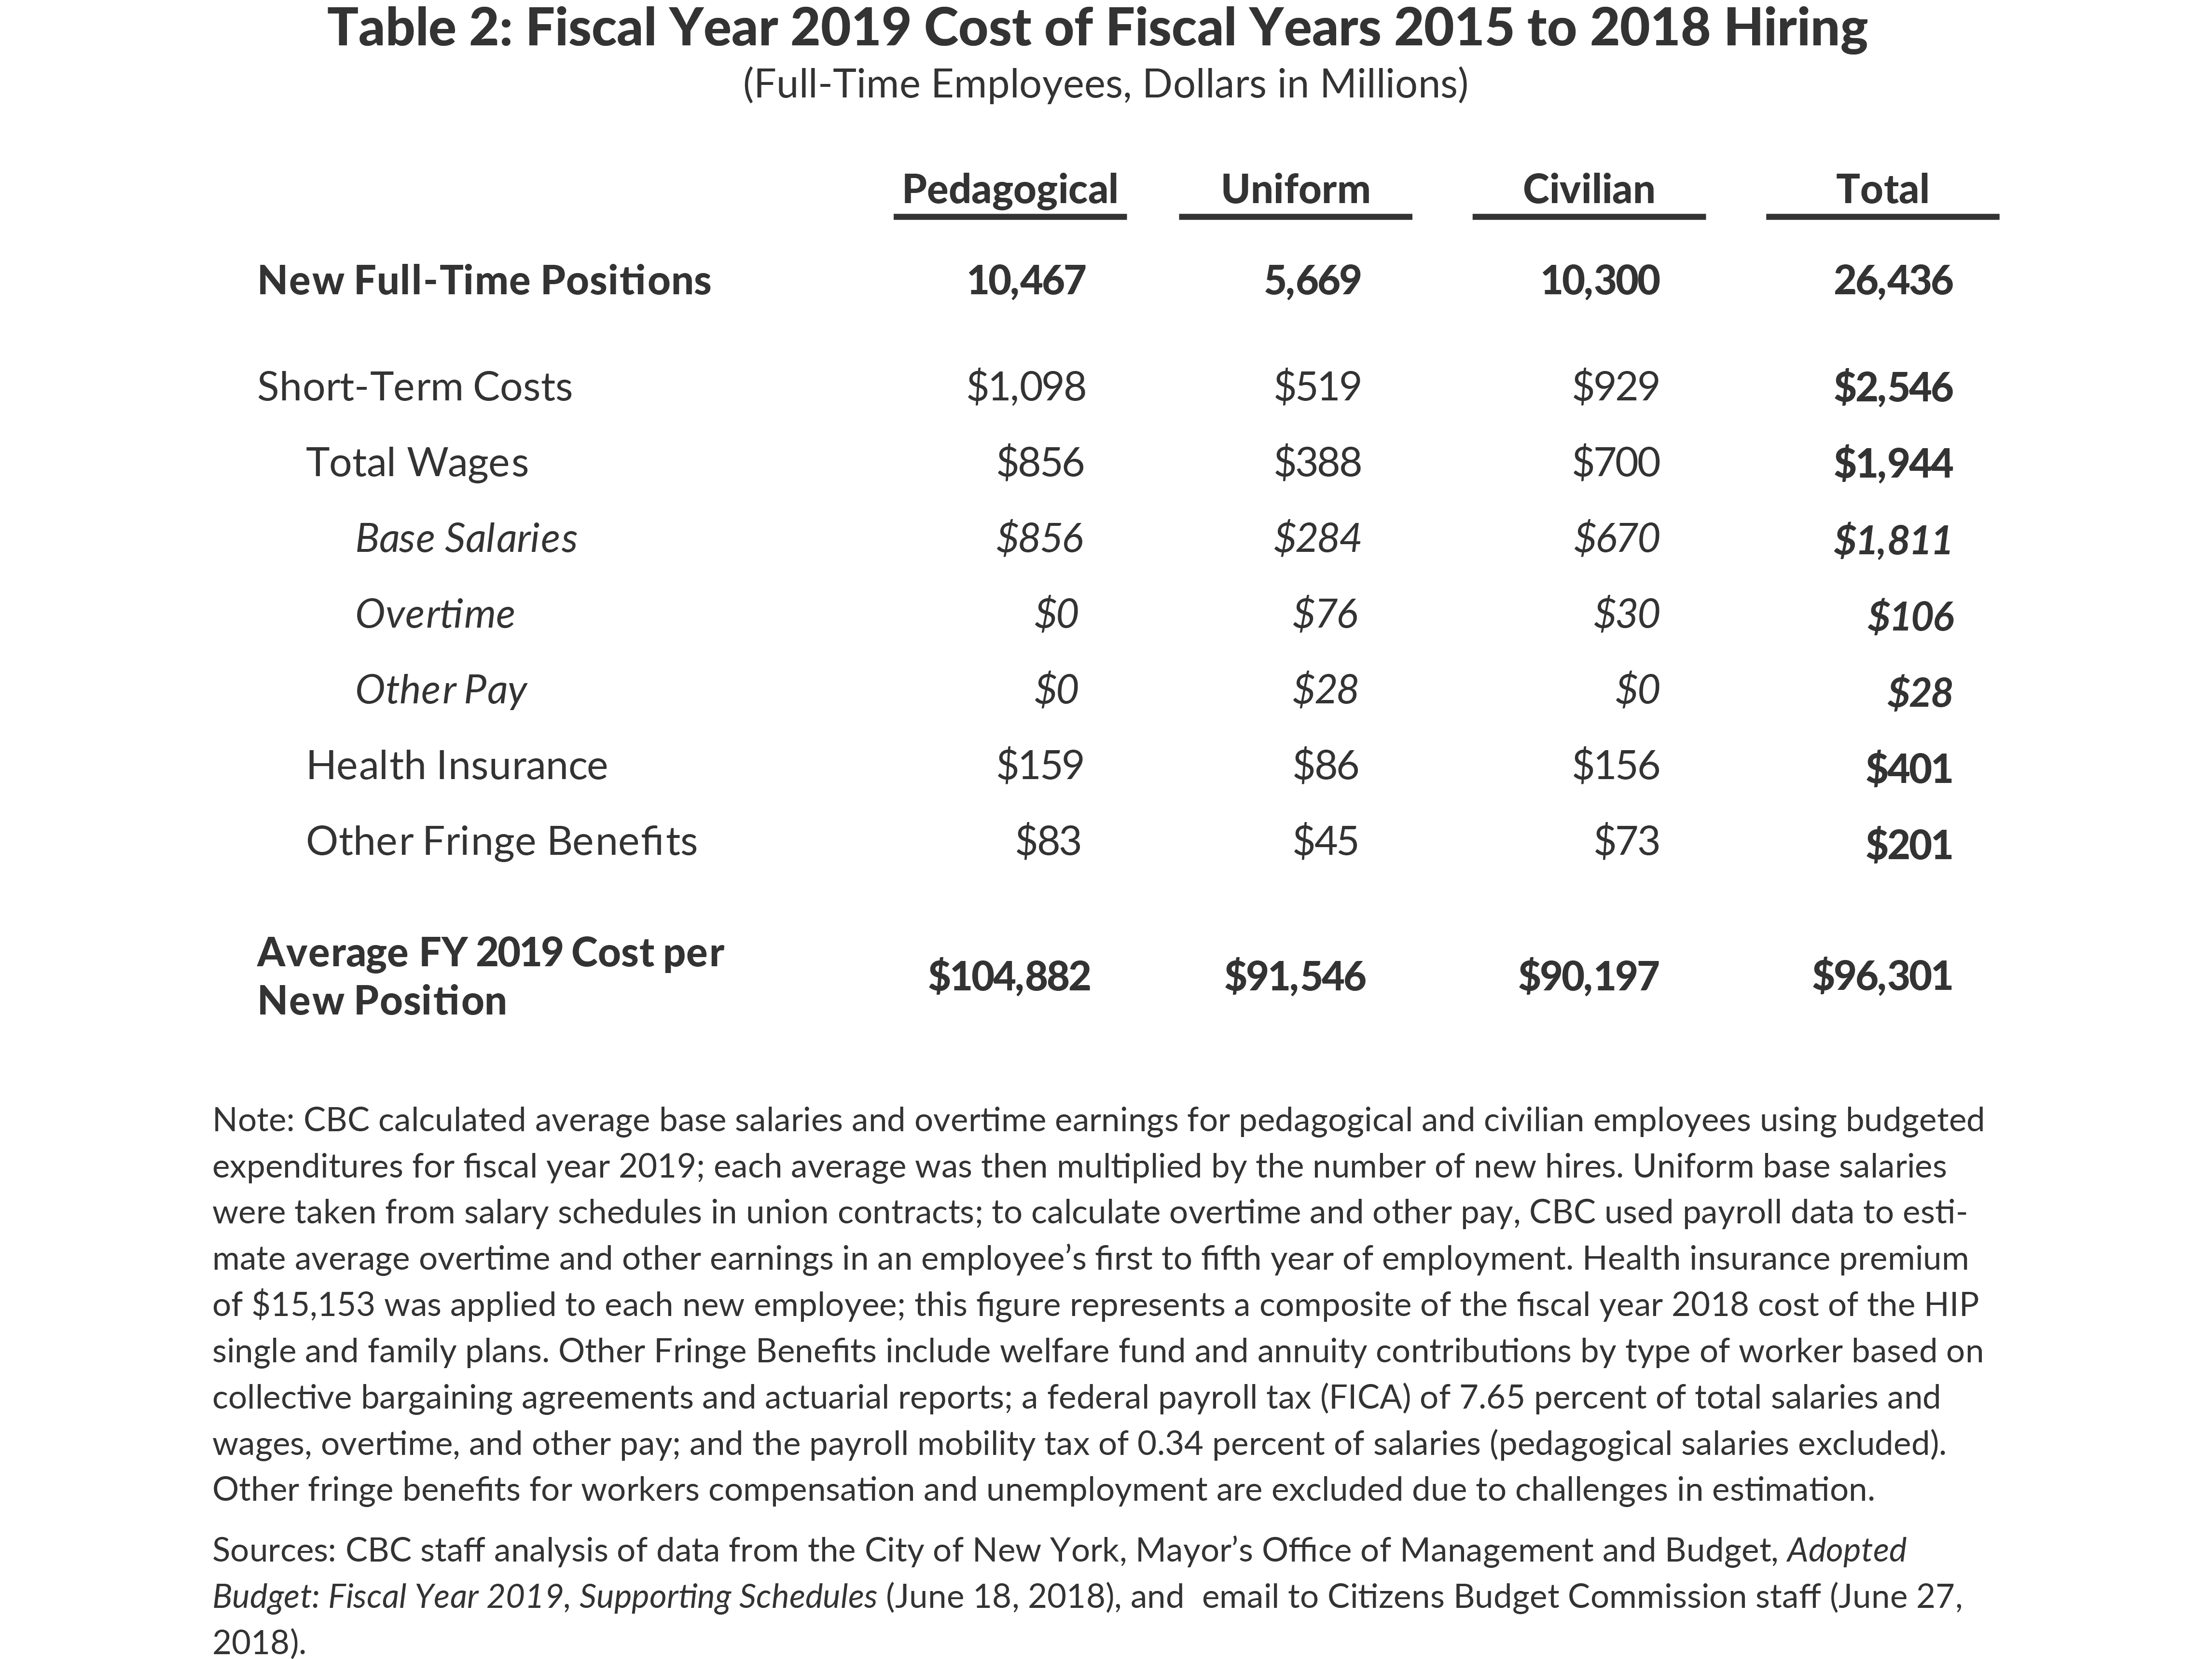
To simplify the analysis CBC focused on the budgetary impact in fiscal year 2019 of full-time hiring in fiscal year 2015 through March 2018, a total of 26,436 positions. Full-time equivalent employees working less than a full week’s work schedule are excluded.5 Salaries were estimated using per employee averages based on budgeted expenditures for pedagogical and civilian employees and from collective bargaining agreements and payroll data for uniformed employees.6 Health insurance costs are $15,153 per employee, calculated based on a blended rate of individual and family premiums based on employee take-up rates in fiscal year 2018.7 Other fringe benefits include payroll taxes of 7.65 percent of all earnings, the MTA mobility tax of 0.34 percent on salaries, and welfare and annuity fund contributions.8
CBC estimates these 26,436 new full-time employees add $2.5 billion in gross annual compensation costs in fiscal year 2019.9 Table 2 details the forms of compensation by category of employee. Of this $2.5 billion, $1.9 billion is for salaries and wages, with the almost half of that being pedagogical salaries–reflecting substantial hiring at DOE. Uniformed salaries are $388 million. Salaries for these positions start relatively low, but ramp up significantly after the first five years of employment.10 Salaries for civilians total $700 million, reflecting the additions of 10,300 positions across all agencies. Fiscal year 2019 compensation costs for the additional hires average $104,882 per pedagogical employee, $91,546 per uniformed employee, and $90,197 per civilian employee.
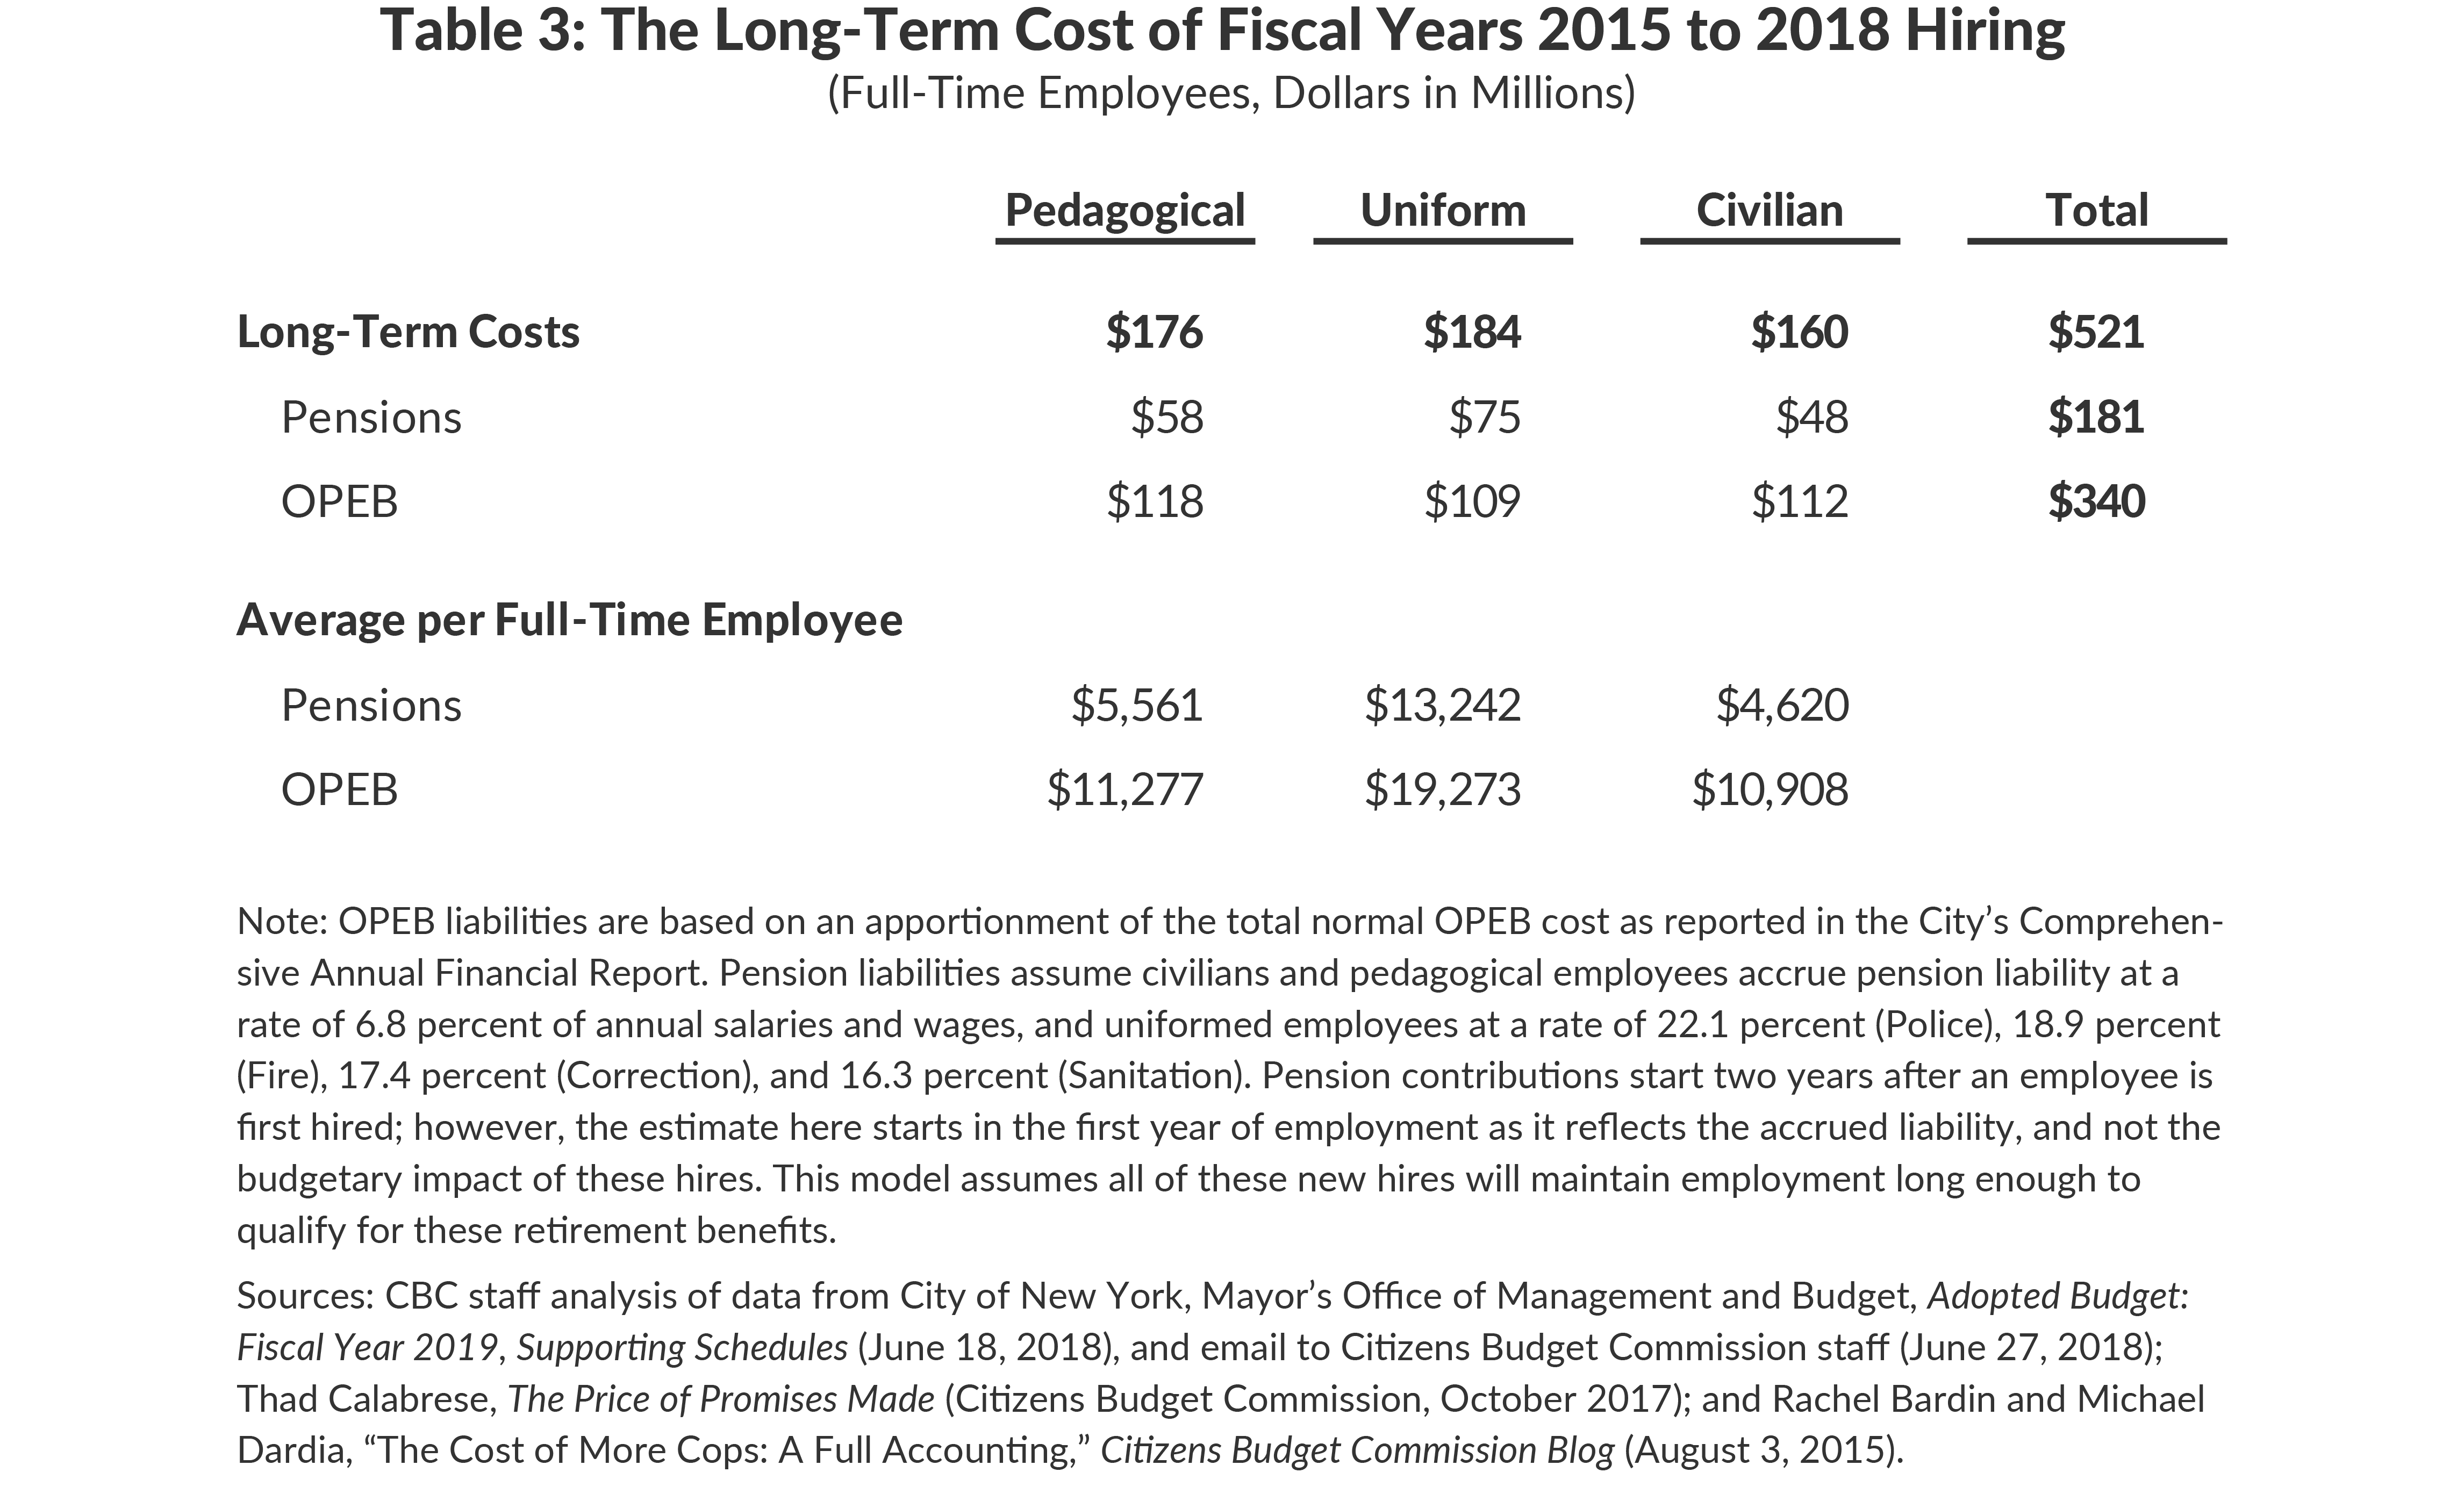
In addition to annual costs paid from the budget, hiring increases long-term liabilities associated with retirement benefits. The City offers defined benefit pension plans which guarantee employees an annual retirement benefit based on years of service, salary, and other factors; the liability for providing that benefit accrues each year. CBC estimates the new full-time hires add $180.9 million to fiscal year 2019 accrued pension liabilities.11
The City also offers retiree health benefits including health insurance without any premium contribution to those employed for 10 years and a per-retiree donation to welfare funds. The long-term liability for these health expenses is known as other postemployment benefits (OPEB). The value of these benefits is actuarially determined; the estimate below uses the present value of the benefit accrued for one year of service.12 It is important to note that the City prefunds pension benefits on an actuarial basis, but does not prefund OPEB benefits; instead, retiree health premiums and other benefits are made on a “pay as you go” basis. Together with pensions, the estimated long-term costs associated for the additional hires totals $520.5 million in fiscal year 2019.
Table 3 presents these costs by employee type. Because uniformed employees are eligible to retire at a younger age than civilian or pedagogical employees, they accrue relatively more in retiree liabilities each year.
Why Headcount Growth Is Problematic
Some new positions have been added to expand the scope of services the City provides, as in the implementation of UPK. But the rapid rate of growth across all agencies also raises concerns about how effectively the Administration is assessing the marginal productivity of new positions and managing city resources. For example, the City hired additional police officers despite decades of steady declines in crime, and the police officer to population ratio exceeds most urban areas in the nation.13
As New York City enters the 109th month of an economic recovery—the longest in the post-World War II period—another concern relates to the risk of an economic downturn.14 During the Great Recession, there was a net reduction of 13,226 full-time positions from fiscal year 2008 to 2012, a 4.7 percent decrease in the City’s full-time workforce. The areas hit the hardest included pedagogical employees at DOE, the Administration for Children’s Services, and uniformed employees at the NYPD.15 Much of the downsizing was achieved through attrition although limited layoffs did occur. Attrition is problematic because the City cannot control which positions become vacant, resulting in certain critical positions going unfilled while less critical positions remain staffed. Layoffs are constrained by union and civil service rules that require seniority be considered.16 The City can achieve a smaller workforce through attrition and layoffs, but it is not necessarily left with an optimal workforce.
The long-term concern for the City is how headcount growth adds to already substantial long-term liabilities for pension and retiree health benefits. At the end of fiscal year 2017, the unfunded pension liability was $56.2 billion and the unfunded OPEB liability was $88.4 billion.17
Bending the Headcount Growth Curve
The Office of Management and Budget (OMB) has made some initial moves to control headcount growth through a partial hiring freeze and by removing vacant positions from the fiscal year 2019 budget. Three more substantial steps to control headcount growth are:
- Changing the default assumption that vacant positions will be retained and filled. Agencies prefer to keep positions in their budget, even if they do not intend to fill them, in order to have budgetary slack. Vacant positions should be reviewed, assessed, and if unneeded, removed from the budget for all years of the financial plan.
- Requiring agencies to look for opportunities to redeploy existing staff or utilize vacant lines when a new initiative is added, rather than creating new positions. CBC review of the Citywide Savings Program indicates that agencies are not doing enough to increase the efficiency of their operations; efficiency savings total 0.3 percent of agency budgets.18 Agencies should be required to justify why a new responsibility cannot be completed with existing resources. Headcount increases associated with new needs should be reported.
- Undertaking a review of all positions to identify obsolete assignments that could be replaced by technology, integrated into other positions, or eliminated. This may require broader reforms to restructure the workforce that require changes to collective bargaining rules and civil service laws to improve efficiency and maximize productivity.
The expansion of New York City’s workforce under Mayor de Blasio significantly impacts the city’s budget and long-term liabilities. Steps should be taken now to mitigate further growth.
Footnotes
- The Council of the City of New York, Report of the Finance Division on the Fiscal 2019 Preliminary Budget and the Fiscal 2018 Preliminary Mayor’s Management Report for the Department of Buildings (March 14, 2018), p. 2, https://council.nyc.gov/budget/wp-content/uploads/sites/54/2018/03/FY19-Department-of-Buildings.pdf.
- The Council of the City of New York, Report of the Finance Division on the Fiscal 2019 Preliminary Budget and the Fiscal 2018 Preliminary Mayor’s Management Report for the Department of Information Technology and Telecommunications (March 15, 2018), https://council.nyc.gov/budget/wp-content/uploads/sites/54/2018/03/FY19-Department-of-Information-Technology-and-Telecommunications.pdf.
- For instance, only 7.75 percent of the Department of Homeless Services’ $2.1 billion budget in fiscal year 2019 is reserved for compensation expenses because services are primarily carried out by contracted vendors. Between fiscal year 2014 and fiscal year 2019 (as of the Adopted Budget), citywide contractual spending is projected to increase 64.3 percent to reach $16.6 billion.
- The City provides for uniform basic health and hospital insurance to all City employees; supplemental health benefits, such as vision and dental coverage, are provided through negotiated contributions to individual union welfare funds. Several unions have also negotiated for the city to provide annual contributions into annuity funds that serve to provide supplemental income upon retirement and a Civil Legal Representation Fund. Other Pay includes shift differentials and uniform allowances.
- Hours of part-time personnel are aggregated to determine the equivalent number of full-time positions to be considered full-time equivalent positions.
- CBC calculated average base salaries and overtime earnings for pedagogical and civilian employees using budgeted expenditures for fiscal year 2019; each average was then multiplied by the number of net new hires. Uniform base salaries were taken from salary schedules in union contracts; to calculate overtime and other pay, CBC used payroll data to estimate average overtime and other earnings in an employee’s first to fifth years of employment. See: City of New York, Mayor’s Office of Management and Budget, Adopted Budget for Fiscal Year 2019, Supporting Schedules – All Volumes (June 2018), www1.nyc.gov/assets/omb/downloads/pdf/ss6-18.pdf, and Adopted Budget for Fiscal Year 2019, Full-Time and Full-Time Equivalent Staffing Levels (June 2018), www1.nyc.gov/assets/omb/downloads/pdf/adopt18-stafflevels.pdf; and City of New York, Office of Labor Relations, Patrolmen’s Benevolent Association 2010-2012 Agreement (February 26, 2016), p. 5, www1.nyc.gov/assets/olr/downloads/pdf/collectivebargaining/Police-Officers-08-01-2010-07-31-2012.pdf; Firefighters 2008-2010 Agreement (November 23, 2009), p. 6, www1.nyc.gov/assets/olr/downloads/pdf/collectivebargaining/cbu41-fire-uniformed-080108-to-073110.pdf; Correction Officers 2011-2019 Agreement (January 6, 2017), p. 7, www1.nyc.gov/assets/olr/downloads/pdf/collectivebargaining/coba-final-agreement-2011-2019.pdf; Sanitation Workers 2010-2012 Agreement (March 3, 2017), p. 2, www1.nyc.gov/assets/olr/downloads/pdf/collectivebargaining/usa-executed-contract-2011-2019.pdf; and CBC staff analysis of data from NYC OpenData, “Citywide Payroll Data (Fiscal Year)” (accessed June 27, 2018, last updated October 11, 2017), https://data.cityofnewyork.us/City-Government/Citywide-Payroll-Data-Fiscal-Year-/k397-673e.
- The average health insurance premium assumes 40 percent of city employees enroll in an individual plan and 60 percent of employees in the more expensive family plan. City of New York, Mayor’s Office of Management and Budget, email to Citizens Budget Commission staff (February 2, 2018).
- This does not include other fringe benefit costs such as unemployment insurance and workers compensation as they are difficult to estimate. Welfare fund and annuity contributions determined by type of worker based on collective bargaining agreements and actuarial reports. Pedagogical employees are exempt from the MTA mobility tax.
- Compensation costs for some new hires may be offset by savings or increased revenue; for example, the cost of increased headcount at DoITT to insource some services is offset by eliminating the prior contract. Similarly, the cost of additional traffic enforcement agents may be offset by increased ticket revenue.
- For example, a police officer hired today will see base salary increase from $42,819 to $83,758 over the first 6 years of service.
- Estimate assumes civilians accrue pension liability at a rate of 6.8 percent of annual salaries and wages annually and uniformed employees at a rate of 22.1 percent (Police), 18.9 percent (Fire), 17.4 percent (Correction), and 16.3 percent (Sanitation). Pension contributions start two years after an employee is first hired; however the estimate here starts in the first year of employment as it reflects the accrued liability, not the budgetary impact of these hires. City of New York, Mayor’s Office of Management and Budget, email to Citizens Budget Commission staff (June 27, 2018).
- The present value of the future benefit takes into account how long the benefit is likely to be used; the present value of the OPEB benefit for uniformed employees, who retire much earlier than civilian or pedagogical employees, is greater. See: Thad Calabrese, The Price of Promises Made (Citizens Budget Commission, October 2017), https://cbcny.org/research/price-promises-made.
- Maria Doulis, “Three Questions about 1,000 New Police Officers,” Citizens Budget Commission Blog (June 18, 2014), https://cbcny.org/research/three-questions-about-1000-new-police-officers.
- Office of the New York State Comptroller, Review of the Financial Plan of the City of New York: Report 11-2018 (March 2018), p. 3, https://www.osc.state.ny.us/osdc/rpt11-2018.pdf.
- While there was a reduction in uniformed headcount at the FDNY, this was not the result of the economic contraction, but rather due to a stoppage in new hiring while a racial discrimination lawsuit was litigated. See: Maria Doulis, “The New York City Budget Since the Recession: Seven Rounds of Cuts and the Deepest Still to Come,” Citizens Budget Commission Blog (February 6, 2011), https://cbcny.org/research/new-york-city-budget-recession.
- City of New York, Office of Labor Relations, 1995-2001 Citywide Agreement (May 19, 2000), p. 47, www1.nyc.gov/assets/olr/downloads/pdf/collectivebargaining/1995-2001-citywide-agreement-1.pdf; New York State Department of Civil Services, Guidelines for the Administration of Reductions in Force in Local Government (May 2002), https://cseany.org/wp-content/uploads/2014/01/reductions-in-work-force-manual-4-8.PDF.
- The funded ratio for the pension funds has increased from 64.8 percent in fiscal year 2013 to 71.2 percent in fiscal year 2017 as part of a plan to achieve full funding over a long-term period. The City has set aside $4.4 billion for OPEB liabilities but does not have a plan to fund this liability. See: Office of the New York City Comptroller, Comprehensive Annual Financial Report of the Comptroller, Fiscal Years 2013 and 2017 editions, https://comptroller.nyc.gov/reports/comprehensive-annual-financial-reports/.
- Efficiency savings as a share of City-funded agency expenditures in fiscal year 2019 are as of the Fiscal Year 2019 Executive Budget. See: City of New York, Mayor’s Office of Management and Budget, Executive Budget for Fiscal Year 2019, Citywide Savings Program (April 2018), www1.nyc.gov/assets/omb/downloads/pdf/csp4-18.pdf.