How Much Is Enough?
Accounting for the Growth in Homeless Services
Spending on homeless services by all New York City agencies is expected to reach at least $2.3 billion this year—an increase of 77 percent since fiscal year 2014. The growth has been driven by an increased number of homeless adults and families, as well as expansion of services provided. The Administration projects these investments will yield results that will decrease spending in fiscal year 2018, but the most recent data show that the homeless census continues to grow. Mayor de Blasio has said his Administration will release a new strategy on homelessness this month; this strategy should address how much more growth in the homeless population served is actually anticipated and provide milestones against which to measure progress towards more sustainable spending.
Spending on Homelessness Exceeds the Budget of the DHS
The Department of Homeless Services (DHS) budget is $1.7 billion in fiscal year 2017; however, DHS is not the only agency to provide services to the homeless. Table 1 shows the City spends $2.3 billion on homelessness when relevant services from 9 other agencies are included.1
Table 1: Homeless Services Spending by Agency, Fiscal Year 2017
(dollars in millions)
| Agency | Fiscal Year 2017 | % of Total |
| Department of Homeless Services (DHS) | $1,688.5 | 72.9% |
| Human Resources Administration (HRA) | $515.3 | 22.3% |
| Housing Preservation and Development (HPD) | $72.4 | 3.1% |
| Department of Youth and Community Development (DYCD) | $29.5 | 1.3% |
| Department of Health and Mental Hygiene (DOHMH) | $6.9 | 0.3% |
| New York Policy Department (NYPD) | $1.7 | 0.1% |
| Department of Veteran's Services (DVS) | $0.7 | 0.0% |
| Fire Department of New York (FDNY) | $0.4 | 0.0% |
| Department of Design and Construction (DDC) | $0.3 | 0.0% |
| Department of Buildings (DOB) | $0.1 | 0.0% |
| TOTAL | $2,315.7 | 100.0% |
Source: CBC Analysis of New York City Office of Management and Budget, Budget Function Analysis (January 24, 2017); and Departmental Estimates (January 24, 2017).
The Human Resources Administration (HRA) is the agency with the second largest amount of spending, $515 million in fiscal year 2017. After an April 2016 restructuring, some responsibilities have shifted between the DHS and HRA, with HRA taking on an expanded role in managing preventative and re-housing services.2 The 8 other agencies collectively spend approximately $110 million annually. The Department of Housing Preservation and Development (HPD) spends $72 million on rental assistance and emergency shelters. The Departments of Youth and Community Development (DYCD) and Veterans Services spend $30 million on shelters for runaway youths and $0.7 million on services for veterans, respectively. The Department of Mental Health and Hygiene (DOHMH) spends $7 million on homeless outreach. The other agencies, including the Police Department, Fire Department, Buildings Department, and Department of Design and Construction, provide services related to adequately maintaining and securing shelters, and collectively comprise 1 percent of the total.
Spending on Homelessness Has Grown 77 Percent Since Fiscal Year 2014
Since fiscal year 2014, Mayor Bill de Blasio’s first year in office, spending on homeless services has grown $1 billion to $2.3 billion in fiscal year 2017. Most of the growth is attributable to spending on shelters, which grew $560.5 million, or 54 percent, to $1.6 billion in fiscal year 2017. However, spending in three other areas – prevention, re-housing, and street homelessness – has doubled or almost tripled since 2014. The following sections describe important developments and policy changes driving the growth of each service area.
Table 2: Total Homeless Service Spending, By Function, FY2014 and FY2017
(dollars in millions)
| Function | FY2014 | FY2017 | Change in Dollars | Change in Percent |
| Shelters | $1,034.2 | $1,594.7 | $560.5 | 54% |
| Prevention | $98.0 | $286.1 | $188.1 | 192% |
| Re-housing | $60.8 | $215.6 | $154.8 | 254% |
| Administration | $77.3 | $138.9 | $61.6 | 80% |
| Street Homelessness | $39.8 | $80.5 | $40.7 | 102% |
| Total | $1,310.1 | $2,315.7 | $1,005.6 | 77% |
Source: CBC staff analysis of New York City Office of Management and Budget, Budget Function Analysis (June 26, 2014 and January 24, 2017); Departmental Estimates (January 24, 2017); and Supporting Schedules - All Volumes (June 26, 2014).
Shelters
Providing temporary shelter is by far the most expensive service the City provides for the homeless; it is projected to total $1.6 billion in fiscal year 2017. The City operates shelters for six distinct populations. DHS operates separate shelter systems for single adults and families. The greatest amount of spending is on family shelters, which housed 47,820 people as of December 2016 and are projected to cost $851 million in fiscal year 2017. Operating adult shelters will cost $531 million to house almost 15,000 individuals.3
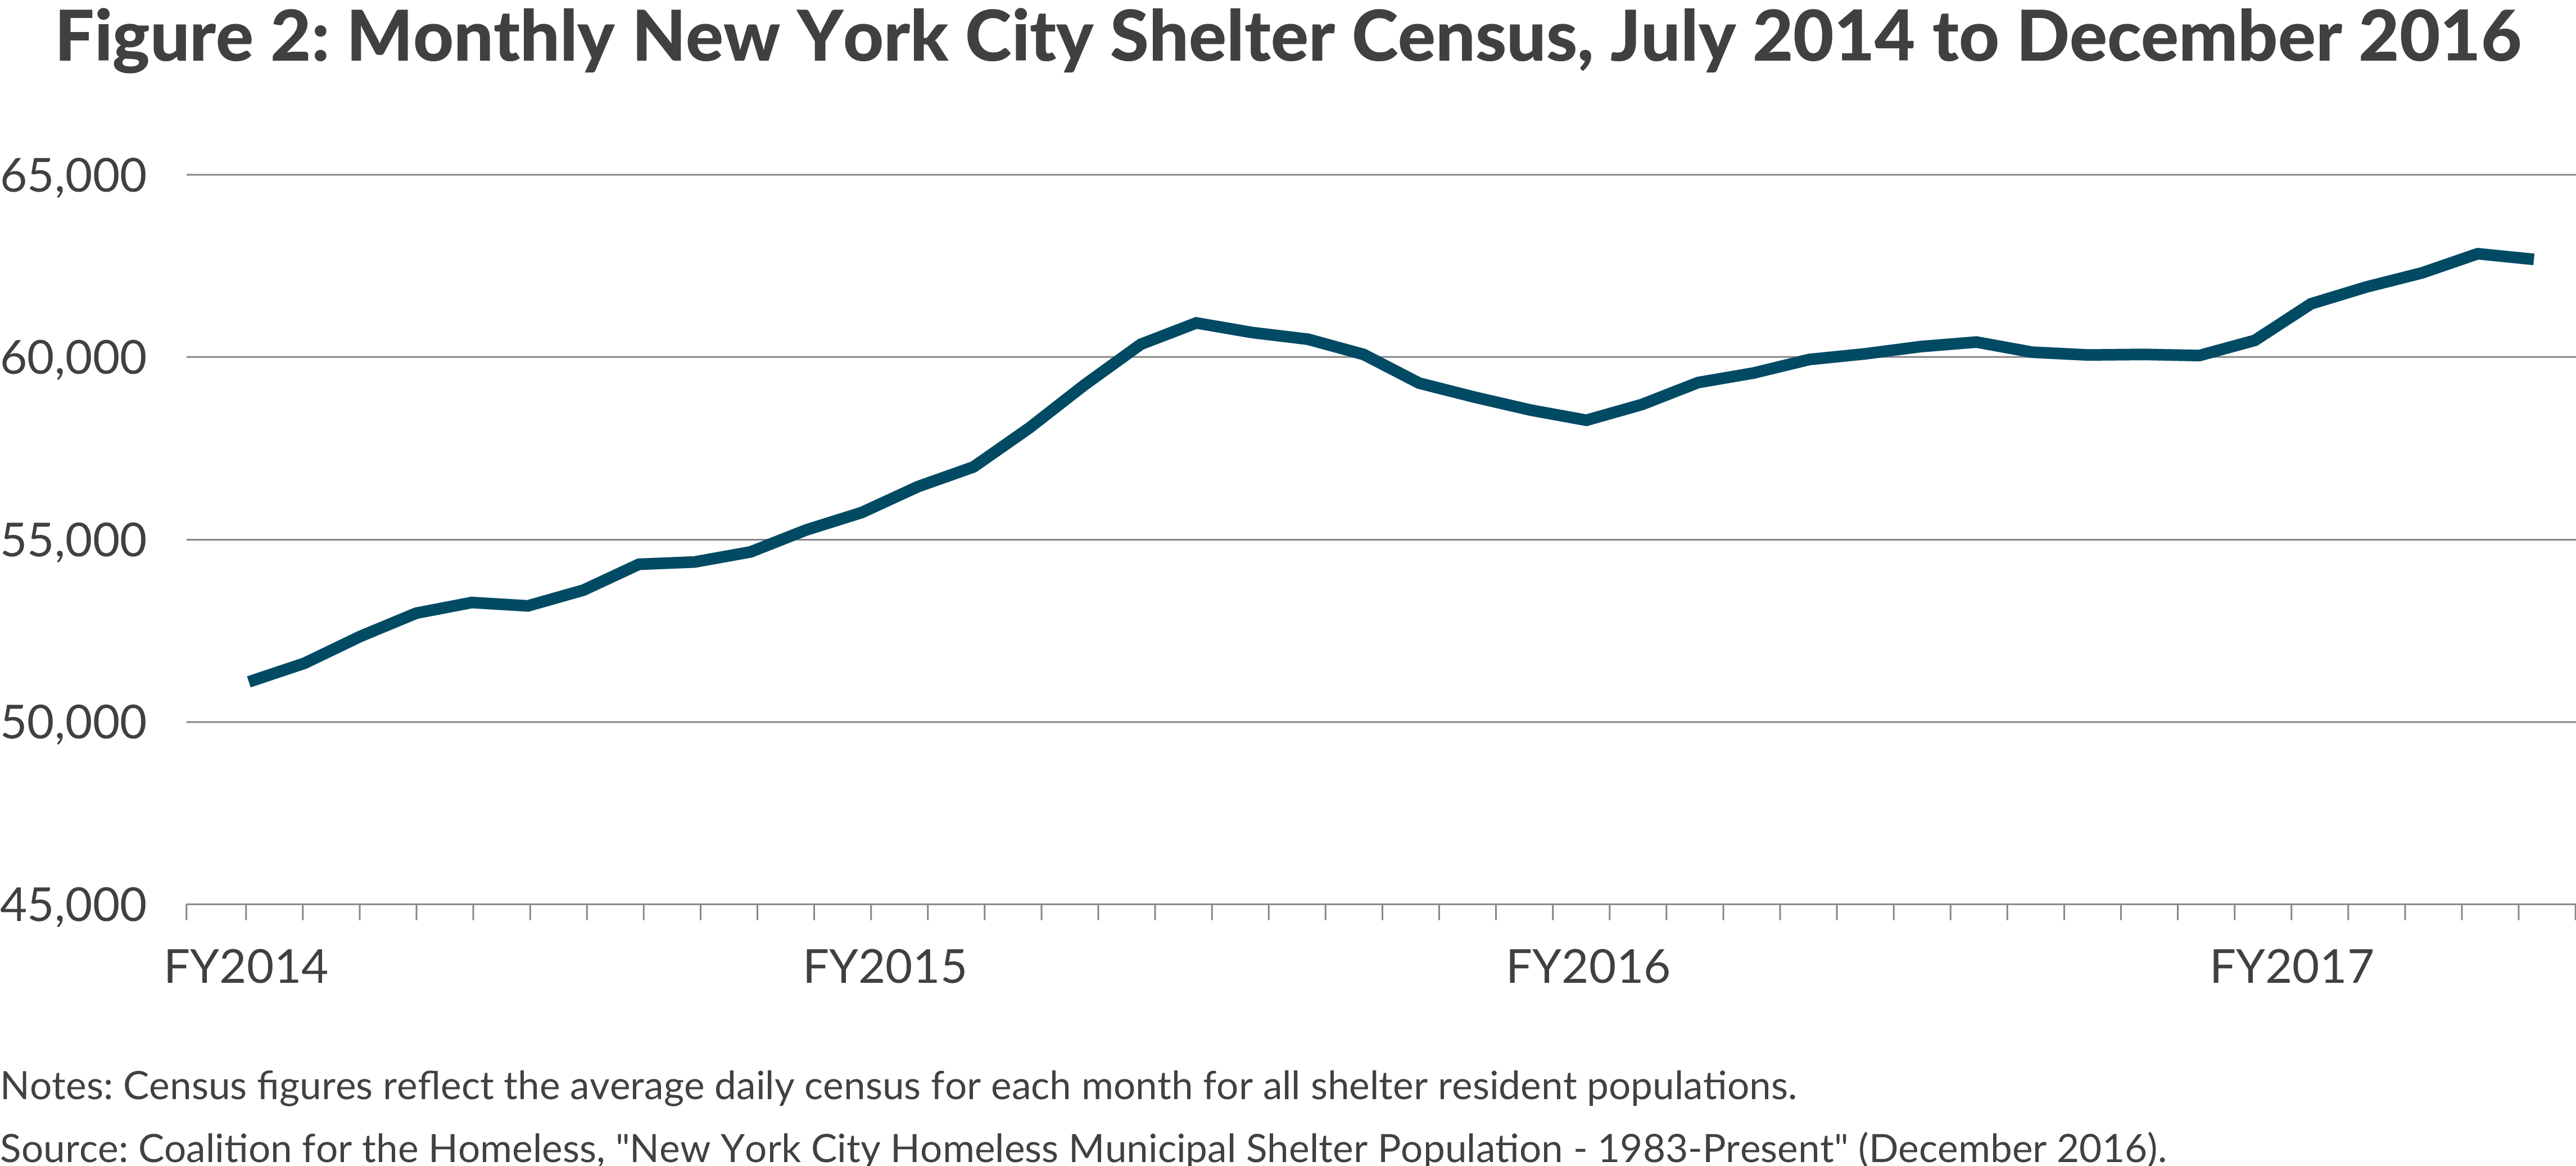
The City is legally obligated to provide shelter to any single adult requesting services and to any eligible family.4 The shelter census has grown 23 percent since the beginning of fiscal year 2014 from 51,106 to 62,674. As a result, shelter units have been filled and the City has turned to more expensive options, such as hotels. Between fiscal years 2014 and 2016 the average cost of shelter per day increased 18.4 percent to $120 for families and 20.7 percent to $95 for single adults.5

HRA operates shelters for victims of domestic violence and households affected by HIV/AIDS. Domestic Violence shelters ($87 million) serve on average 840 families a day while emergency HIV/AIDS shelter ($31 million) housed 762 single adults and three families in December 2016.6 HRA and the Department of Housing and Preservation both operate emergency shelters for people who have lost their homes due to fire or vacate orders.7 Together those will cost $61.6 million in fiscal year 2017.
DYCD provides emergency shelters for runaway and homeless youth. In fiscal year 2017 spending is expected to be $29.5 million, more than double what the city spent in fiscal year 2014. The de Blasio Administration has continued the expansion of this service which started under Mayor Bloomberg—100 crisis beds were added in fiscal year 2016 and the City aims to do the same in fiscal years 2017, 2018 and 2019.8
Prevention
Preventive services are projected to cost $286 million in fiscal year 2017, an increase of $188 million and 192 percent since fiscal year 2014. Preventive services now account for 12 percent of total homelessness spending, up from 7.5 percent.
The City has expanded anti-eviction services at a total cost of $117 million in fiscal year 2017. A recently announced initiative to provide low-income tenants with lawyers will further increase this spending by $15 million next year and $93 million annually when fully implemented in fiscal year 2022.9 In addition, several diversion programs keep households in their apartments or place them in alternative housing to prevent entry into shelters. In the first four months of 2017, HRA granted nearly 19,000 requests for emergency rental assistance (approving 65 percent of requests).10
Other preventive services include DHS’ HomeBase Program, which offers assistance with legal action, financial assistance for back rent, and assistance with housing relocation.11
Re-Housing
New York City offers a variety of housing voucher programs in an effort to move households and individuals out of shelter and into more permanent living situations. In total, these programs will cost the city $216 million this year. After a previous rental assistance program, Advantage, ended in fiscal year 2012, re-housing spending declined. The de Blasio Administration launched a new rental assistance program called Living in Communities (LINC) in October 2015, and as a result, spending on re-housing efforts has more than doubled since fiscal year 2014.
LINC provides housing vouchers to reduce rent burdens. In most cases the vouchers require recipients to put 30 percent of their household income towards rent, are capped at five years with yearly required renewals, and place limits on the maximum rents that the City will pay.12 LINC will cost $113.5 million this year. In addition, HRA also runs HOME-Tenant Based Rental Assistance (HOME-TBRA) and City Family Exit Plan Supplement (City FEPS). In fiscal year 2016, 9,560 households were moved out of shelter and into subsidized permanent housing.13
Other programs include supportive Single Room Occupancy units for shelter residents who are working and “project-based” rental assistance provided through federally-funded programs such as “Section 8” and the Shelter Care Plus grant.
Street Homelessness
Spending on services for the street homeless will total $80.5 million in fiscal year 2017. DHS established a dedicated Homeless Outreach and Mobile Engagement Street Action Team (HOME-STAT) in March 2016 to conduct outreach to the City’s estimated 2,800 street homeless and connect them with housing.14 The team has placed 693 clients into permanent, transitional or other housing since it was established.15 DHS also operates five drop-in centers where clients can access hot meals, showers, laundry facilities and medical care.16 DOHMH also performs homeless outreach services. Service enhancements like Home-STAT have contributed to a 102 percent increase in street homeless spending since fiscal year 2014.
Administration
The administrative costs included in this analysis are comprised of DHS’s administrative expense and two minor items in the HRA Administration budget that are clearly ascribed to homeless services. This figure likely understates total administrative costs because they are not allocated to specific programs in the budget; nevertheless, the costs that are captured have grown by 80 percent.
Spending for Homelessness is Likely to Continue Growing, Despite Optimistic Budget Forecasts
The Preliminary Budget for Fiscal Year 2018 indicates that spending on homelessness is projected to decrease to $2.1 billion in fiscal year 2018. While additional investments are planned for rental assistance and services for the street-homeless, spending on shelters and preventive services is reduced 10 percent and 14 percent, respectively.
Table 3: Homeless Services Spending by Function, FY2017 and FY2018
(dollars in millions)
| Function | FY2017 | FY2018 | Percent Change |
| Shelters | $1,594.7 | $1,438.8 | -10% |
| Re-Housing | $215.6 | $251.3 | 17% |
| Prevention | $286.1 | $245.0 | -14% |
| Administration | $138.9 | $109.3 | -21% |
| Street Homelessness | $80.5 | $86.1 | 7% |
| Total | $2,315.7 | $2,130.5 | -8% |
Source: New York City Office of Management and Budget, Budget Function Analysis (January 24, 2017); and Departmental Estimates (January 24, 2017).
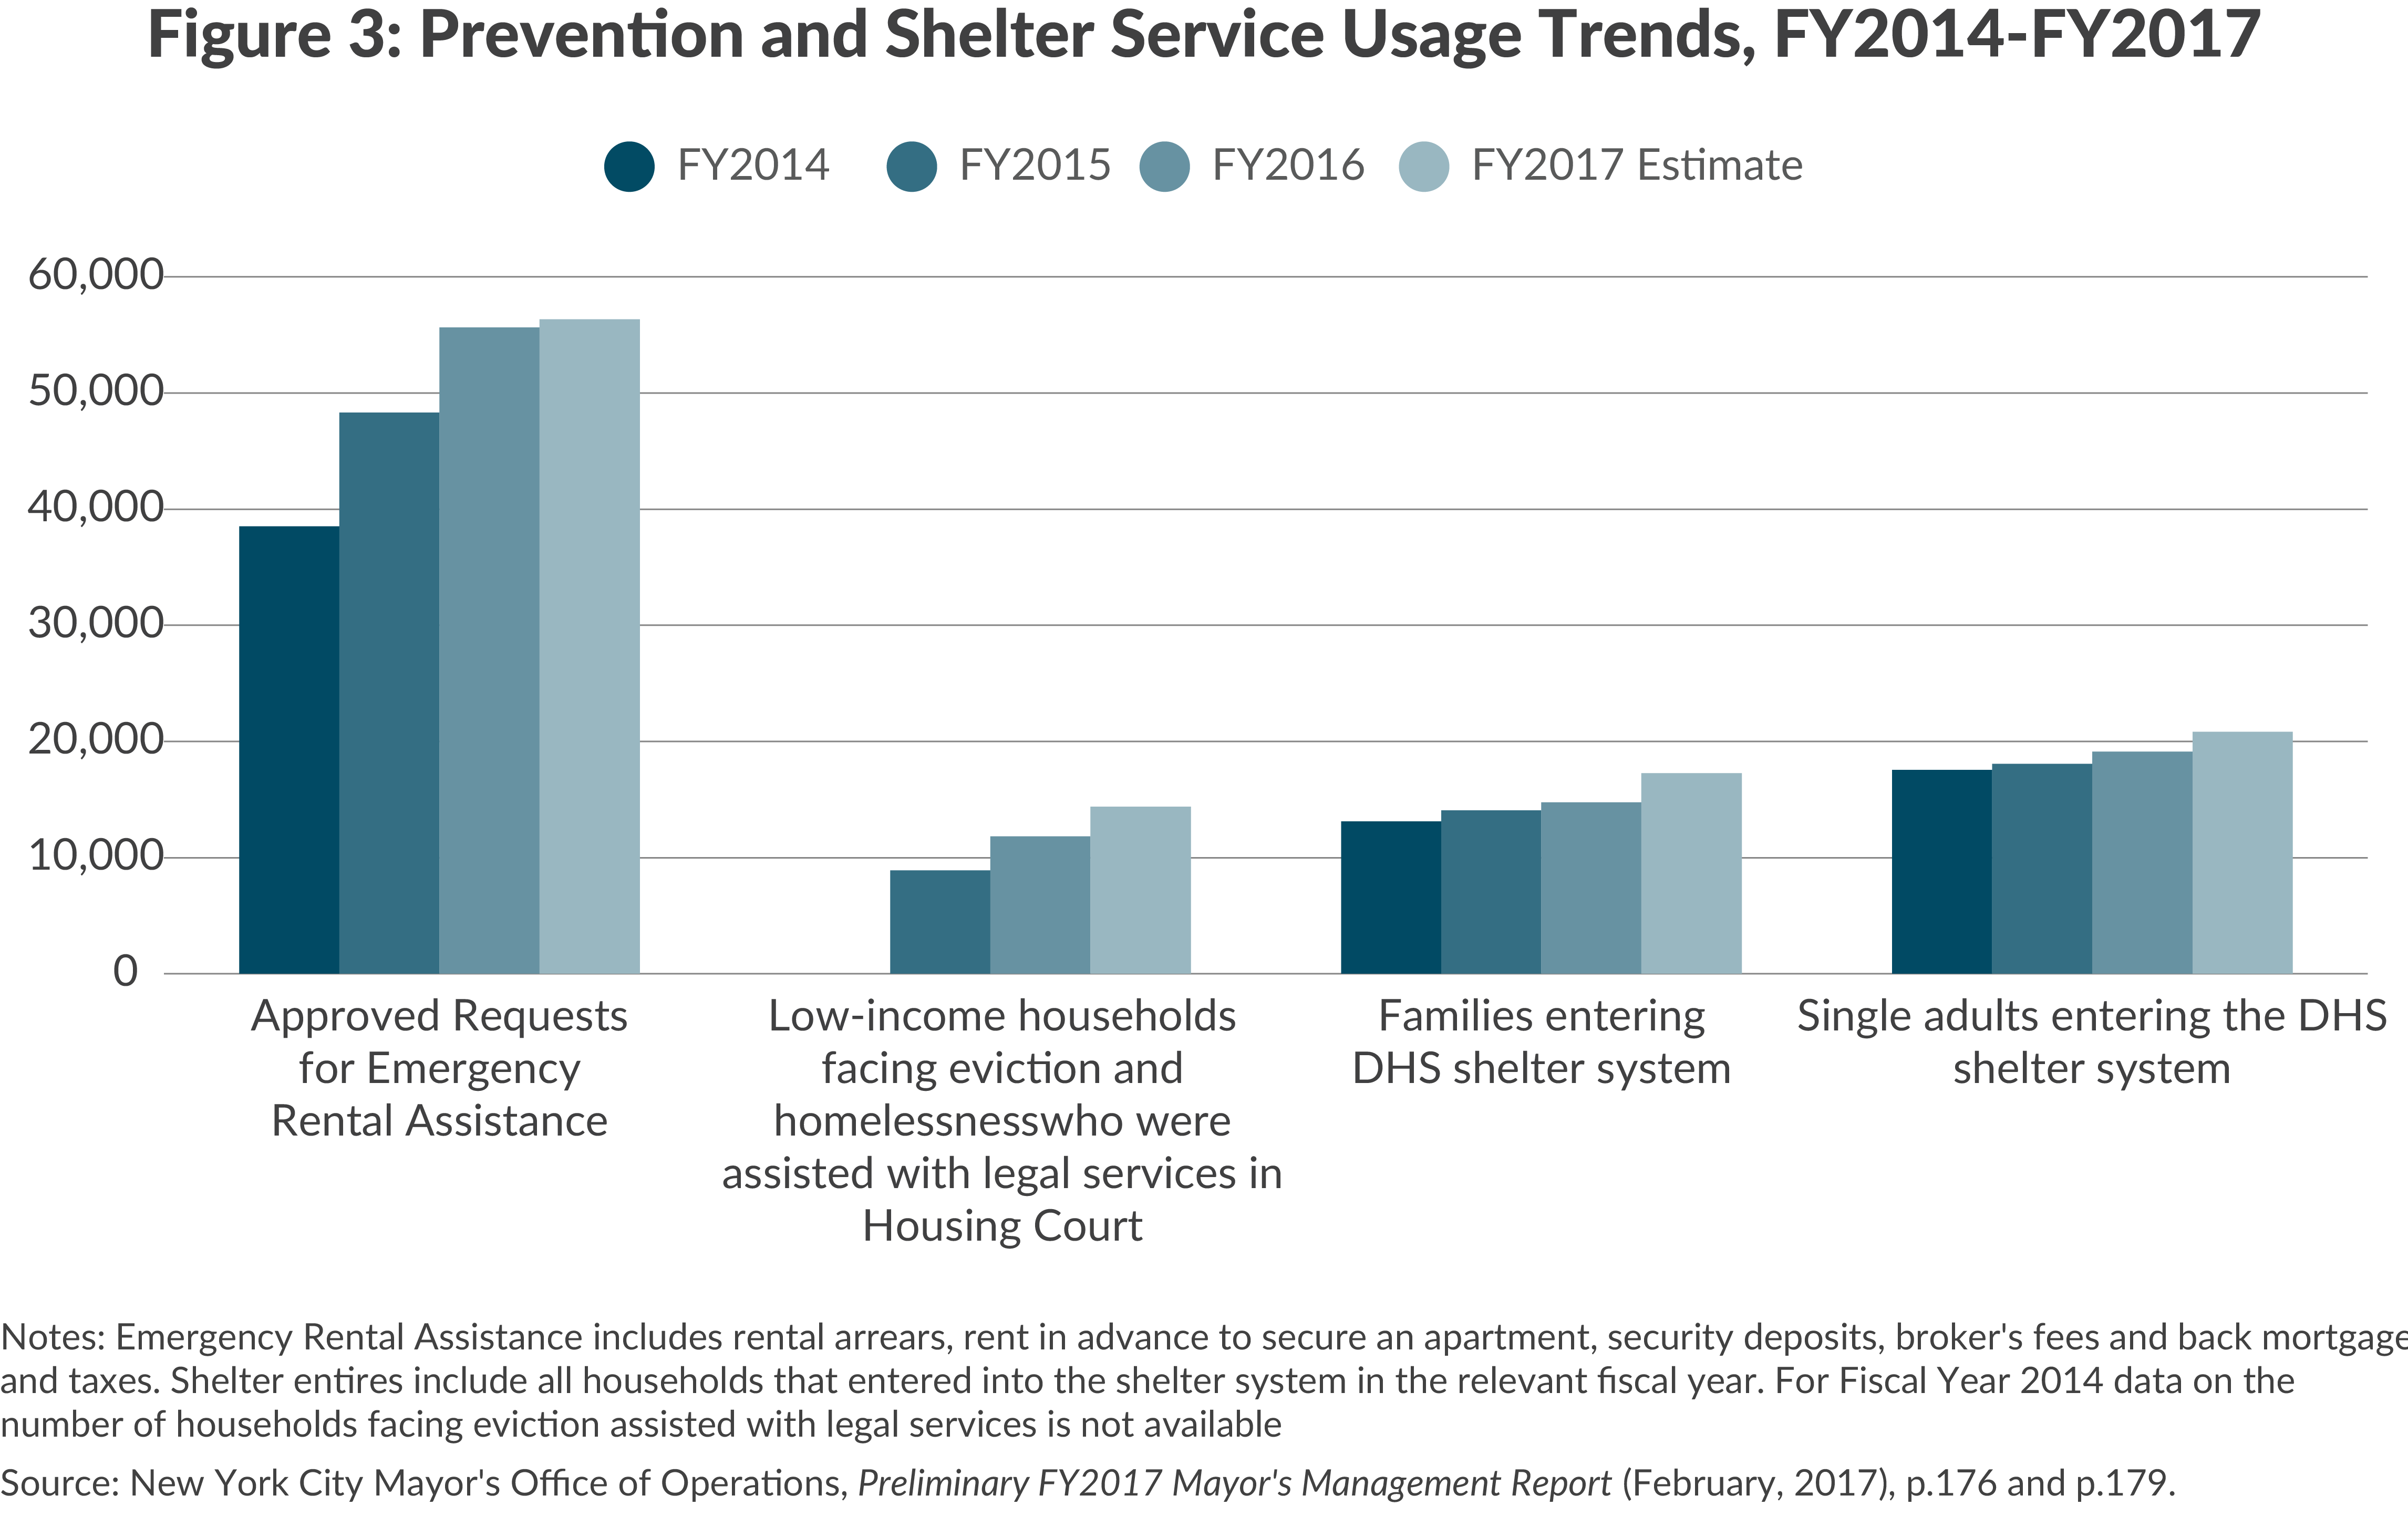
There is reason to be skeptical of these reductions. As Figure 3 shows, there’s been consistent growth in caseloads for preventive and shelter services over the past three years; these growing caseloads have prompted the City to make mid-year adjustments to increase current-year spending on homelessness in each of the last three fiscal years. If utilization of these services for the first four months of fiscal year 2017 is extrapolated for the fiscal year, it is likely caseloads will continue to grow and the City will also increase spending in fiscal year 2018.
Conclusion
Spending on homeless services has increased by $1 billion since fiscal year 2014, and is poised to continuing growing in fiscal year 2018 despite optimistic budget projections. This spending growth has far exceeded that of any other municipal service; the Administration must address how much more growth will be acceptable. Any new strategy for service redesign or expansion in this area should be accompanied by milestones for reducing spending to sustainable levels.
Footnotes
- This estimate relies on publicly available budget documents, and as a result, may not be a comprehensive accounting. Figures for fiscal year 2014 are taken from the Adopted Budget for Fiscal Year 2015; actual spending is not provided at the level of detail needed for this analysis. In addition, the analysis excludes New York City Housing Authority (NYCHA) support to homeless families and individuals through prioritization for apartments in their developments and through Section 8 vouchers. While some of the cost of priority referrals for NYCHA units is reflected in the city’s rental voucher programs, NYCHA's full commitment is not quantified. Administrative expenses for all agencies other than DHS are also excluded.
- New York City Human Resources Administration, Review of Homeless Service Agencies and Programs (April 11, 2016), http://www1.nyc.gov/assets/home/downloads/pdf/reports/2016/90-day-homeless-services-review.pdf.
- Coalition for the Homeless, "New York City Homeless Municipal Shelter Population- 1983-Present" (December 2016), http://www.coalitionforthehomeless.org/wp-content/uploads/2014/04/NYCHomelessShelterPopulation-Worksheet1983-Present_Dec2016.pdf.
- The right to shelter for single men was established by Callahan v. Carey, No 79-42582 (Supreme Ct, NY County, Cot. 18, 1979). Eldredge v. Koch, 98 A.D.2d 675, 469 N.Y.S.2d 744 [1st Dept 1983] expanded this to include single women. In December 2008, the Bloomberg Administration settled four lawsuits brought by the Legal Aid Society pertaining to family shelter: McCain v. Bloomberg, 9 Misc.3D 1107(A), 806 N.Y.S.2d, 446 (Table) (Sp. Ct. N.Y. Ct. August 16, 2005); Lamboy v. Doar, No 86-41108 (Supreme Ct, NY County), Slade v. Bloomberg, No 86-45177 (Supreme Ct, NY County), Cosentino v. Carrion, No 85-43236 (Supreme Ct, NY County). The settlement (Boston v. City of New York, No. 08-402295 ((Supreme Ct, NY County)) ensures families access to shelter and specifies eligibility procedures. The City is required to investigate whether a family has other housing available to them and families must cooperate with the investigation. The City is further required to assist in securing documentation from other sources, cannot deny on the basis of noncooperation of other sources, must consider whether housing is unsafe or overcrowded, must inquire about domestic violence and refer to specially trained staff if needed. Families are allowed to reapply at any time.
- New York City Mayor’s Office of Operations, Preliminary FY 2017 Mayor’s Management Report (February 2017), p.180, http://www1.nyc.gov/assets/operations/downloads/pdf/pmmr2017/2017_pmmr.pdf.
- HRA provides short-term emergency housing and longer-term supportive housing for eligible clients. For the purposes of this analysis, only emergency housing is included. See: New York City Mayor’s Office of Operations, Local Law 37: Temporary Housing Assistance Usage (December 2016), p.8, https://www1.nyc.gov/assets/operations/downloads/pdf/temporary_housing_report.pdf; and Preliminary FY 2017 Mayor’s Management Report (February 2017), p.166, http://www1.nyc.gov/assets/operations/downloads/pdf/pmmr2017/2017_pmmr.pdf.
- The Council of the City of New York, Report on the Fiscal 2017 Preliminary Budget and the Fiscal 2016 Preliminary Mayor’s Management Report: Department of Housing Preservation and Development (March 3, 2016), p.18, http://council.nyc.gov/budget/wp-content/uploads/sites/54/2016/05/806-Housing-Preservation-and-Development.pdf.
- The Council of the City of New York, Report on the Fiscal 2017 Preliminary Budget and the Fiscal 2016 Preliminary Mayor’s Management Report: Department of Youth and Community Development (March 18, 2016), p.21, http://council.nyc.gov/budget/wp-content/uploads/sites/54/2016/05/260-Department-of-Youth-and-Community-Development.pdf.
- New York City Office of the Mayor, “State of the City: Mayor de Blasio and Speaker Mark-Viverito Rally Around Universal Access to Free Legal Services for Tenants Facing Eviction in Housing Court” (press release, February 12, 2017), http://www1.nyc.gov/office-of-the-mayor/news/079-17/state-the-city-mayor-de-blasio-speaker-mark-viverito-rally-universal-access-free.
- Emergency Rental Assistance Grants are one-time payments of rent, unpaid back rent, and associated fees and charges to allow households to remain in their apartments. See: New York City Mayor’s Office of Operations, Preliminary FY 2017 Mayor’s Management Report (February, 2017), p.166, http://www1.nyc.gov/assets/operations/downloads/pdf/pmmr2017/2017_pmmr.pdf.
- The Council of the City of New York, Report on the Fiscal 2017 Preliminary Budget and the Fiscal 2016 Preliminary Mayor’s Management Report: Department of Homeless Services (March 15, 2016), http://council.nyc.gov/budget/wp-content/uploads/sites/54/2016/05/071-Department-of-Homeless-Services.pdf.
- The Council of the City of New York, Report on the Fiscal 2017 Preliminary Budget and the Fiscal 2016 Preliminary Mayor’s Management Report: Department of Homeless Services (March 15, 2016), p.4, http://council.nyc.gov/budget/wp-content/uploads/sites/54/2016/05/071-Department-of-Homeless-Services.pdf.
- New York City Mayor’s Office of Operations, Preliminary FY 2017 Mayor’s Management Report (February 2017), p.190, http://www1.nyc.gov/assets/operations/downloads/pdf/pmmr2017/2017_pmmr.pdf.
- The annual HOPE count was completed on February 6, 2017, but results have not yet been published. The most recent estimate is as of Fall 2016. See: New York City Department of Homeless Services, “Home-Stat Quarterly Nighttime Counts” (February 2017), http://www1.nyc.gov/site/operations/projects/HomeStat-Quarterly.page; and “New York City Conducts 12th Annual HOPE Survey” (press release, February 7, 2017), https://www1.nyc.gov/site/dhs/about/press-releases/hope-2017-release.page.
- New York City Office of the Mayor, “Home-Stat Initiative Houses Almost 700 Formerly Street Homeless New Yorkers” (press release, December 21, 2016), http://www1.nyc.gov/office-of-the-mayor/news/968-16/home-stat-initiative-houses-almost-700-formerly-street-homeless-new-yorkers.
- New York City Open Data, “Directory of Homeless Drop-In Centers” (September 5, 2014), https://data.cityofnewyork.us/Social-Services/Directory-Of-Homeless-Drop-In-Centers/bmxf-3rd4/data.