More Than Fare
Options for Funding Future Capital Investments by the MTA
The United States faces a double challenge in addressing its transportation infrastructure needs. First, new money must be raised to supplement or replace the gasoline tax as the financial foundation of these investments. Since the mid-20th century the gasoline tax has been the major source of federal and state funding for investments in the highway system, but now it is a less powerful financial engine; more fuel-efficient vehicles, growing reliance on alternative fuels, and other changes have reduced consumption and the associated revenue a per-gallon excise tax generates. From 2004 to 2013 outlays of the federal Highway Trust Fund—previously supported almost exclusively by the gasoline tax—exceeded revenue by more than $52 billion, requiring transfers from the general fund.1
Second, transportation investments must better promote a more environmentally friendly system that generates less pollution and slows the phenomenon known as climate change. This requires altering the types of investments to better balance motor vehicle and other modes of travel, as well as developing funding sources to create incentives to consume less fossil fuel and limit inefficient motor vehicle use while recognizing the critical role of roads and bridges in the American transportation system.
Federal action is required to meet these challenges successfully, but state governments have a vital role. States supplement federal funding with their own taxes and user fees and make decisions about how to invest available resources. Because political pressures at the federal level have thwarted national efforts to transform the system, states have become innovators in pursuing new financing strategies and testing approaches before they are adopted nationally.
New York State can be an especially important player in the development of an improved financing system because of the unique nature of its transportation system. More than any other state, New York—notably its economically important downstate region—relies on mass transit along with an extensive road network. The facilities operated by the Metropolitan Transportation Authority (MTA) are at the core of this distinctive system. Nearly 6 of every 10 of the 3.7 million people entering the Manhattan central business district each weekday rely on its subways, buses, and commuter railroads; many more use its bridges and tunnels to get their jobs and shopping destinations. Disruptions such as the transit strike in 2005 and Superstorm Sandy in 2012 dramatically underscored the region’s dependence on a reliable mass transit system and the importance of protecting, maintaining, and enhancing this infrastructure. Despite its critical role the MTA often confronts troubling financial circumstances including difficulties in raising funds for essential capital investments.
This report examines the MTA’s current fiscal challenges and identifies options for funding its capital investment needs for the next five years. The analysis of these options includes consideration of how well measures to raise money for the MTA fit into a broader financing plan for the state’s entire transportation system, including its extensive road and bridge network. Specifically, this report addresses two questions: (1) how much money does the MTA require to address its capital investment needs, and (2) from where should any requisite new money come?
To answer the first question the report identifies the resources available to the MTA under current policies and compares that to the amounts required both to sustain current operations and to meet reasonable future capital investment needs. The findings from this analysis are:
- Under reasonable assumptions including scheduled fare and toll increases, but subject to risks in achieving planned savings and from a possible economic downturn, the MTA has sufficient cash resources to meet its operating needs in the first three years of a four-year planning period, 2015-2018.
- Current policies do not provide sufficient resources to fund priority capital investment needs in the upcoming 2015-2019 capital plan. Two scenarios for the plan are considered—a baseline equal to the plan recommended by the MTA in September 2014 (about $32.0 billion) and a lower-level plan (about $29.3 billion) adjusted to reflect constrained resources. For each scenario the reliably available sources under current policies are estimated at about $13.1 billion, leaving gaps of $19.0 billion and $16.5 billion under the two scenarios.
- Assuming the funding gap is closed through long-term borrowing, the future increment in annual debt service obligations will reach nearly $1.2 billion under the baseline scenario or $1.0 billion under the lower-level scenario. A recurring revenue stream of this size is needed to close the funding gap in whole or in part.
- Authorizing the new revenue stream in 2015 is essential to enable the MTA to make commitments for its capital projects; however, the new revenue can be phased in to match cash flow needs for contracts payments spanning a multiyear period.
The answer to the second question is derived from the Citizens Budget Commission’s (CBC) previous work establishing guidelines for mass transit funding.2 The recommended allocation, summarized as “50-25-25,” is: half the needed money should come from fares paid by transit riders; one-quarter should come from motor vehicle user fees and tolls paid by motorists; and one-quarter should come from state and local government tax subsidies. This tax support should also cover the backlog of “state of good repair” (SGR) capital needs due to prior underfunding. The CBC guidelines, consistent with long-standing federal policy, also require road and bridge investments be supported by motor vehicle user fees such as the gasoline tax.
Applying these guidelines to the MTA’s current funding policies and the funding gap for the 2015-2019 capital plan leads to these policy implications:
- Modest future fare increases beyond those already planned are needed. For the two scenarios the incremental increases in fare revenue over the next decade are 3.5 percent and 4.2 percent.
- The largest source of new revenue should be motor vehicle user charges. By 2025 the sum raised from this source should reach about $3.7 billion, more than double the sum anticipated under current policies in 2018 of $1.6 billion.
- CBC explored four options for raising substantial new funds from vehicle users: alternative tolling policies, higher motor vehicle registration fees, increased motor fuel taxes, and a new vehicle-miles traveled (VMT) tax. Raising vehicle registration fees and increasing motor fuel taxes to levels competitive with those in neighboring states or other higher fee states have limited potential to close the funding gap. Each can yield only between 3 percent and 8 percent of the needed funds. Raising gasoline taxes to a level well above that of any other state—50 cents per gallon versus 43.185 cents per gallon in California—and increasing the MTA’s share of gasoline tax receipts would raise more money but still yield less than one quarter of the needed funds.
A new VMT tax and dramatically altered tolling policies such as those in the plan advocated by the Move NY coalition have the greatest potential to close the funding gap. The VMT tax and the innovative tolling policies also generate revenue for road and bridge improvements, with the VMT being applicable statewide. New York’s elected leaders should commit to such changes and develop a multiyear plan for implementation.
How Much New Money Does the MTA Need?
In order to determine how much additional money the MTA needs for future capital investments, this analysis (1) compares the agency’s expected revenues and expenses over the current financial plan, spanning 2015 through 2018, in order to identify potential surpluses or deficits that arise from ongoing operations, and (2) identifies new resources necessary to fund capital investments under two scenarios—the agency’s recently planned investment level and a lower-level reflecting tighter constraints.
Resources Available From Current Policies
The MTA has two major types of revenues: user fees, primarily in the form of fares and tolls, and dedicated taxes and subsidies from state and local governments. In 2014 these revenues are expected to total nearly $14.3 billion with about 44 percent from taxes and subsidies and the remainder from fares, tolls, and other earned income. (See Table 1.)
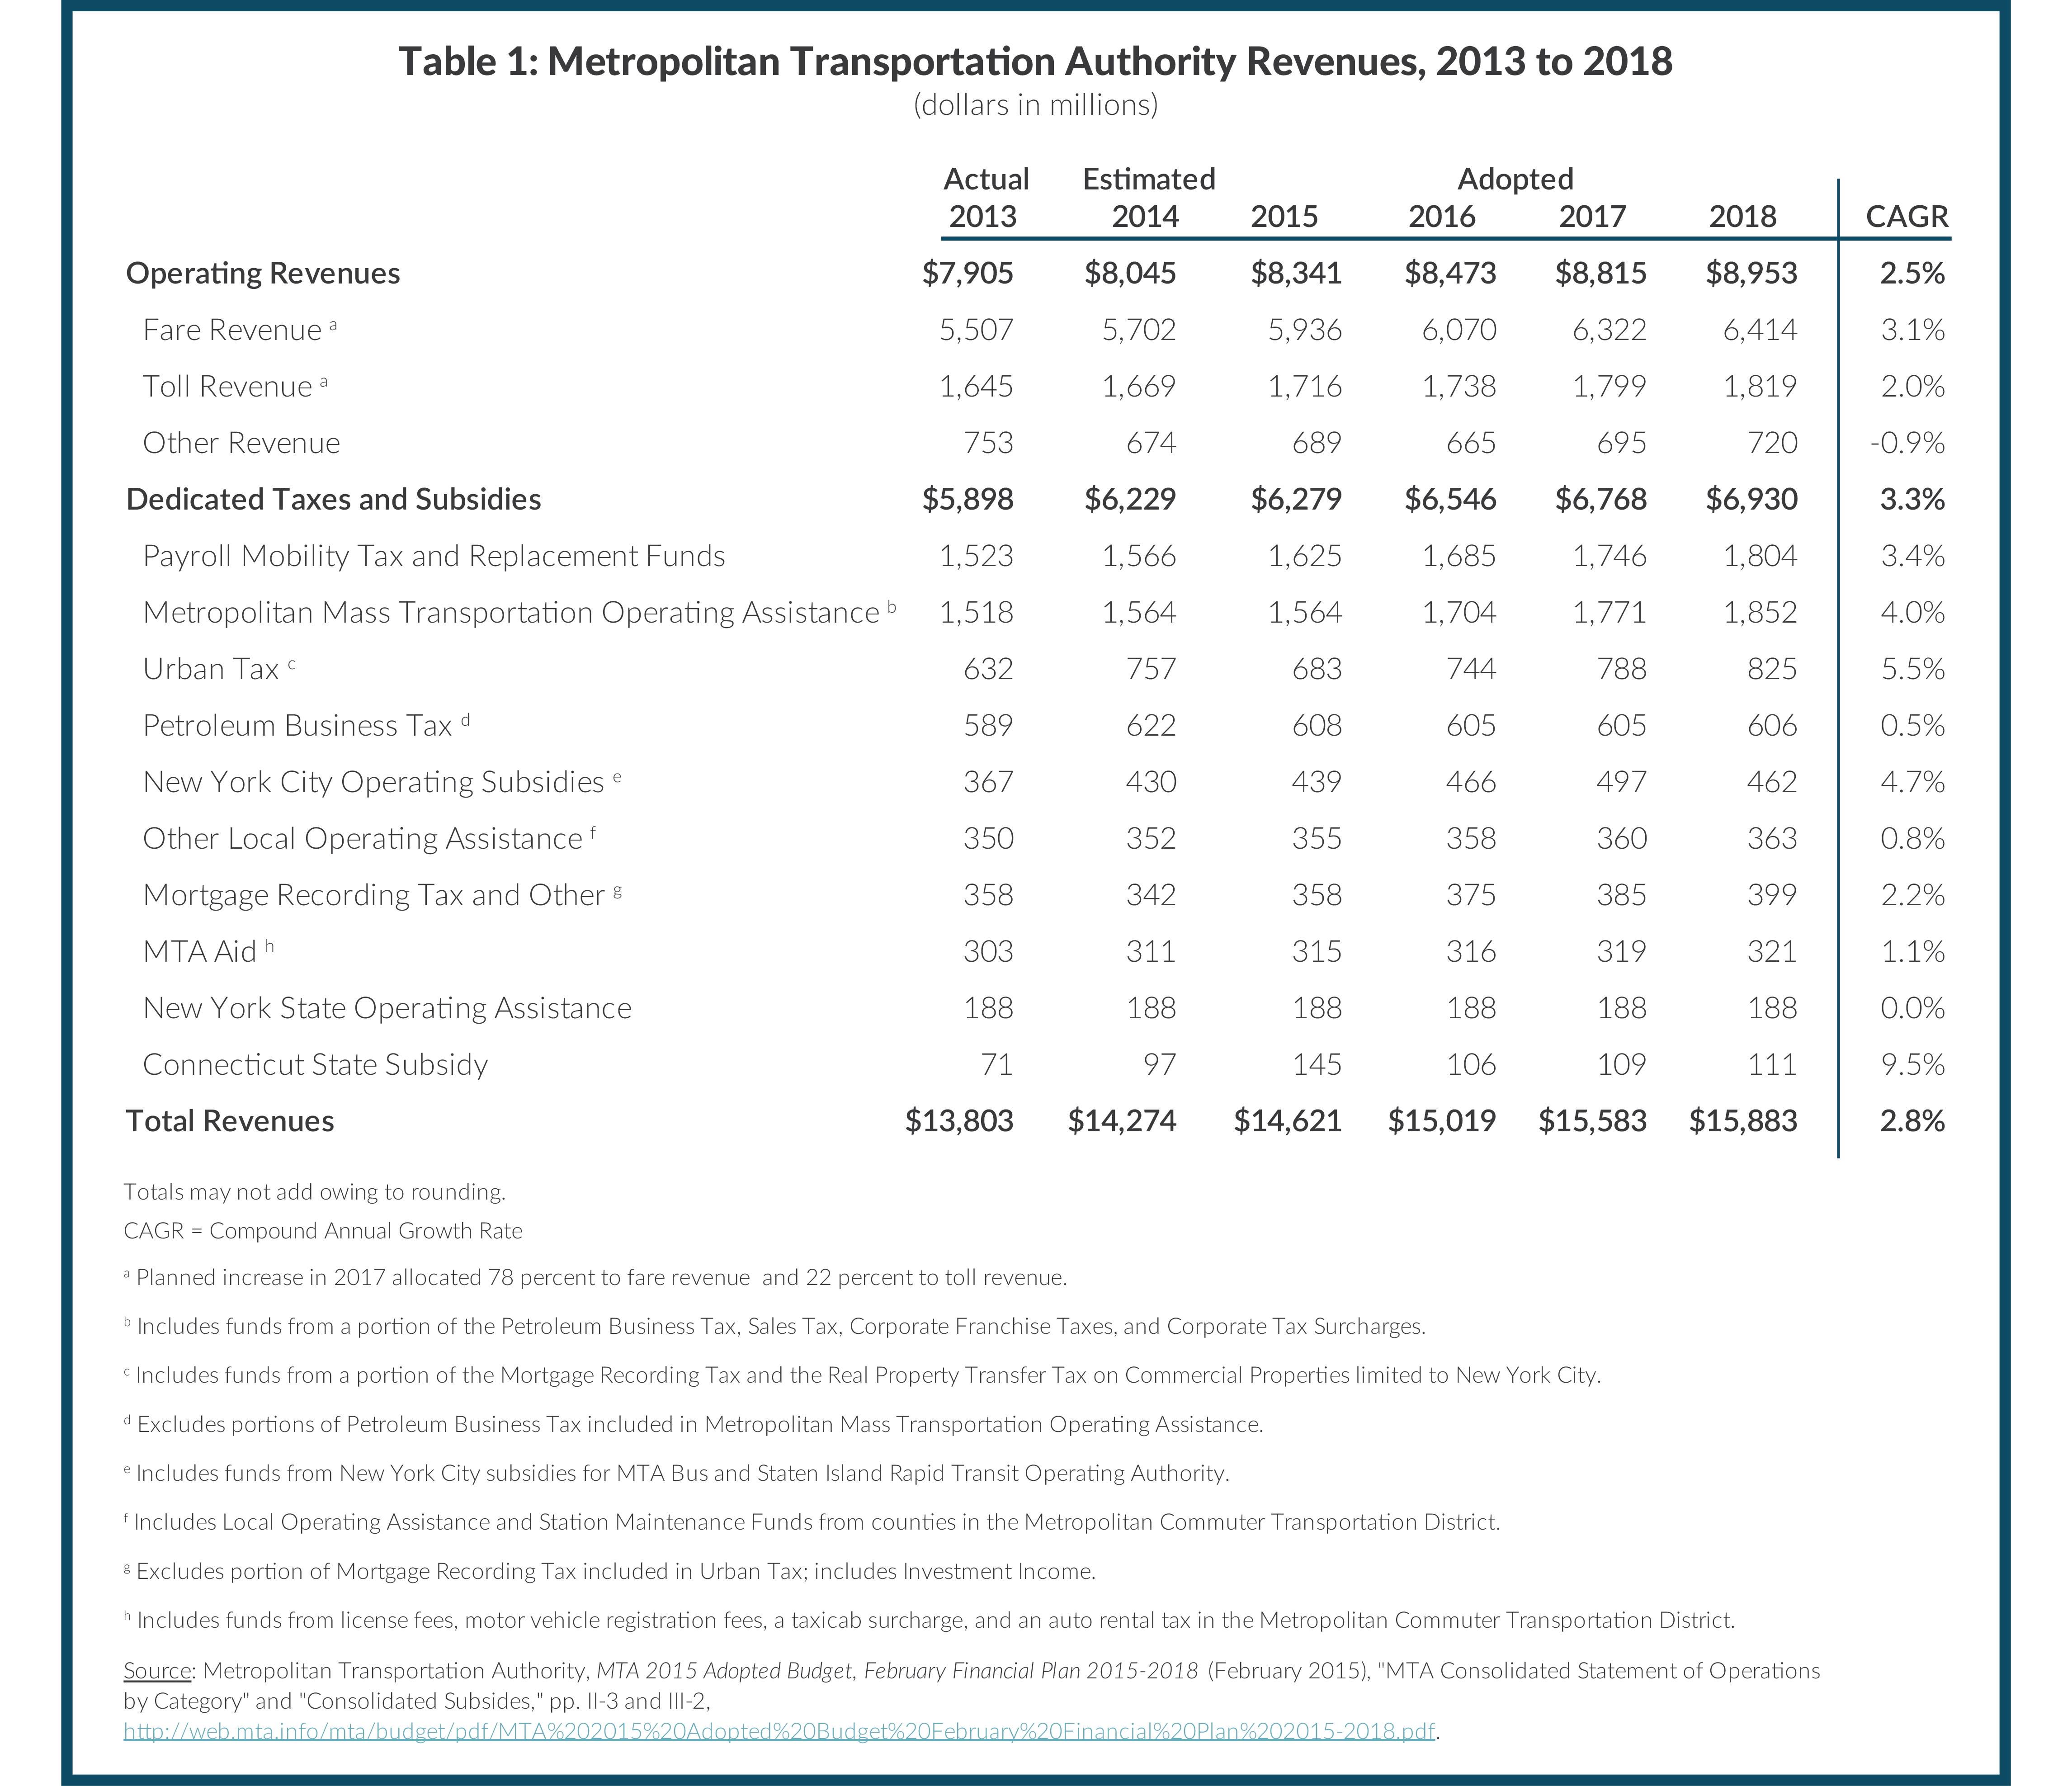
Over the financial plan, annual revenue is projected to grow to $15.9 billion, an average annual rate of 2.8 percent. Increases in fare revenue average 3.1 percent annually reflecting increased ridership, a recently enacted fare increase of 4 percent in March 2015, and a planned 4 percent fare increase in March 2017.3 Toll revenue growth averages 2.0 percent annually, reflecting similar increases in charges but a lower volume of traffic.
Dedicated taxes and subsidies are projected to increase an average of 3.3 percent annually to exceed $6.9 billion in 2018. The current single largest dedicated tax is the Payroll Mobility Tax (PMT), a levy on wages paid by most employers in the region that is expected to grow an average of 3.4 percent annually. Metropolitan Mass Transportation Operating Assistance (MMTOA) is a set of dedicated taxes including a sales tax, corporate taxes, and a portion of the Petroleum Business Tax levied on businesses importing petroleum to the state for motor fuels and other uses; the MMTOA is expected to increase an average of 4.0 percent annually and to exceed the PMT beginning in 2016. Dedicated taxes linked to real estate transactions, which include Urban Tax and Mortgage Recording Tax categories are expected to increase an average of 5.5 percent and 2.2 percent annually, respectively. Subsidies appropriated by local and state governments are expected to grow more slowly with the exception of the Connecticut State Subsidy, which is expected to grow from $71 million in 2013 to $111 million in 2018.
Recurring Spending Needs
The MTA is expected to have spent nearly $14.0 billion on operations in 2014; roughly half of this amount supports New York City Transit subways and buses, and 20 percent supports the commuter railroads: the Long Island Rail Road (LIRR) and Metro-North Railroad (MNR). Debt service accounts for 16 percent of total costs with the remainder split among the MTA Bus Company (4 percent), headquarters (3 percent), and bridges and tunnels (3 percent).4 About 61 percent of the MTA’s 2014 budget is dedicated to labor costs, 16 percent for debt service, and 23 percent for other non-labor items. (See Table 2.)
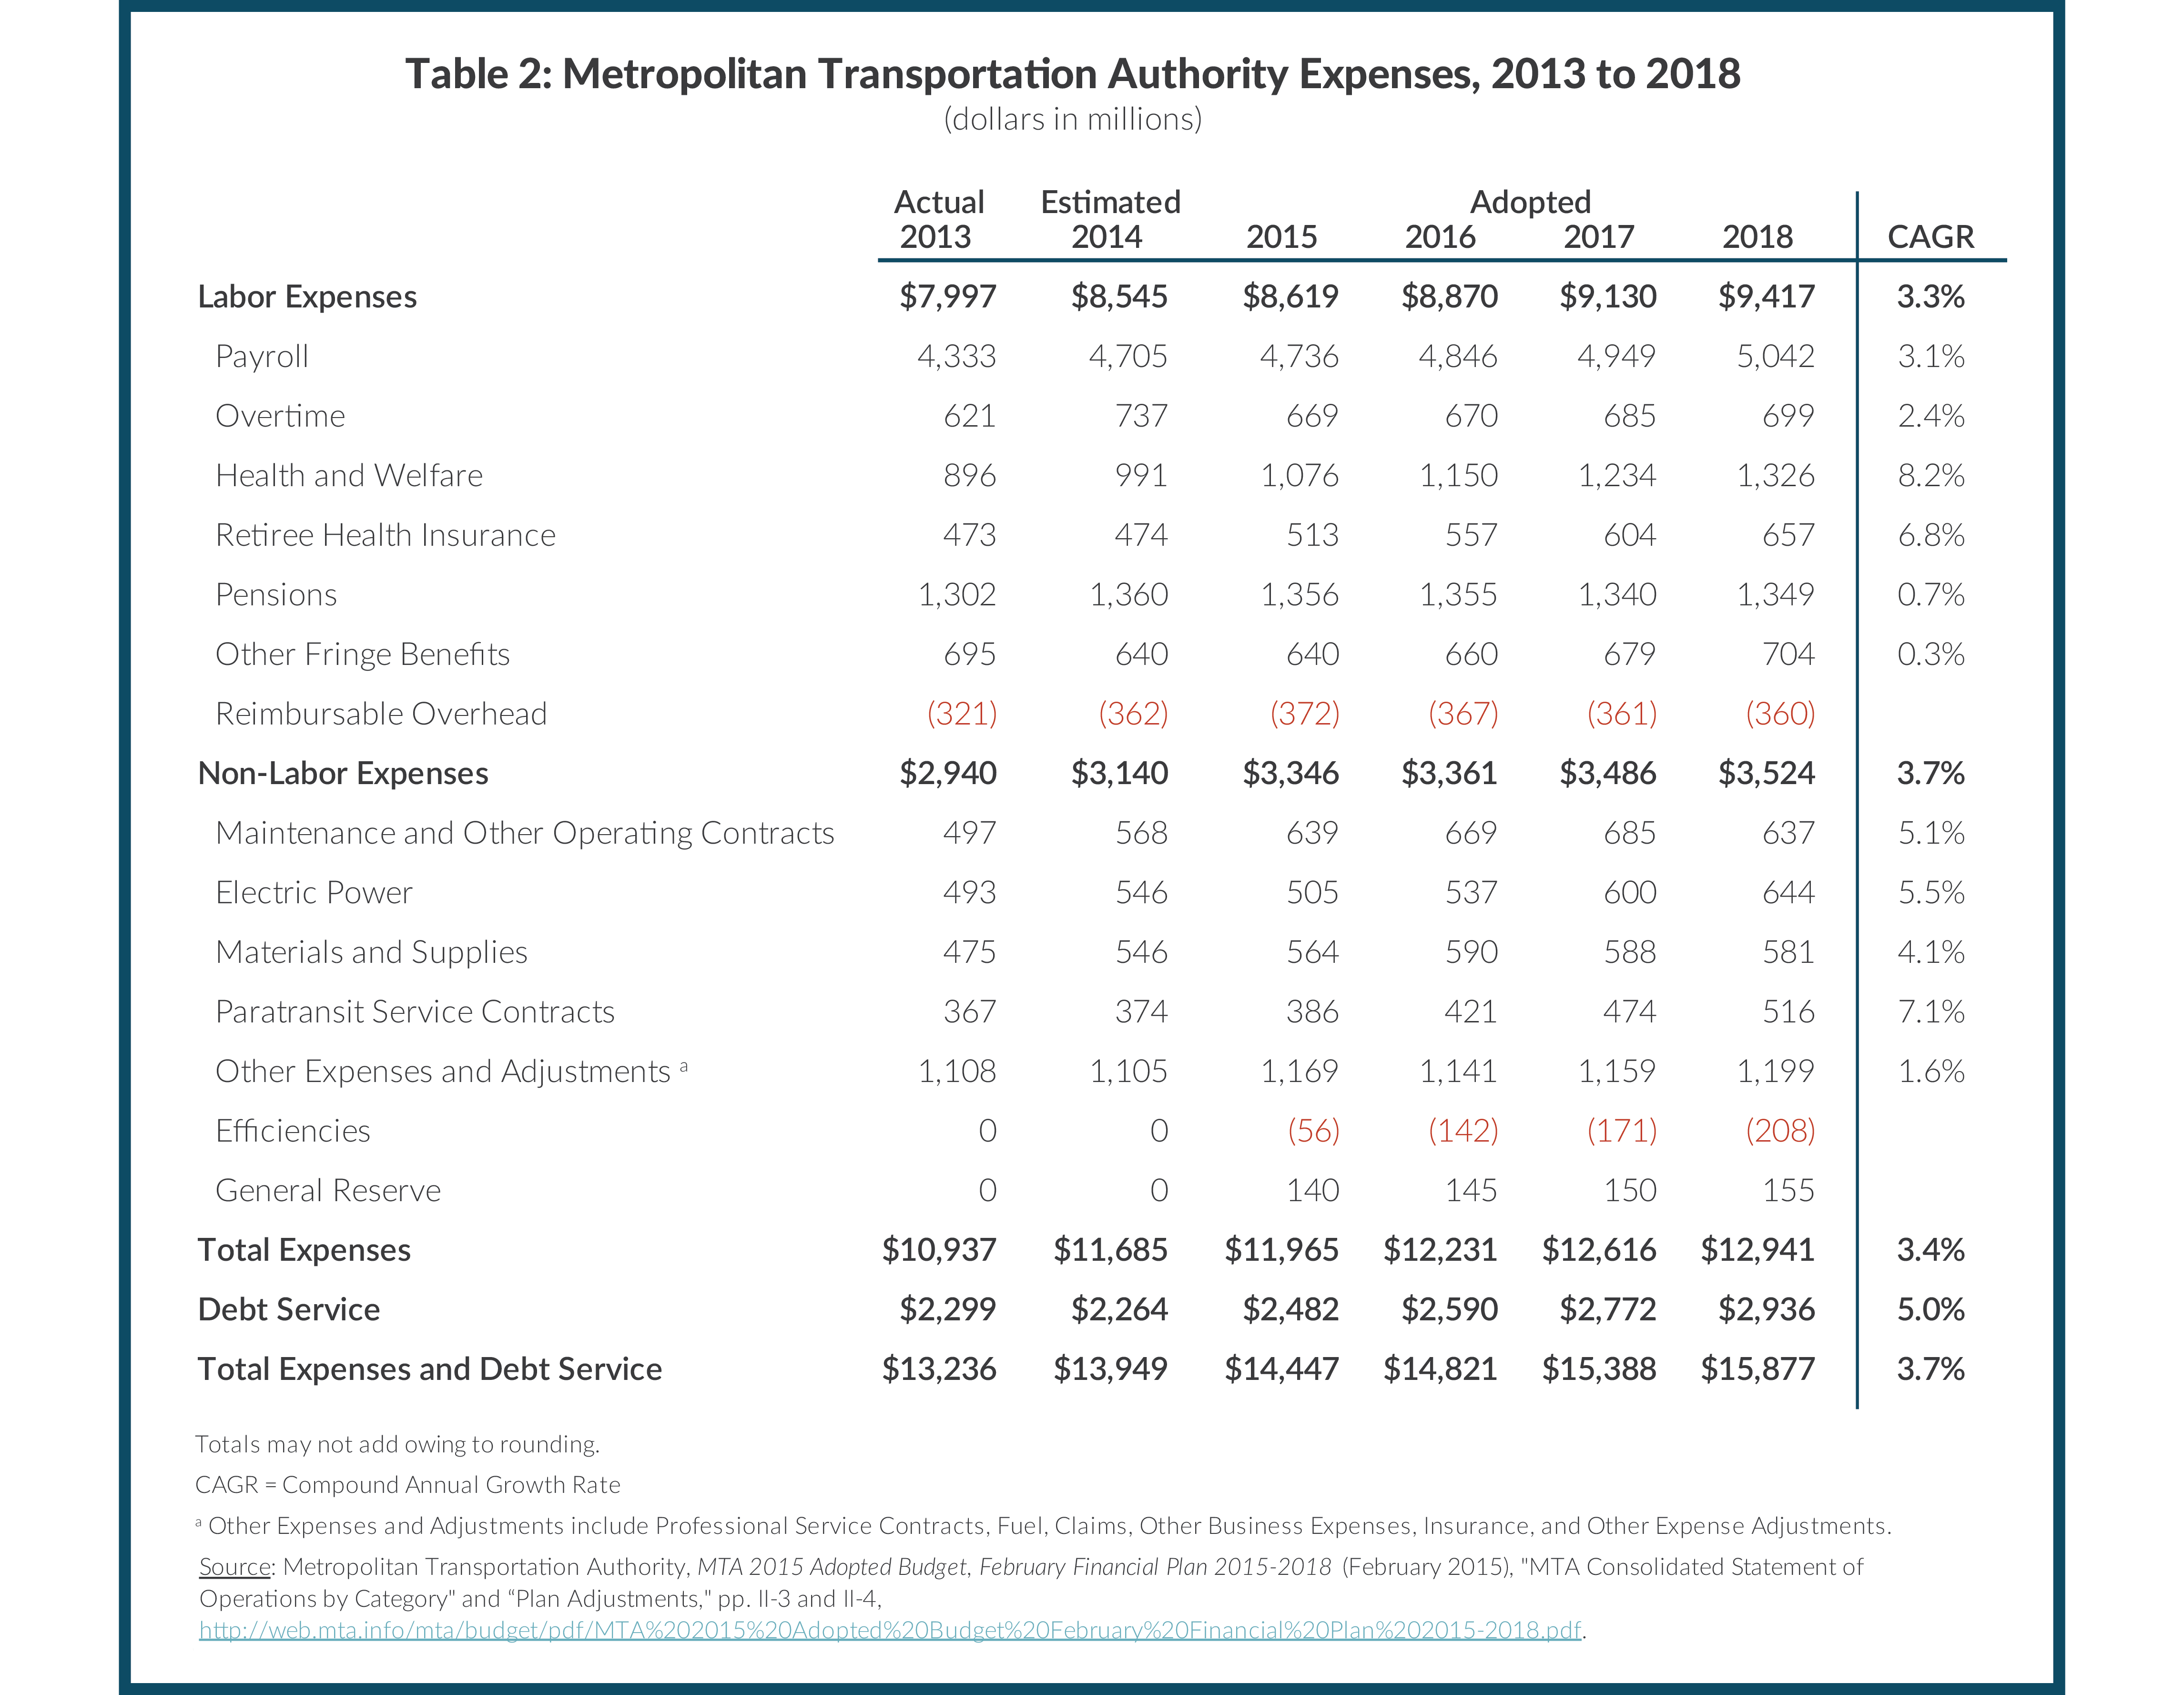
Labor costs are expected to increase at an average annual rate of 3.3 percent. This category is split between payroll and benefits, including health insurance, pensions, and other fringe benefits. Direct payroll is expected to be $4.7 billion in 2014, growing to $5.0 billion by 2018. The growth in payroll cost is driven by collective bargaining agreements settled in 2014. The agreement with the largest union, the Transit Workers Union (TWU), spans the period from 2012 to 2017 with retroactive raises paid in 2014 and future increases of 2 percent annually accompanied by a modest increase (one-half of one percent of base wages) in workers’ contributions to health insurance premium costs. The agreement with the LIRR workers spans the period from 2010 to 2016, and also includes retroactive payments in 2014 and future raises of 1.5 percent annually accompanied by a phased-in increase in employees contributions to health insurance premiums. Total headcount is planned to remain nearly stable from 2014 to 2018, increasing by 36 positions to 69,061.5
Benefits consist of pension fund contributions for current workers, health insurance premium payments for current workers, and health insurance premium payments for retired workers. The pension fund contributions are projected to decline modestly from a 2014 peak; in addition to recent strong investment performance, the future contribution requirements are lowered by a budgeted payment in 2014 to reduce outstanding pension fund liabilities.6 Health insurance premium payments are projected to rise an average 8.2 percent annually for current employees and 6.8 percent for retirees.
Non-labor expenses are expected to be $3.1 billion in 2014 and are projected to grow at an average annual rate of 3.7 percent to $3.5 billion in 2018. Large and rapidly growing items in this category include Electric Power, which is expected to cost $546 million in 2014 and grow to $644 million by 2018, and Paratransit Service Contracts, which is expected to cost $374 million in 2014 and grow to $516 million in 2018.
Also notable among planned expenses are a negative item, Efficiencies, initiatives the MTA plans in order to reduce spending without reducing services. These efficiencies yield expected savings starting at $56 million in 2015 and growing to $208 million in 2018.7
The remaining major expense item is debt service. At the end of September 2014 the agency had more than $34.6 billion in long-term debt.8 The amounts budgeted cover debt service on the outstanding debt plus new debt expected to be issued to finance obligations from the 2010-2014 capital plan. Debt service payments increase an average of 5.0 percent annually from $2.3 billion in 2014 to $2.9 billion by 2018.
The Bottom Line
Total revenues are larger than total expenses including debt service in each year in the financial plan; however, the surpluses fall from $567 million in 2013 and $325 million in 2014 to $6 million in 2018. Moreover, in its financial plan the MTA makes adjustments to these surpluses to take into account its planned uses of the funds and to adjust from an accrual to a cash basis of accounting. For example in 2013 and 2014 some of the surplus funds were allocated to reduce outstanding pension liabilities and to fund a reserve to cover future retiree health insurance costs; these items lowered the surplus by $296 million in 2013 and $101 million in 2014. (See Table 3.) The MTA also allocates a portion of surplus funds to current and future capital plans. Commitments related to the 2010-2014 capital plan total $551 million over the 2013-2018 period and commitments related to the 2015-2019 capital plan are $290 million annually for a total of $1,160 million over the 2015-2018 period. These uses of the surplus and other cash adjustments turn the agency’s annual surpluses to reported cash deficits in 2014, 2015, 2017, and 2018.
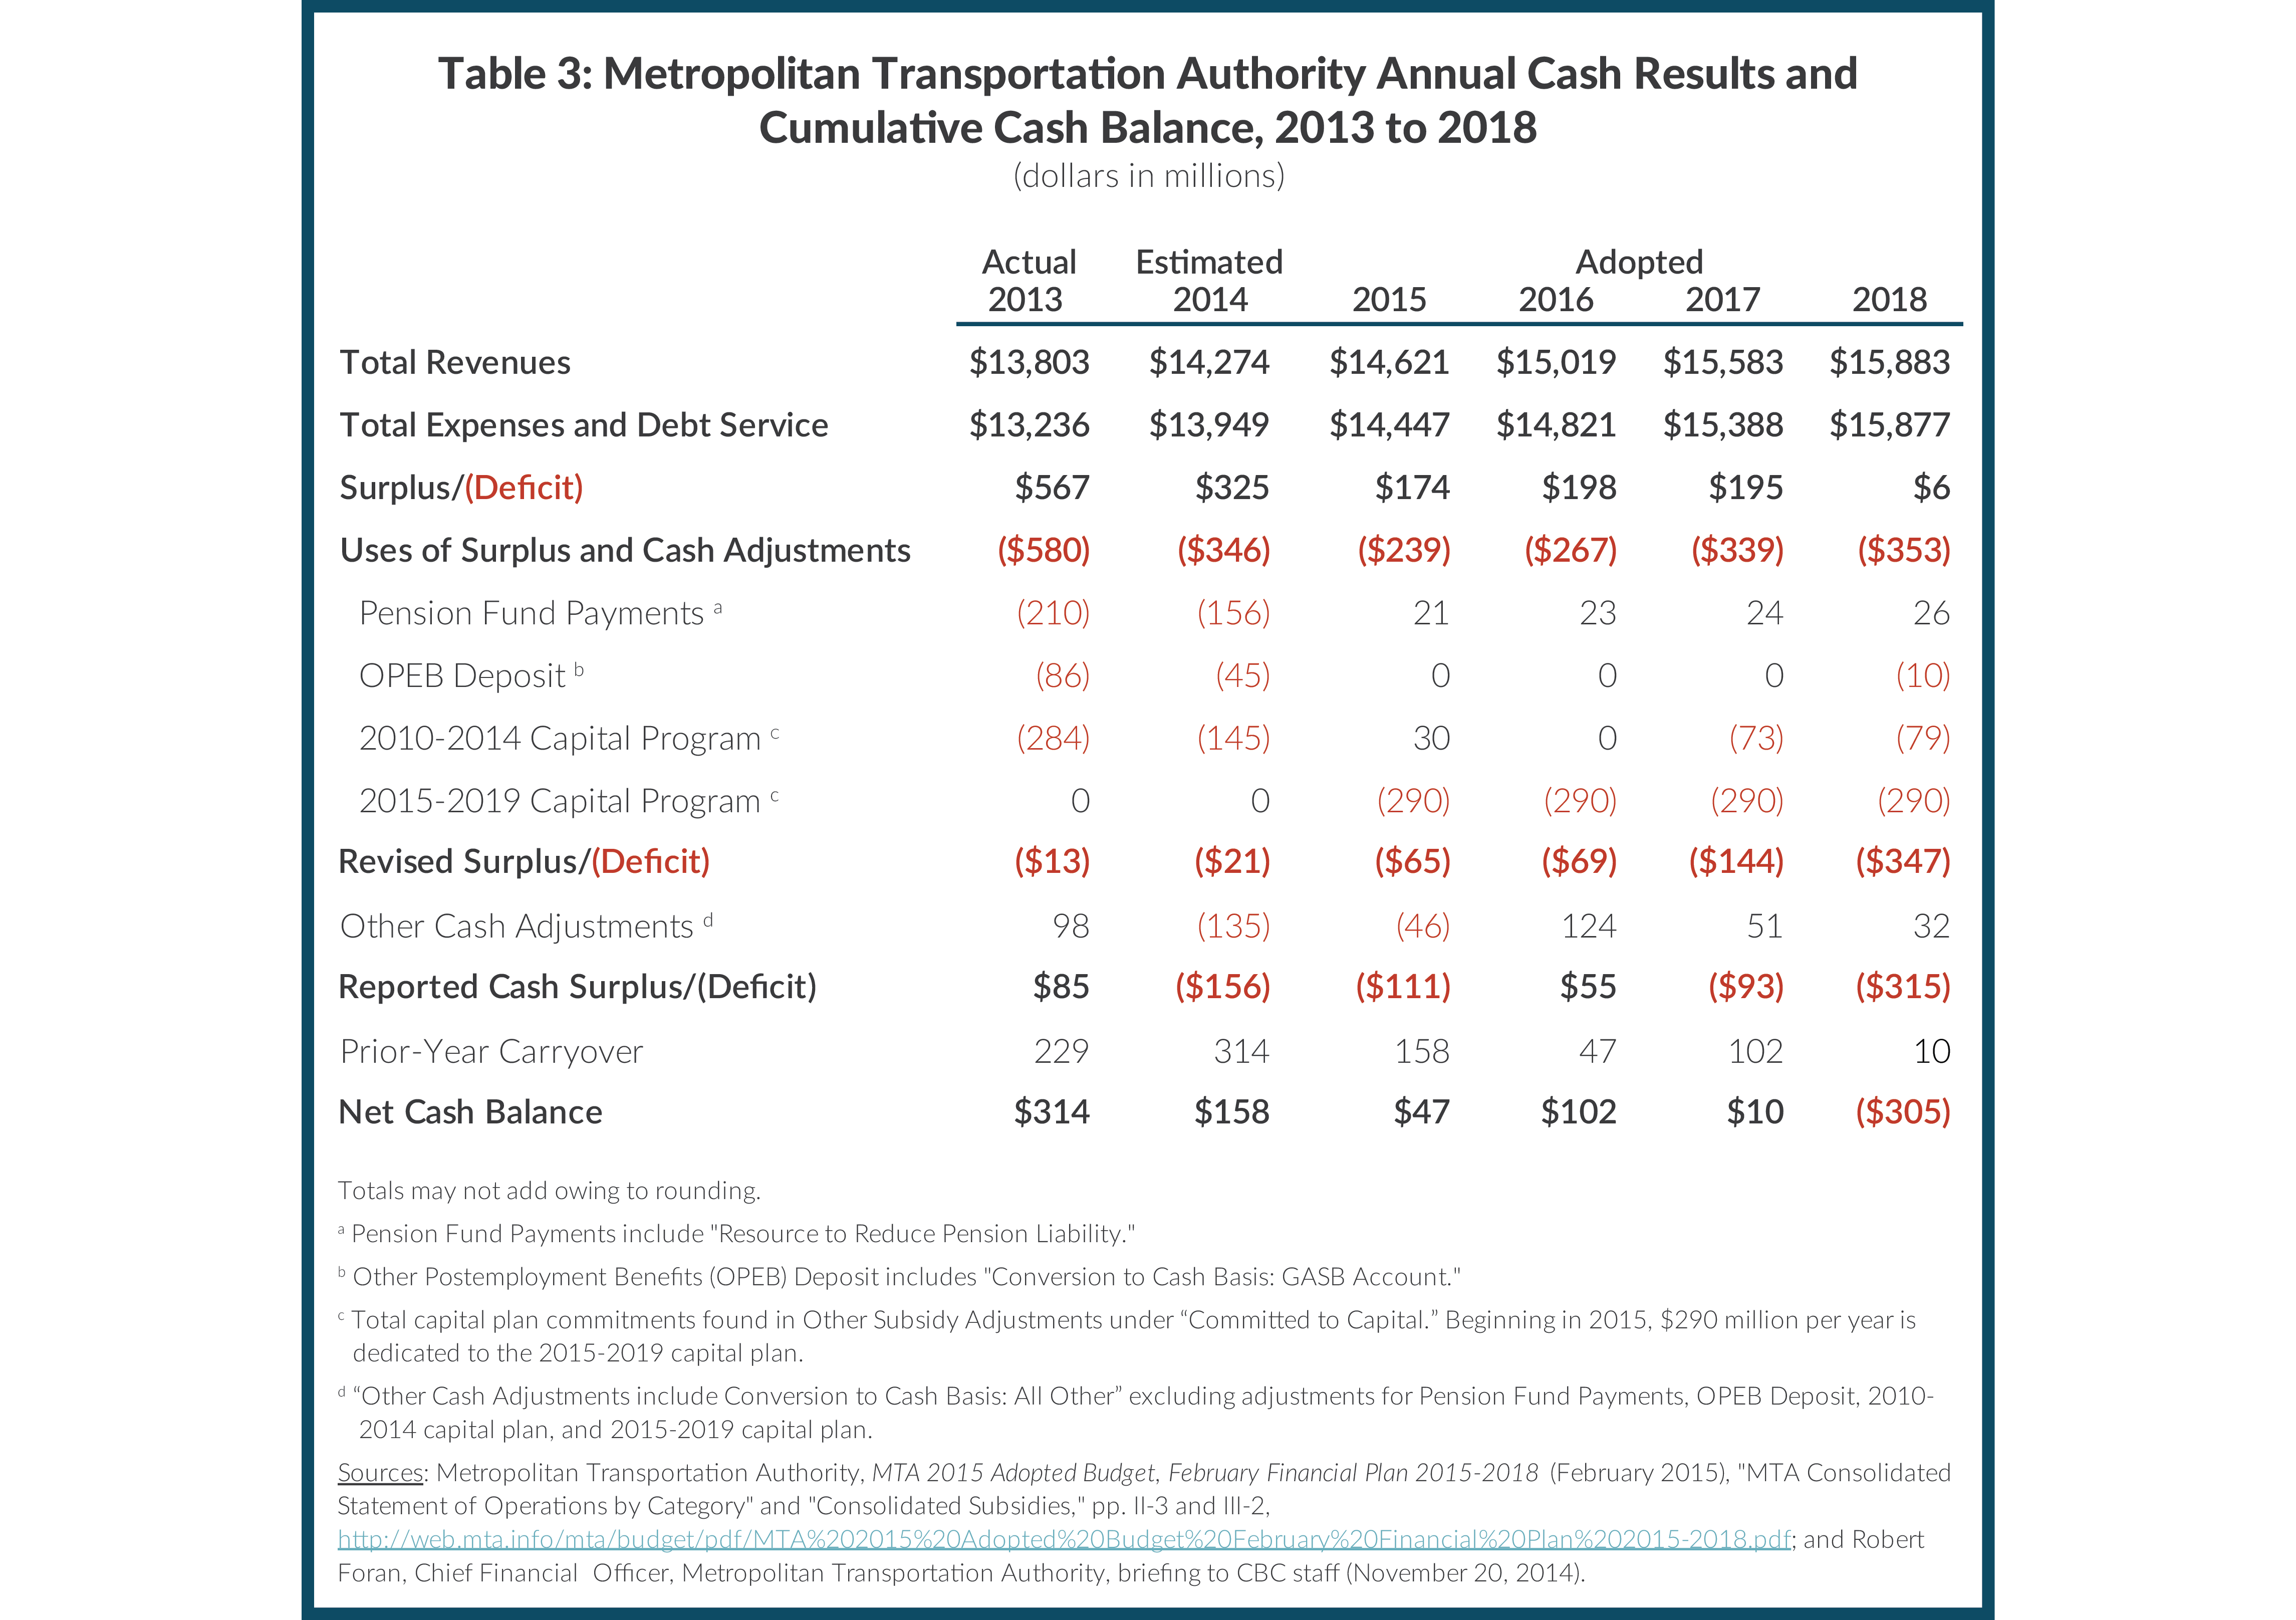
The MTA offsets these reported cash deficits by drawing on its accumulated cash reserves. These reserves were $229 million at the start of 2013 and grew to $314 million at the start of 2014, but are projected to fall to $10 million at the end of 2017, and the financial plan anticipates a negative cash balance of $305 million at the end of 2018.
The reported annual cash deficits and the sizeable negative cash balance at the end of 2018 indicate the planned uses of the surplus funds—notably the $290 million annual commitment to the 2015-2019 capital plan—are not sustainable. That is, beginning in 2018 the MTA will need additional resources to sustain the planned commitments to the new capital plan.
The expected results in the later years of the financial plan period may be even less favorable than projected because of risks to the plan’s projections. Budgeted Efficiencies, some of which are not yet identified, may not be achieved, and the anticipated revenue growth depends on continued regional economic growth uninterrupted by a recession in the next four years.
Future Capital Needs
In 1982, at the nadir of the MTA system’s condition, the agency adopted a new process for capital planning and implementation. This system uses five-year capital plans to identify, prioritize, and fund investments. These plans, excluding those for the Authority’s Bridges and Tunnels program, must be approved by the MTA Board and the Capital Program Review Board (CPRB), comprised of representatives of the Governor, the Mayor of New York City, and the majority leaders of the State Senate and Assembly. While the plan itself is not reviewed by the legislature, any state funding provisions included in the plan—such as new dedicated taxes or increased borrowing authority—require legislative approval.
The MTA is currently implementing its approved 2010-2014 Capital Plan.9 The total cost of this plan is $34.8 billion and includes $16.1 billion in core projects for New York City Transit (NYCT), Long Island Rail Road (LIRR), and Metro-North Railroad (MNR); $2.1 billion for bridges and tunnels; and $10.5 billion for repair and mitigation projects in response to Superstorm Sandy. The plan also provides $5.9 billion for continued work on expansion projects including East Side Access ($3.2 billion) and the first phase of the Second Avenue Subway ($1.5 billion).10
In October 2013 the MTA completed its needs assessment for the upcoming capital plan period. The document covers the years 2015 through 2034 and identifies $106 billion in total needs, including $26.6 billion (in constant 2012 dollars) to be addressed in the years 2015 through 2019.11
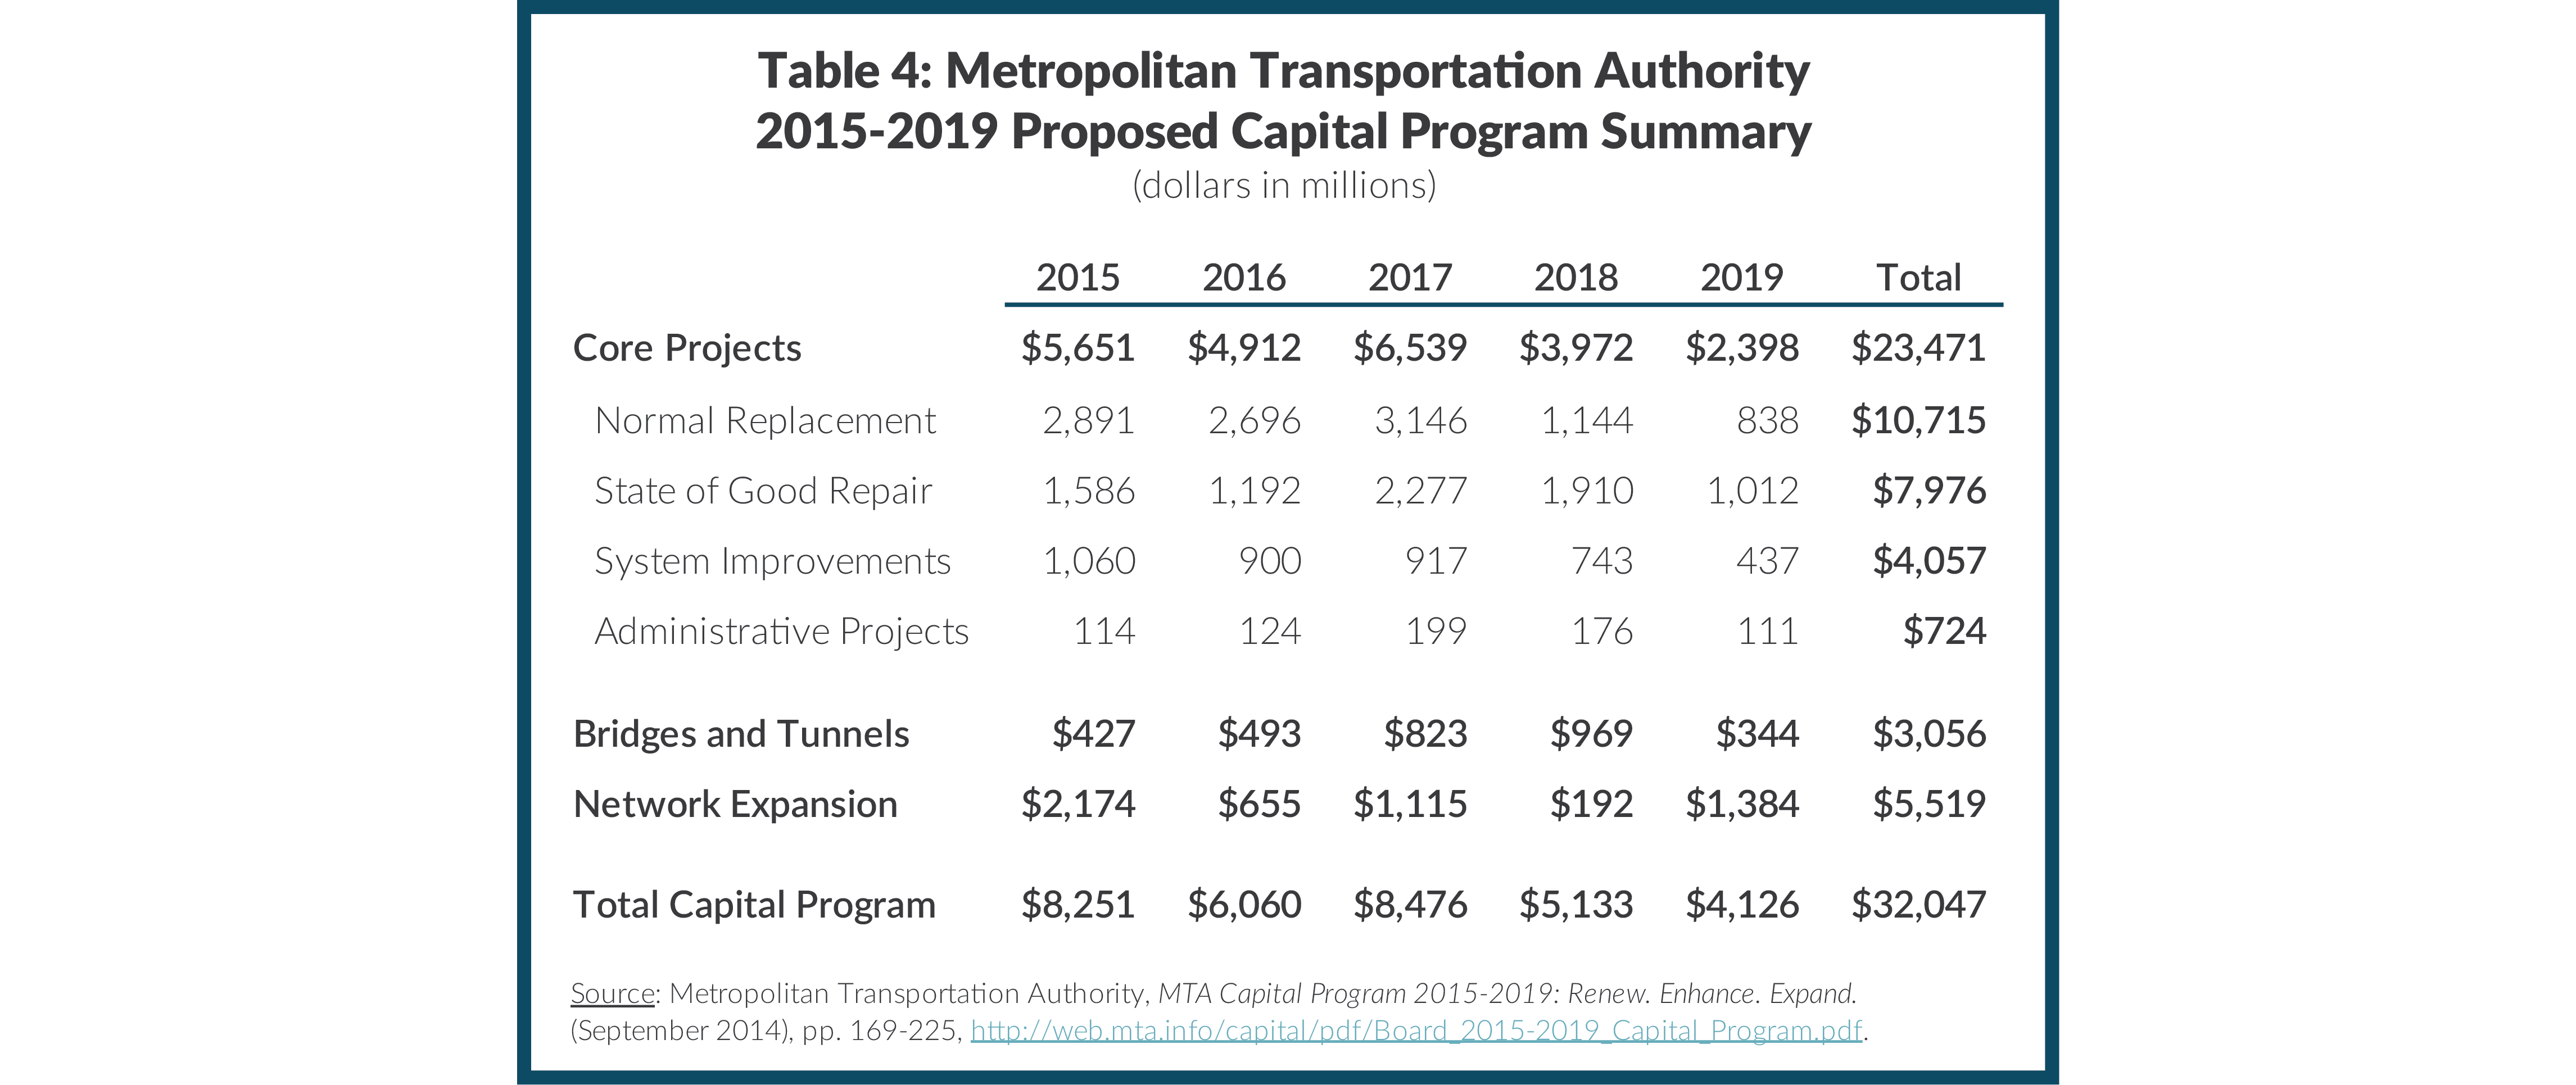
In September 2014 the MTA proposed a capital plan for 2015 through 2019 with commitments totaling $32 billion in current dollars. The plan included $10.7 billion for normal replacement of assets such as rolling stock and buses, $8.0 billion to bring portions of the system to a state of good repair (SGR), $4.1 billion for system improvements such as enhanced signaling systems, and less than $1 billion for Administrative Projects. (See Table 4.) Another $5.5 billion is allocated for Network Expansions including East Side Access ($2.8 billion), the start of the second phase of the Second Avenue Subway ($1.5 billion), and $743 million to start Penn Station Access, a project that will build four new MNR stations in the Bronx and allow the commuter railroad to serve Penn Station in Manhattan. Also $3.1 billion is dedicated to Bridges and Tunnels projects.
In October 2014 the Governor’s representative on the CPRB, the State Transportation Commissioner, Joan McDonald, vetoed the plan. The veto was “without prejudice to any particular element or project that is contained in the proposal.”12
The MTA proposal has been criticized in two ways. CBC has questioned its priorities, arguing the plan ought to prioritize SGR projects and defer expansion projects until the agency develops a better planning process and improved capacity to implement large-scale projects.13 Others, including Governor Andrew Cuomo, have asserted the plan is “bloated,” implying it includes low-priority items.14
Adjusting the plan in response to CBC’s criticisms does not necessarily mean lowering its spending level. A plan of the same size can shift funds for expansion projects to SGR and signal improvements. In contrast, responding to the “bloated” argument implies reduced commitment levels. Based on this logic, it is possible to identify two scenarios for the 2015-2019 plan. First, the spending level is maintained at the proposed or “baseline” level of $32.0 billion and allocated either in accord with the MTA proposal or in accord with the CBC’s recommended priorities. Second, spending is reduced. A plausible version of such cuts includes the elimination of new expansion projects (but retention of the money needed to complete East Side Access as it represents an ongoing project, not a new expansion) to save $2.7 billion, yielding a revised plan totaling $29.3 billion versus the baseline $32.0 billion.15
Incremental Funding Needs
How much additional money is needed to fund either of the two scenarios? The MTA’s initial proposal shows $16.9 billion available from identifiable sources in next five years. (See Table 5.) This includes $12.1 billion from sources that appear to be reasonably estimated and $4.8 billion from more questionable sources.
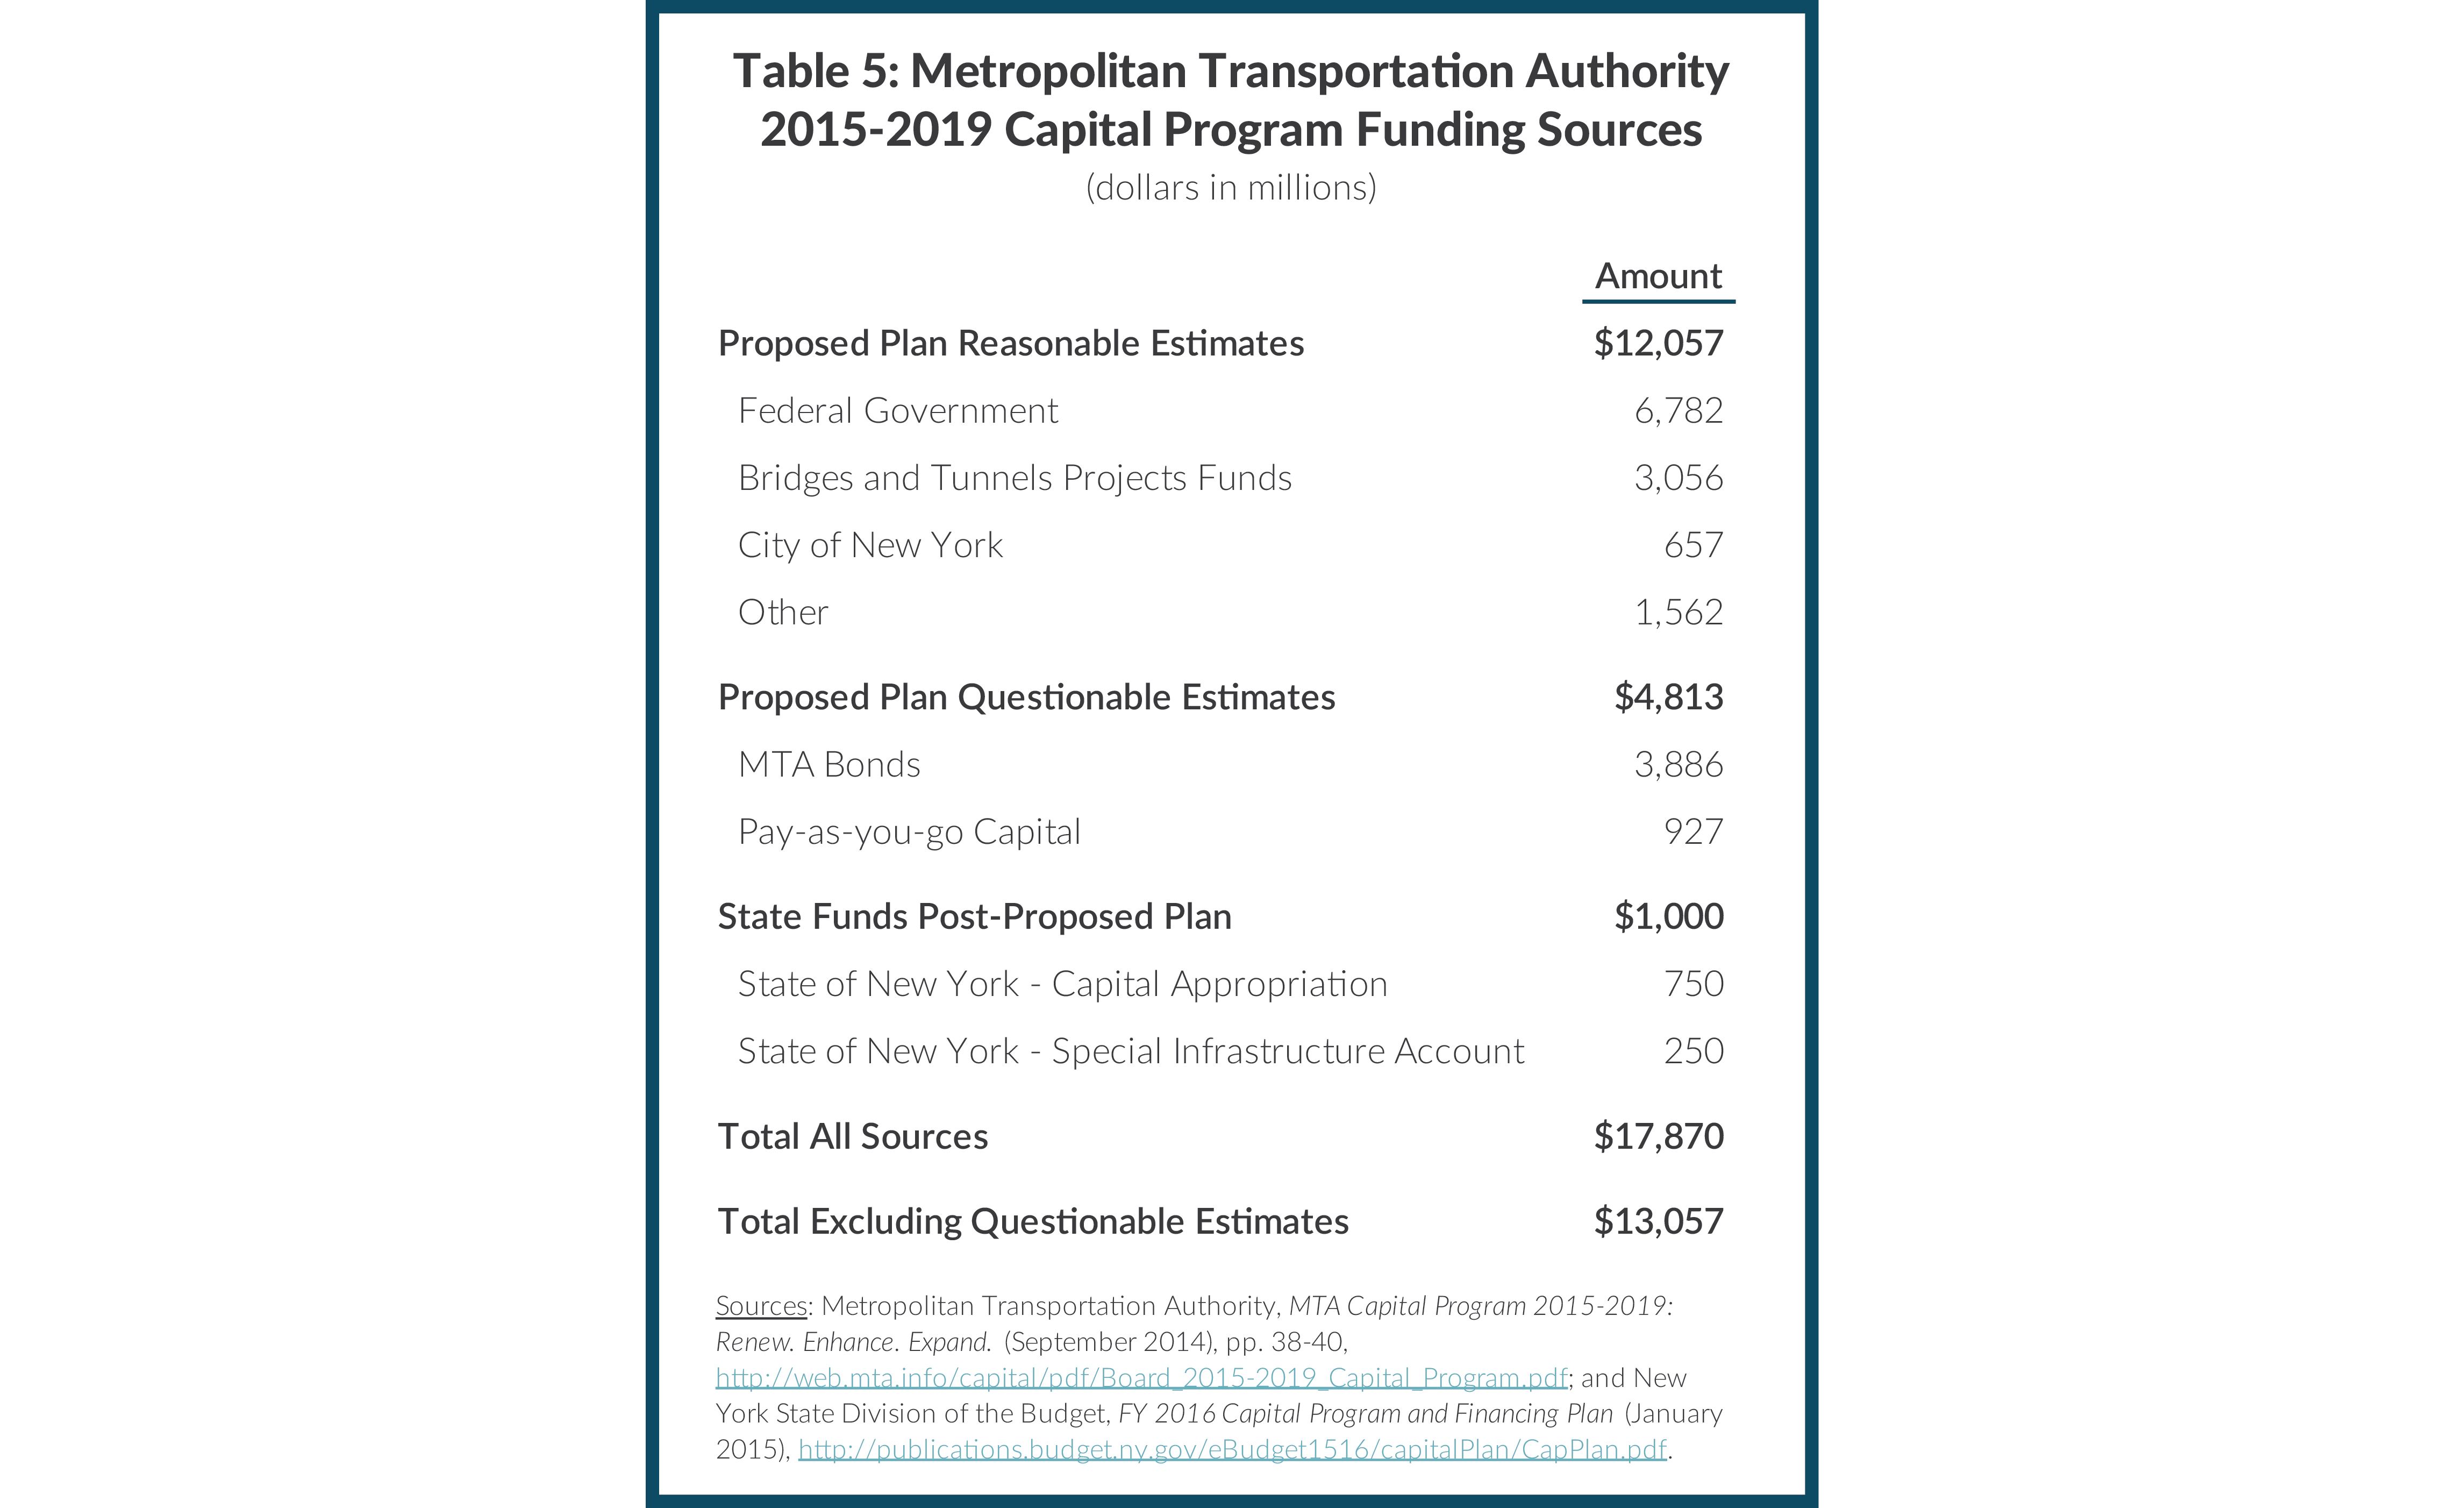
Among the realistic estimates is $3.1 billion for Bridges and Tunnels projects. These projects will be funded primarily with bonds backed by toll revenue, the practice established in previous capital plans. For the mass transit investments the largest source ($6.8 billion) is the federal government, which has provided capital grants in the past and can reasonably be expected to continue this level of funding, although reauthorization of the relevant federal programs is pending Congressional action. The City of New York is expected to provide $657 million in capital support; this assumption counts on an increase of $125 million over the previous plan. The agency expects to raise an additional $1.6 billion from other sources including asset sales and leases and private developer-funded investments.16
The MTA plan indicates the agency can raise another $4.8 billion from internally generated resources. This reflects the $290 million allocated annually for the 2015-2019 plan beginning in its 2015 financial plan.17 (Refer to Table 3 above.) Based on current market conditions, $290 million can support the annual debt service on $3.9 billion in bonds. Since the debt is issued over a multiyear time frame, the full $290 million is not needed for debt service until after 2018, leaving the balance to support pay-as-you-go (PAYGO) capital totaling $927 million. However, it is reasonable to question whether the MTA can sustain a $290 million annual contribution to the capital plan. As noted earlier, this commitment creates cash deficits in the financial plan in the next four years, and cash reserves will be exhausted under the plan by 2018. New, as yet unidentified, revenue would be needed to sustain the annual capital commitment and support the $4.8 billion.
Subsequent to the MTA’s proposed capital plan’s release, Governor Cuomo included in his Executive Budget two sources of state capital funding for the MTA’s capital program totaling $1 billion. One source is $750 million in state-supported bonds for the core capital program. This sum is $20 million less than the State dedicated to the MTA’s last capital plan. The Governor also proposed an additional $250 million from a newly created Special Infrastructure Account—funded through one-time financial settlements—earmarked to support the Penn Station Access expansion project.18 It is reasonable to assume this funding will be approved by the legislature.
If all identified sources are included, the available amount totals $17.9 billion. However, if the questionable sum from internally generated sources is excluded, the available total is a lower $13.1 billion. Using the smaller, but more realistic figure, the gap between available resources and planned investments is $19.0 billion under the baseline scenario. The gap under the lower-level scenario depends on whether the Governor and the legislature provide the additional $250 million even if the earmarked Penn Station Access expansion project is not included in the plan. For this analysis, it is assumed the $250 million would be withdrawn if the project is not included, and the funding gap for the lower-level scenario is $16.5 billion. Absent additional federal, state, or local capital contributions, which the MTA will continue to pursue, these sums ($19.0 billion and $16.5 billion) likely would be borrowed. The necessary but unpleasant question accompanying such borrowing: what is the size of the added debt service?
Additional Debt Service Requirements
Paying for capital projects with debt financing involves five steps—capital plan authorization, contract commitments, contractor payments, issuance of bonds to fund contractor payments or in-house costs, and payment of debt service on the bonds. The first two steps require no cash outlays; the next two steps rely on bond proceeds for projects not funded by third-party sources such as federal contributions; only the final step of debt service payment requires cash disbursements from the MTA when debt financing is planned for these projects.
Projects authorized in the 2015-2019 capital plan will generate contract commitments over that five-year period.19 Commitments not covered by third-party funding sources or MTA resources will require vendor payments funded through bond issuances. On an aggregate, program-wide basis, the MTA assumes annual contract awards lead to cash payments over a seven-year period.20 Bonds are issued to cover these cash payments. Debt service on the bonds extends over a 30-year period. Under the baseline scenario, debt service increases from $12 million in 2015 to $1.2 billion annually from 2025 to 2044 and declines beginning in 2045 before ending in 2054. (See Figure 1.) The lower-cost scenario’s debt service costs grow from $10 million to $1.0 billion annually through 2045.
Under these assumptions, the MTA would need to generate new revenue to make the incremental debt service payments. New revenue requirements under the baseline assumption would rise over seven years to reach a recurring annual amount of nearly $1.2 billion beginning in 2025; the equivalent sum under the low level scenario is $1.0 billion annually.

From Where Should the New Money Come?
An appropriate framework for answering this question is provided by guidelines previously recommended by CBC. The 2012 report, A Better Way to Pay for the MTA, suggests a formula—referred to as “50-25-25”—that allocates the costs of transportation services among three categories of revenue and the sectors of the public from which they each derive. The guidelines are designed to lead to an equitable, efficient, and easily understood basis for funding the MTA.
- Mass transit users should pay fares sufficient to cover half of the operating costs of those services. Mass transit provides direct benefits to riders, and they should bear a significant share of the cost of the service.
- The cost of road infrastructure—bridges and tunnels—ought to be borne entirely by motorists. Vehicle owners and drivers receive direct benefits from the use of public roads, and they should pay for the service in a way related to use.
- User fees paid by motorists should also generate a surplus large enough to cover a quarter of the cost of mass transit services. Motorists should help compensate for the negative externalities of vehicle use through tolls and through other indirect charges such as fuel taxes and vehicle license and registration fees.
- State and local subsidies to mass transit should cover a quarter of the operating costs and also fund “catch up” capital investments needed to bring the system to a state of good repair (SGR). Mass transit services are a public good benefiting many more people than just riders by creating a more efficient labor market and generating fewer negative externalities than motor vehicle use. The tax subsidy reflects the broad economic benefits of mass transit and the costs associated with restoring the system to SGR due to inadequate public funding in the past.
Download Previous Work
A Better Way to Pay for the MTACBC Guidelines and MTA Practices
How well do the MTA’s financing practices fit these guidelines? The second guideline is adhered to through the tolls on MTA bridges and tunnels, which more than cover their operating costs. However, the financing of the MTA’s mass transit services deviate notably from the guidelines.
According to the MTA’s plan, it will require $14.6 billion in cash in 2018 for all non-Bridges and Tunnels operating and debt service disbursements. (See Table 6.) Of this sum, the MTA plans to raise $7.1 billion, or 49 percent, in fares and other earned income and $5.9 billion, or 40 percent, in general tax subsidies from state and local governments. The last portion, vehicle cross-subsidies, is expected to yield $1.6 billion, or 11 percent, from the MTA’s bridges and tunnels surplus and dedicated taxes and subsidies derived from motor vehicle users either through fuel taxes or motor vehicle fees. The MTA’s plan would also yield a $25 million cash deficit for transit operations in 2018.
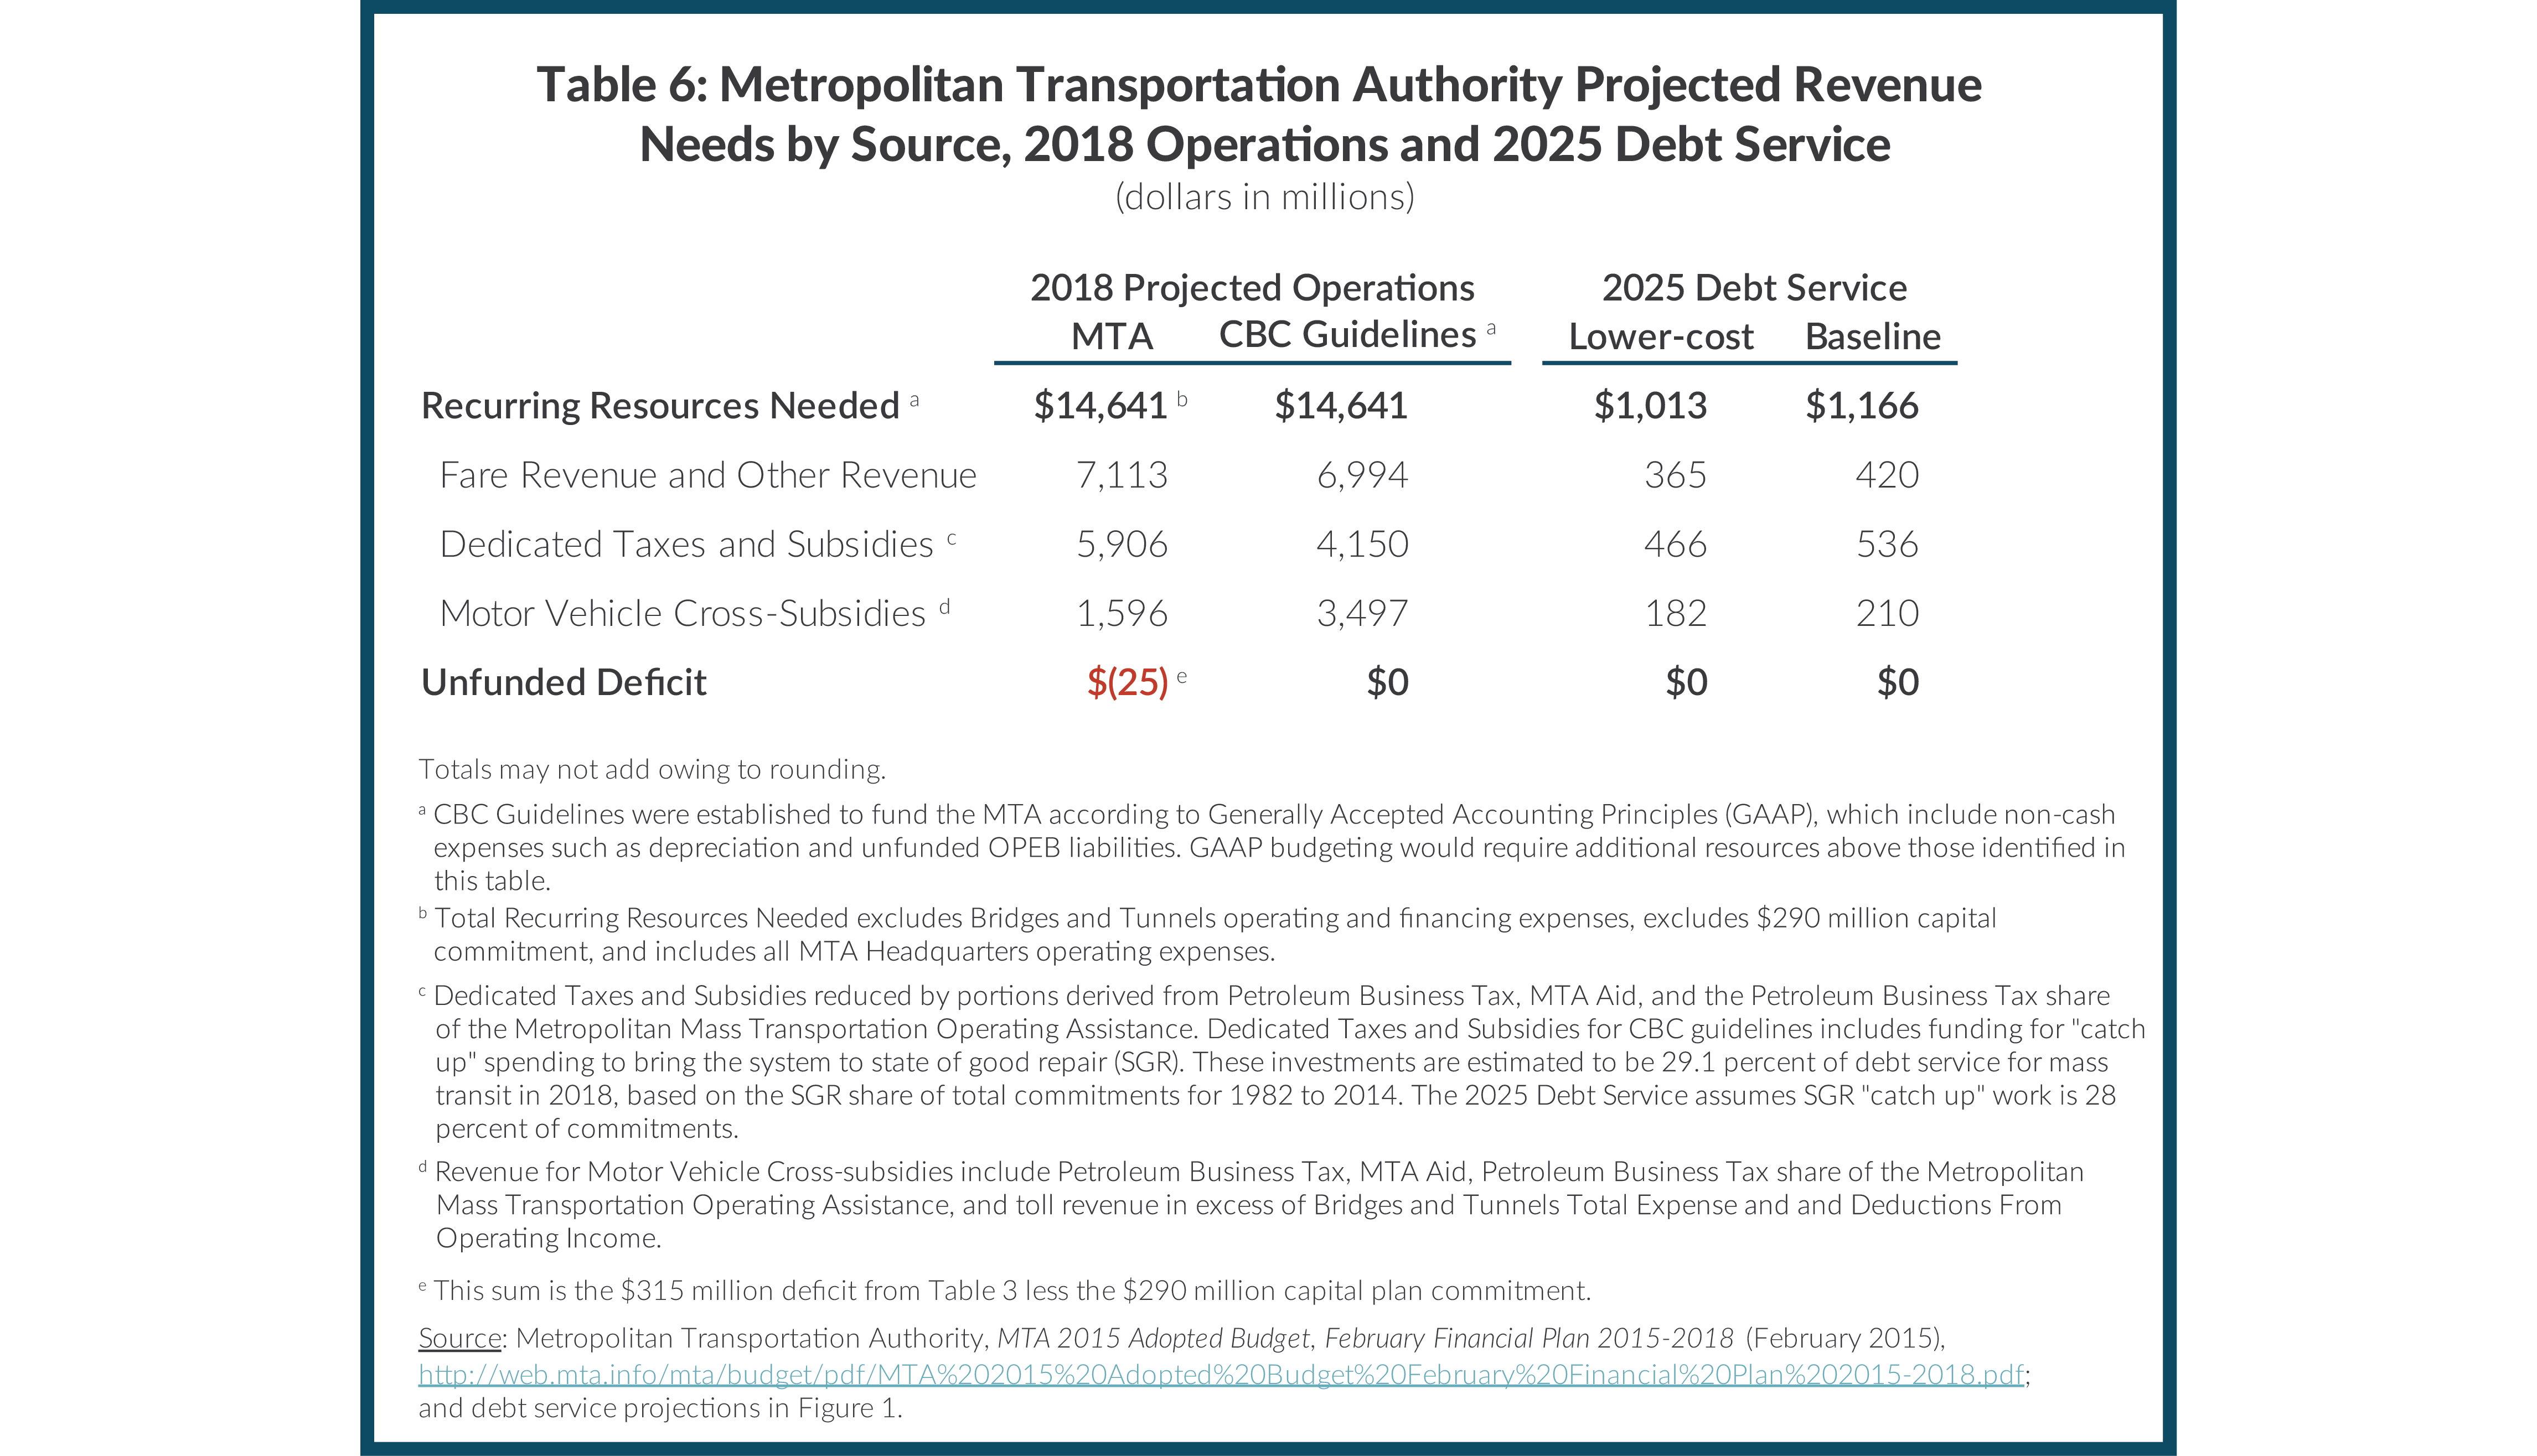
The second column of Table 6 indicates how much each revenue source ought to generate in 2018 under CBC’s guidelines. These sums are not exactly a 50-25-25 distribution because the needs are allocated to the sources with an allowance for a greater share from tax subsidies due to the substantial amount of debt service attributable to capital investments for SGR work.21 Under these guidelines, the shares are 48 percent from fare revenues, 28 percent from tax subsidies, and 24 percent from motorists. A comparison of the projected actual and recommended amounts shows a surplus of $119 million in fare revenues and a large shortfall of $1.9 billion in the cross-subsidy from vehicle users. Tax revenues exceed the amount derived from the formula, but this should not be interpreted as a recommendation to reduce this subsidy. CBC’s guidelines are intended to apply to required spending as defined by Generally Accepted Accounting Principles (GAAP), which exceed the budgeted cash disbursements due to non-cash expenses including depreciation and obligations for retiree health insurance. The additional subsidy is needed to cover these expenses and to cover a share of the funds needed for future debt service. The same is true of the much smaller fare surplus.22
The remaining two columns in Table 6 show the allocation under the two scenarios of the added future debt service expenses from the 2015-2019 capital plan to the three revenue sources (again with an adjustment for the added amount to be paid from the tax subsidy owing to planned SGR work). These calculations suggest the tax subsidy would remain adequate, but fare revenue would need to increase by $365 million or $420 million, and the vehicle cross-subsidy would need to increase by $182 million or $210 million. The net fare increase (given the 2018 excess above the guidelines) is $246 million or $300 million; these sums are about 3.5 percent and 4.2 percent above the projected 2018 level, suggesting the marginal fare increase needed under the guidelines between 2018 and 2025 to fund the plan is in this range.
The guidelines would require far greater increases in the cross-subsidy from vehicle users. Combining the 2018 shortfall under current policies with the increments needed for future debt service yields total added requirement from this source of $2,083 million and $2,110 million for the two investment scenarios. These sums are more than double the current policy revenue in 2018 from this cross-subsidy.
The recommended significant increase in motor vehicle user fees is consistent with the widely agreed upon goal of using financial incentives to reduce the harmful consequences, or negative externalities, of extensive motor vehicle use. The two leading negative impacts are traffic congestion and environmental degradation.
Traffic Congestion. Traffic congestion imposes direct costs on an economy. Congestion makes people late for work, prolongs deliveries, and guzzles additional fuel. An estimate in 2006 indicated the New York region suffers more than $13 billion annually in costs to businesses and consumers owing to excess road congestion.23
More importantly, above a certain threshold, congestion imposes indirect costs on a regional economy by increasing the difficulty in matching workers with jobs. A 2014 study suggests 35 hours to 37 hours of delay per commuter per year as the threshold when the labor force begins to calcify, impeding the most qualified workers from being able to reach the best jobs.24 The average commuter in the New York metropolitan area experiences annual delays of 53 hours. Two ways to alleviate this phenomenon are to prioritize vital trips through road-based user fees and to provide alternative travel capacity, such as mass transit.25
Environmental Degradation. Motor vehicle use also contributes to environmental degradation. A 2013 analysis estimated 2,700 premature deaths annually can be tied to two leading air pollutants—ozone and fine particulate matter—that are byproducts of vehicle emissions, especially in congested traffic. The City has improved its particulate matter levels, notably through converting buildings to cleaner heating fuels, but ozone levels remain high. A 2013 report from the Department of Health cites the need for regional efforts to expand cleaner transportation modes and reduce traffic congestion in order to reduce ozone levels.26
Vehicle emissions also constitute roughly one-third of all greenhouse gases released, a major contributor to climate change and the associated threats from rising sea levels. Unchecked sea level rises will leave the region more susceptible to storm surges caused by weather events, such as Superstorm Sandy. One way to mitigate this trend is by reducing the number of vehicles on the road. Pricing motor vehicle use at a level that encourages mass transit trips and applying cross-subsidies to fund a robust transit system enhances the attractiveness of alternatives to motor vehicle use.
Options to Enable Motorists To Pay A Fair Share
The vast majority of the new money needed to finance future capital investments should come from user charges on motor vehicles in the region. This revenue may be generated in multiple ways, and this final section focuses on four options: alternative tolling policies; increased vehicle registration fees; increased motor fuel taxes; and a vehicle-miles traveled (VMT) tax. In each case the analysis focuses on how well the option can meet the funding needs of the MTA, but consideration is also given to the option’s ability to meet statewide needs for investments in road and bridge infrastructure.
Whatever options are chosen, it should be recognized that the added burden for motor vehicle users will understandably encounter some resistance but is acceptable by reasonable standards. About 5.5 million vehicles were registered in the MTA region in 2013; the expected $1.6 billion annually in motor vehicle user cross-subsidies under current policies averages $289 per vehicle with substantial variation depending on type of vehicle and road use patterns and assuming none of the toll burden is borne by vehicles outside the region. Increasing the motor vehicle cross-subsidy to close the MTA funding gap would require an additional $376 to $381 per vehicle annually (again assuming none of the burden is borne by vehicles outside the region) bringing the longer term future daily average cost to between $1.82 and $1.84. To place the added motor vehicle user burden in the context of the affordability of vehicle ownership and operation, the average premium statewide for mandated automobile insurance in 2014 was $1,173 per year, about double the future estimated per vehicle burden for the MTA motor vehicle cross-subsidies.27
Alternative Tolling Policies
Revenue from tolls can be increased in two basic ways—percentage increases in existing tolls and redesign of tolling policies to include new tolls for entering the central business district as well as adjustments in existing tolls. The MTA is already following the former path, and a widely promoted option known as the Move NY plan pursues the latter.
In 2014 MTA set tolls in each direction at the Brooklyn-Battery Tunnel, Queens Midtown Tunnel, Robert F. Kennedy Bridge, Whitestone Bridge, and Throgs Neck Bridge of $5.33 for E-ZPass users and $7.50 for automobiles paying cash.28 By 2018 planned increases would raise those amounts to $5.54 and $7.50 or $8.00, respectively.29 The average revenue per crossing is expected to be $6.31 in 2018. Because tolls already more than cover Bridges and Tunnels operating costs, revenue from any additional increase would be available to support mass transit capital investment. In order to cover the recommended vehicle cross-subsidy shortfall through conventional toll increases alone, tolls would need to increase between 115 percent and 116 percent, bringing the revenue per crossing from the expected $6.31 to $13.54 and $13.63 assuming no decrease in volume of crossings. Although these steep increases could be phased in, they represent a sharp deviation from planned levels.
The MTA’s current tolling policies have been criticized for being uncoordinated with City of New York and Port Authority of New York and New Jersey policies; the City imposes no tolls, and the Port Authority has higher tolls. The MTA policies also are not linked closely to the goal of reducing traffic congestion; tolls are the same for bridges connected to Manhattan as for some bridges connecting other parts of the city. In response, comprehensive tolling policy changes have been proposed. In 2007 Mayor Michael Bloomberg proposed a “congestion pricing” plan to coordinate existing tolls and impose new tolls in order to raise additional revenue and divert traffic from motor vehicles to mass transit. This plan did not gain the necessary legislative support. In 2008 a commission appointed by Governor David Paterson recommended tolling currently free bridges over the East River to raise revenue to be dedicated to the MTA; this proposal also failed to gain legislative approval.
More recently a coalition of transportation interest groups under the banner of Move NY has proposed a comprehensive plan to lower some current tolls and raise others, impose new tolls on access points to the central business district, and impose an increased surcharge on taxi riders. The plan anticipates $2.3 billion in new annual revenues offset by $760 million in reduced toll revenue and annual administrative costs netting $1.5 billion in available revenue. (See Table 7.)
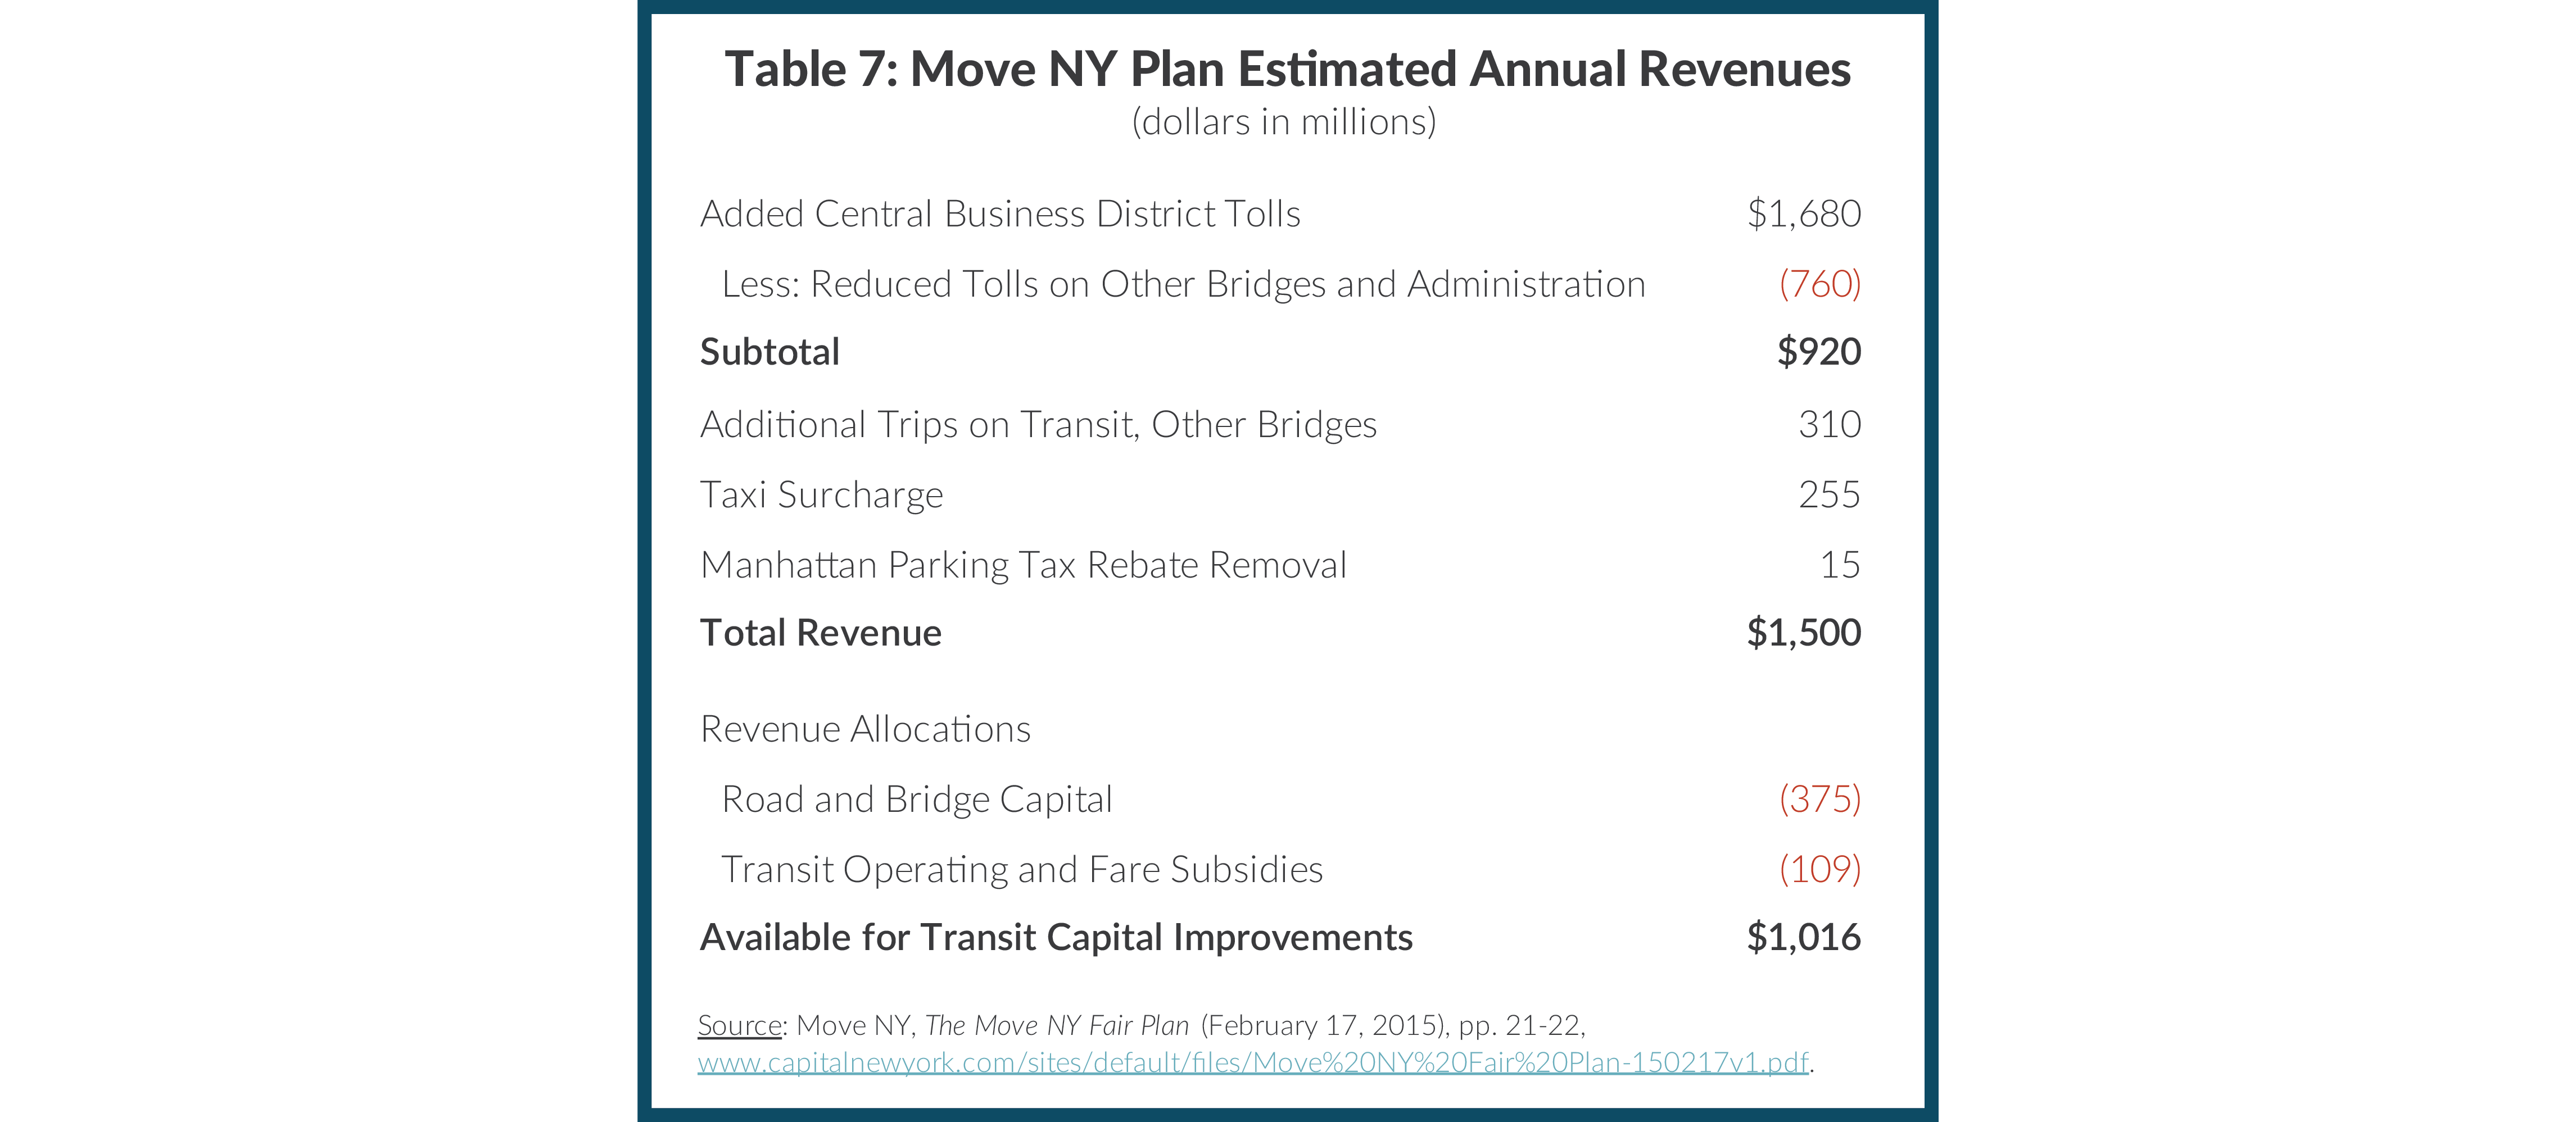
The plan designers propose dedicating $375 million of this revenue to the City’s capital program for roads and bridges, and $109 million to support operating costs of expanded MTA mass transit services. An estimated $1,016 million in annual revenue would remain for new MTA capital obligations. The additional $1,016 million could be a substantial step toward closing the funding gap, but the plan raises the possibility that more of this money would be required for new expansion projects than is allocated in the MTA’s proposed plan.
How well might new tolling policies serve investment needs of the highway and bridge system statewide? As noted, the Move NY plan includes substantial revenue for regional projects of this type. More conventional toll increases also could yield significant revenue. Outside the MTA region seven entities collect road or bridge tolls in New York State.30 In 2013 these entities collected $764 million in toll revenue, with the Thruway Authority accounting for about 85 percent of the total.31 Typically these authorities’ toll revenue is used almost exclusively to cover operating and debt service costs; surpluses are not generated to support other activities. A notable exception is the Thruway Authority; it subsidizes its subsidiary, the New York State Canal Corporation which operates the Erie Canal, with approximately 9 percent of its toll revenue. Modification of the strategy of limited cross-subsidies would permit toll revenues to underwrite other road and bridge projects. A doubling of the existing tolls, paralleling the illustrative option for the MTA, would generate about $764 million annually to support transportation investments outside the MTA region.
Higher Motor Vehicle Fees
In State fiscal year 2015 New York State expects to collect $1.3 billion from motor vehicle fees.32 These include fees for vehicle registrations, drivers’ licenses, license plates, titles, and other miscellaneous fees.33 Of the $1.3 billion total, $725 million is allocated to the Dedicated Highway and Bridge Trust Fund (DHBTF), which funds capital contributions to the state’s road and bridge projects, debt service obligations from borrowing for road and bridge capital projects, and operating costs associated with State transportation agencies.
The remaining $578 million has three uses. The first $171 million, funded by supplemental annual fees specific to vehicles registered in the MTA region and drivers’ licenses issued for residents in the MTA region, goes to the MTA. The second $133 million flows to the Dedicated Mass Transportation Trust Fund (DMTTF), which funds statewide mass transportation capital investments and debt service. Of this amount, $122 million, or 92 percent, is dedicated to the MTA, with the remaining $11 million spread among transit priorities across the rest of the state. The third portion, totaling $104 million, is allocated among other special revenue accounts. In the aggregate the MTA receives about 22 percent of all motor vehicle fees, but a lower 11 percent of the total excluding fees imposed only in the MTA region.
New York State’s fees are low relative to many other states, and more money could be raised from them for transportation capital needs, including the MTA’s 2015-2019 capital plan, without significantly harming New York’s competitive position. Table 8 compares motor vehicle fees levied by selected states based on a typical sedan.34 The first column presents the fees in New York State generally; the second column presents the fees including those imposed only in the MTA service region. The next five columns represent state fees levied by New York’s neighbors. The final column shows New York State’s rank, as well as the state with the highest fee and that amount.

Focusing on motor vehicle registration, New York’s neighbors Vermont ($70) and New Jersey ($59) both have higher fees for passenger vehicles than New York both within the MTA service region ($51) and outside the MTA service region ($26). New York’s other three neighbors—Connecticut ($40), Pennsylvania ($36), and Massachusetts ($30) have registration fees higher than New York State, but lower than the MTA service region. Moreover, five other states have registration fees above $100—Illinois ($101), Maryland ($135), Montana ($217), Iowa ($234), California ($245), and Minnesota ($279).35
Raising New York State’s registration fees for the typical sedan to be in line with Vermont’s $70 fee would increase registration fees 169 percent.36 Such an increase would raise an estimated $631 million. About 11 percent of this increase would be dedicated to the MTA through current DMTTF distributions, yielding $68 million. Doubling supplemental fees for registering motor vehicles in the MTA service region (an additional $25 per year) would raise an estimated $135 million, and doubling the supplemental fee for issuing drivers’ licenses to residents of the MTA service region (an additional $2 per year) would raise an estimated $36 million.37 These fees are currently dedicated wholly to the MTA.
In sum, New York State has potential to raise substantial revenue from motor vehicle fees, but this strategy would make only a modest contribution to bridging the MTA funding gap. The combined effect of the changes identified above yields more than $800 million annually, but only about $239 million or 11 percent of the projected MTA funding gap, would be available to the MTA. In contrast more than $564 million annually could be available for statewide road and bridge investments.
Increased Tax on Motor Fuels
In New York State the motor fuel tax is 8 cents per gallon, the third lowest in the nation; however, New York levies an additional Petroleum Business Tax of 17.8 cents per gallon (16.05 cents per gallon for diesel) and a sales tax on purchases of motor fuels, currently capped at 8 cents per gallon. The result is a combined 33.8 cents gasoline tax per gallon.38
The State expects to receive $1.6 billion from its fuel taxes (excluding the 8 cents per gallon sales tax) in fiscal year 2015.39 These receipts are dedicated to transportation purposes. The allocations vary between the motor fuel tax and the Petroleum Business Tax. The MTA receives 19 percent of the former with the rest, 79 percent, going to DHBTF and the remainder to other transit needs. The MTA receives 37 percent of the Petroleum Business Tax with DHBTF getting 55 percent and the remainder for other transit needs. The MTA’s share of the combined total is 31 percent.40
Including all components of its gasoline taxes (including the sales tax), New York has the 10th highest state tax per gallon in the nation; California is the highest taxing state at 43.185 cents per gallon. However, like motor vehicle registration fees, the New York State rate is lower than some of its neighbors’; Connecticut’s rate is 42.5 cents and Pennsylvania’s is 41.8 cents. (See Figure 2.)

By raising the tax 8.7 cents per gallon, New York could align its total gasoline taxes with that of its neighbor Connecticut. This would raise an additional $529 million statewide. Assuming the MTA received 31 percent of the added revenue, consistent with the current total allocation of fuel taxes, its yield would be $164 million annually. This would close the motor vehicle cross-subsidy funding gap by 8 percent.
Making more significant progress in closing the gap with the gasoline tax would require some combination of raising the rate to an amount well above California’s top rate and altering the share allocated to the MTA, reducing the share for road transportation. To illustrate, fully closing the MTA gap with higher gasoline taxes under current allocation policies would require an increase of $1.12 per gallon bringing New York’s rate to more than triple that in California. If the MTA’s share of the gasoline tax revenue were doubled from 31 percent to 62 percent for any marginal revenues, then the rate increase needed to close the MTA gap would be 57.5 cents bringing the rate to about double that in California. A more plausible scenario for relying heavily on the gasoline tax is raising the rate 16.2 cents per gallon to 50 cents and increasing the MTA’s share of this new revenue to 50 percent. Such a scenario would raise $493 million for the MTA, between 23 percent and 24 percent of the cross-subsidy funding gap depending on the level of plan, and an equal sum for road transportation.
Vehicle-miles Traveled Tax
A VMT tax is a user charge based on the number of miles a vehicle travels on roads. As automobiles and trucks become more fuel efficient, motor fuel taxes have become less effective in raising revenue despite steady or increased road use; consequently, alternative taxes like one based on VMT have become more attractive.
New York State has experience with a VMT-based tax. Since 1951 the State has imposed a truck mileage tax (TMT), which requires heavy trucks to pay a tax at graduated rates according to gross vehicle weight. The tax is calculated by multiplying the number of miles traveled on public highways of the State by the appropriate rate. Truck owners remit this tax on a monthly basis and the State audits trucks to ensure compliance. In fiscal year 2015 the TMT is expected to generate $102 million.41
A broadened VMT tax applying to trucks and to cars has appeal as a long-term substitute for motor fuel taxes to fund transportation infrastructure. Greater use in the future of global positioning (GPS) technology in vehicles would permit variable charges based on the vehicle type, time of day, and particular road or bridge used. Pilot projects have shown a VMT tax can shift travel to off-peak hours and can reduce congestion on targeted routes.42
In 2015 an estimated 131 billion vehicle miles will be traveled in New York State with 53 percent of miles traveled in the MTA region.43 If a VMT tax was to replace the current gasoline taxes and Highway Use Tax, the rates would likely be set to vary by vehicle weight and other features. However, for illustrative purposes two simplified rates can be used—one for passenger vehicles and light trucks and another for heavy trucks and buses. In New York State a VMT tax rate of 1.21 cents per mile for cars and light trucks and 3.31 cents per mile for heavy trucks and buses would be needed to replace the gasoline taxes.44 (See Table 9.)
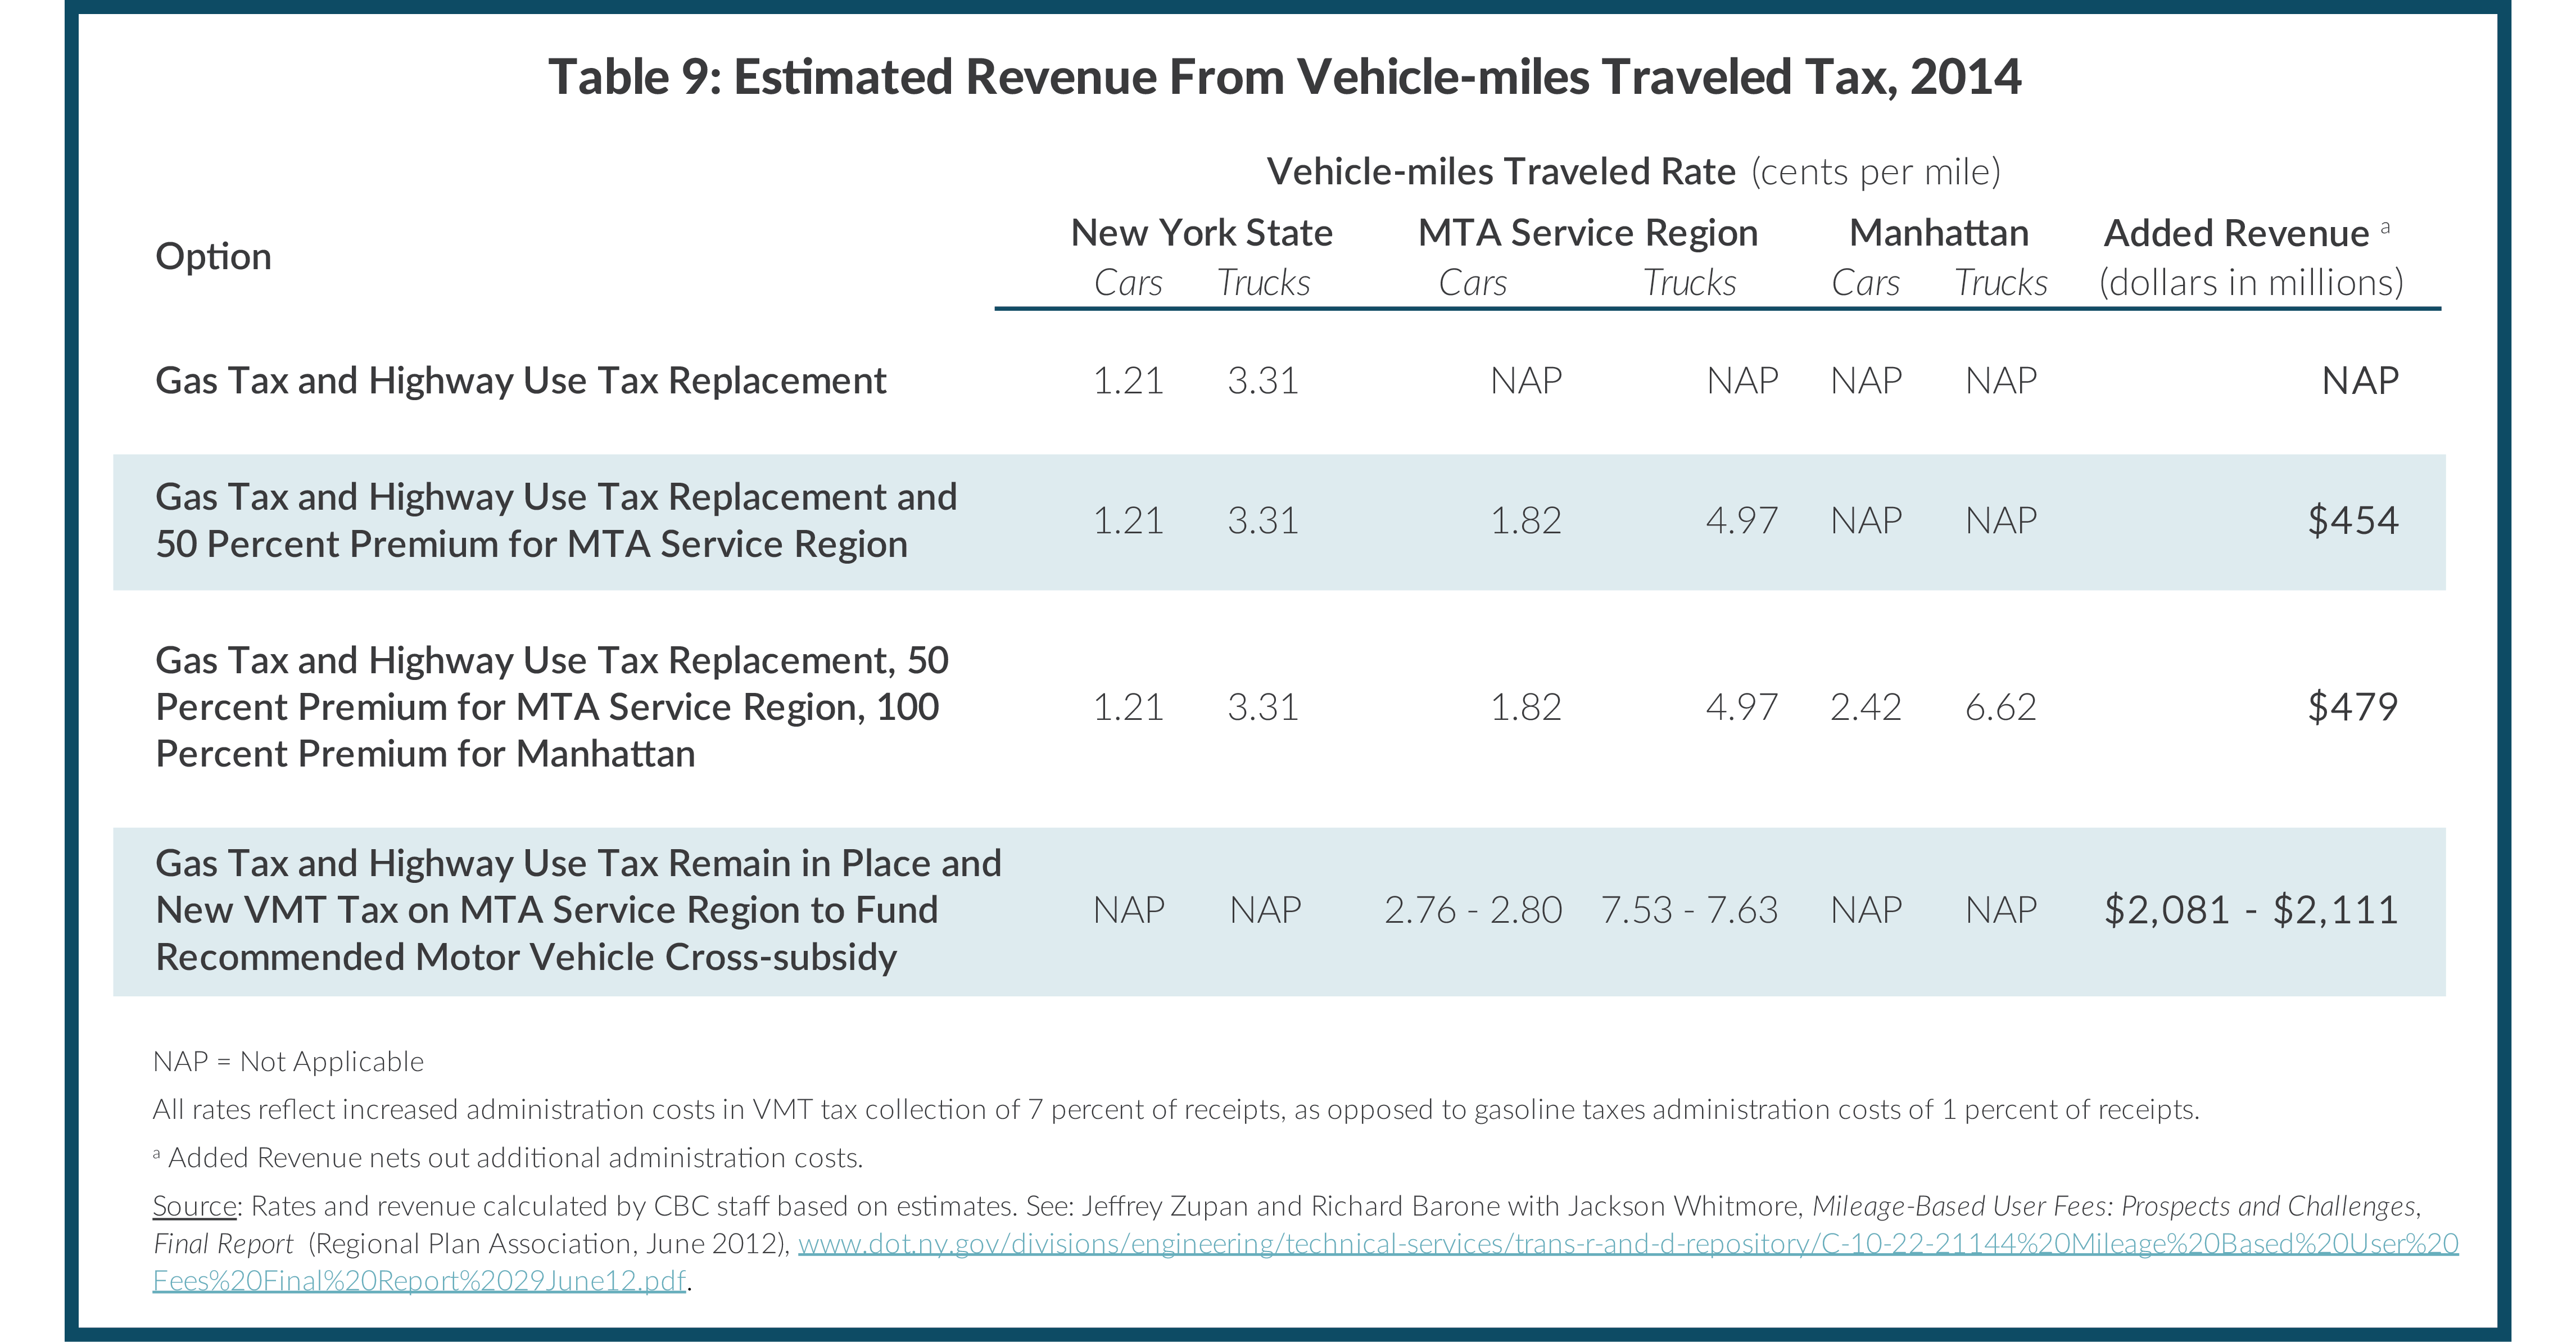
If a VMT tax were used to raise funds for the MTA as well as replace the statewide motor fuel taxes, then the mechanism would likely be premiums on miles driven in the MTA region and on miles driven in specific congested areas like Manhattan. A 50 percent premium for miles driven in the MTA service region would yield an additional $454 million annually, or 21 percent of the difference between current and recommended vehicle cross-subsidies. If premiums of 50 percent for the MTA region and 100 percent for Manhattan were used, this would provide an additional $479 million, or 23 percent of the difference between current policies and suggested guidelines for vehicle cross-subsidies under the two scenarios.
If current gasoline taxes were left in place and a new VMT tax, applied to the MTA region, were used to raise revenue needed to close the gap in MTA funding from vehicle cross-subsidies, the needed rates would be 2.76 cents per mile for cars and light trucks and 7.53 cents per mile for heavy trucks to meet the lower-cost scenario target, and 2.80 cents per mile for cars and light trucks and 7.63 cents per mile for heavy trucks to meet the baseline scenario target.
As motor vehicles become more fuel efficient a VMT tax better reflects the use of road infrastructure than do gasoline taxes; however, the VMT tax also has limitations given recent trends. While total national VMT increased steadily from the 1980s through 2007, the Great Recession led to a 2.9 percent decline. Since the summer of 2009 national VMT has not yet reached its 2007 peak.45 Nonetheless, the VMT tax still has advantages over motor fuel taxes, which are subject to greater drops in consumption and cannot use GPS technology to target higher rates for more congested roads.
The VMT tax also can be a major revenue source for road and bridge investments outside the MTA region. Although Table 9 does not include options for this purpose, a VMT tax rate above that needed to replace the gasoline tax statewide could yield major new revenue for transportation infrastructure. For example, a VMT tax rate half that required to close the funding gap in the MTA region applied to the rest of the state would yield $905 million annually for transportation investments in those areas.46
Summary of Options and Policy Implications
As the previous discussion suggests, multiple options are available to raise substantial new revenue from a vehicle cross-subsidy to mass transit. Table 10 summarizes the impact of the options in closing the MTA funding gap under the two scenarios.
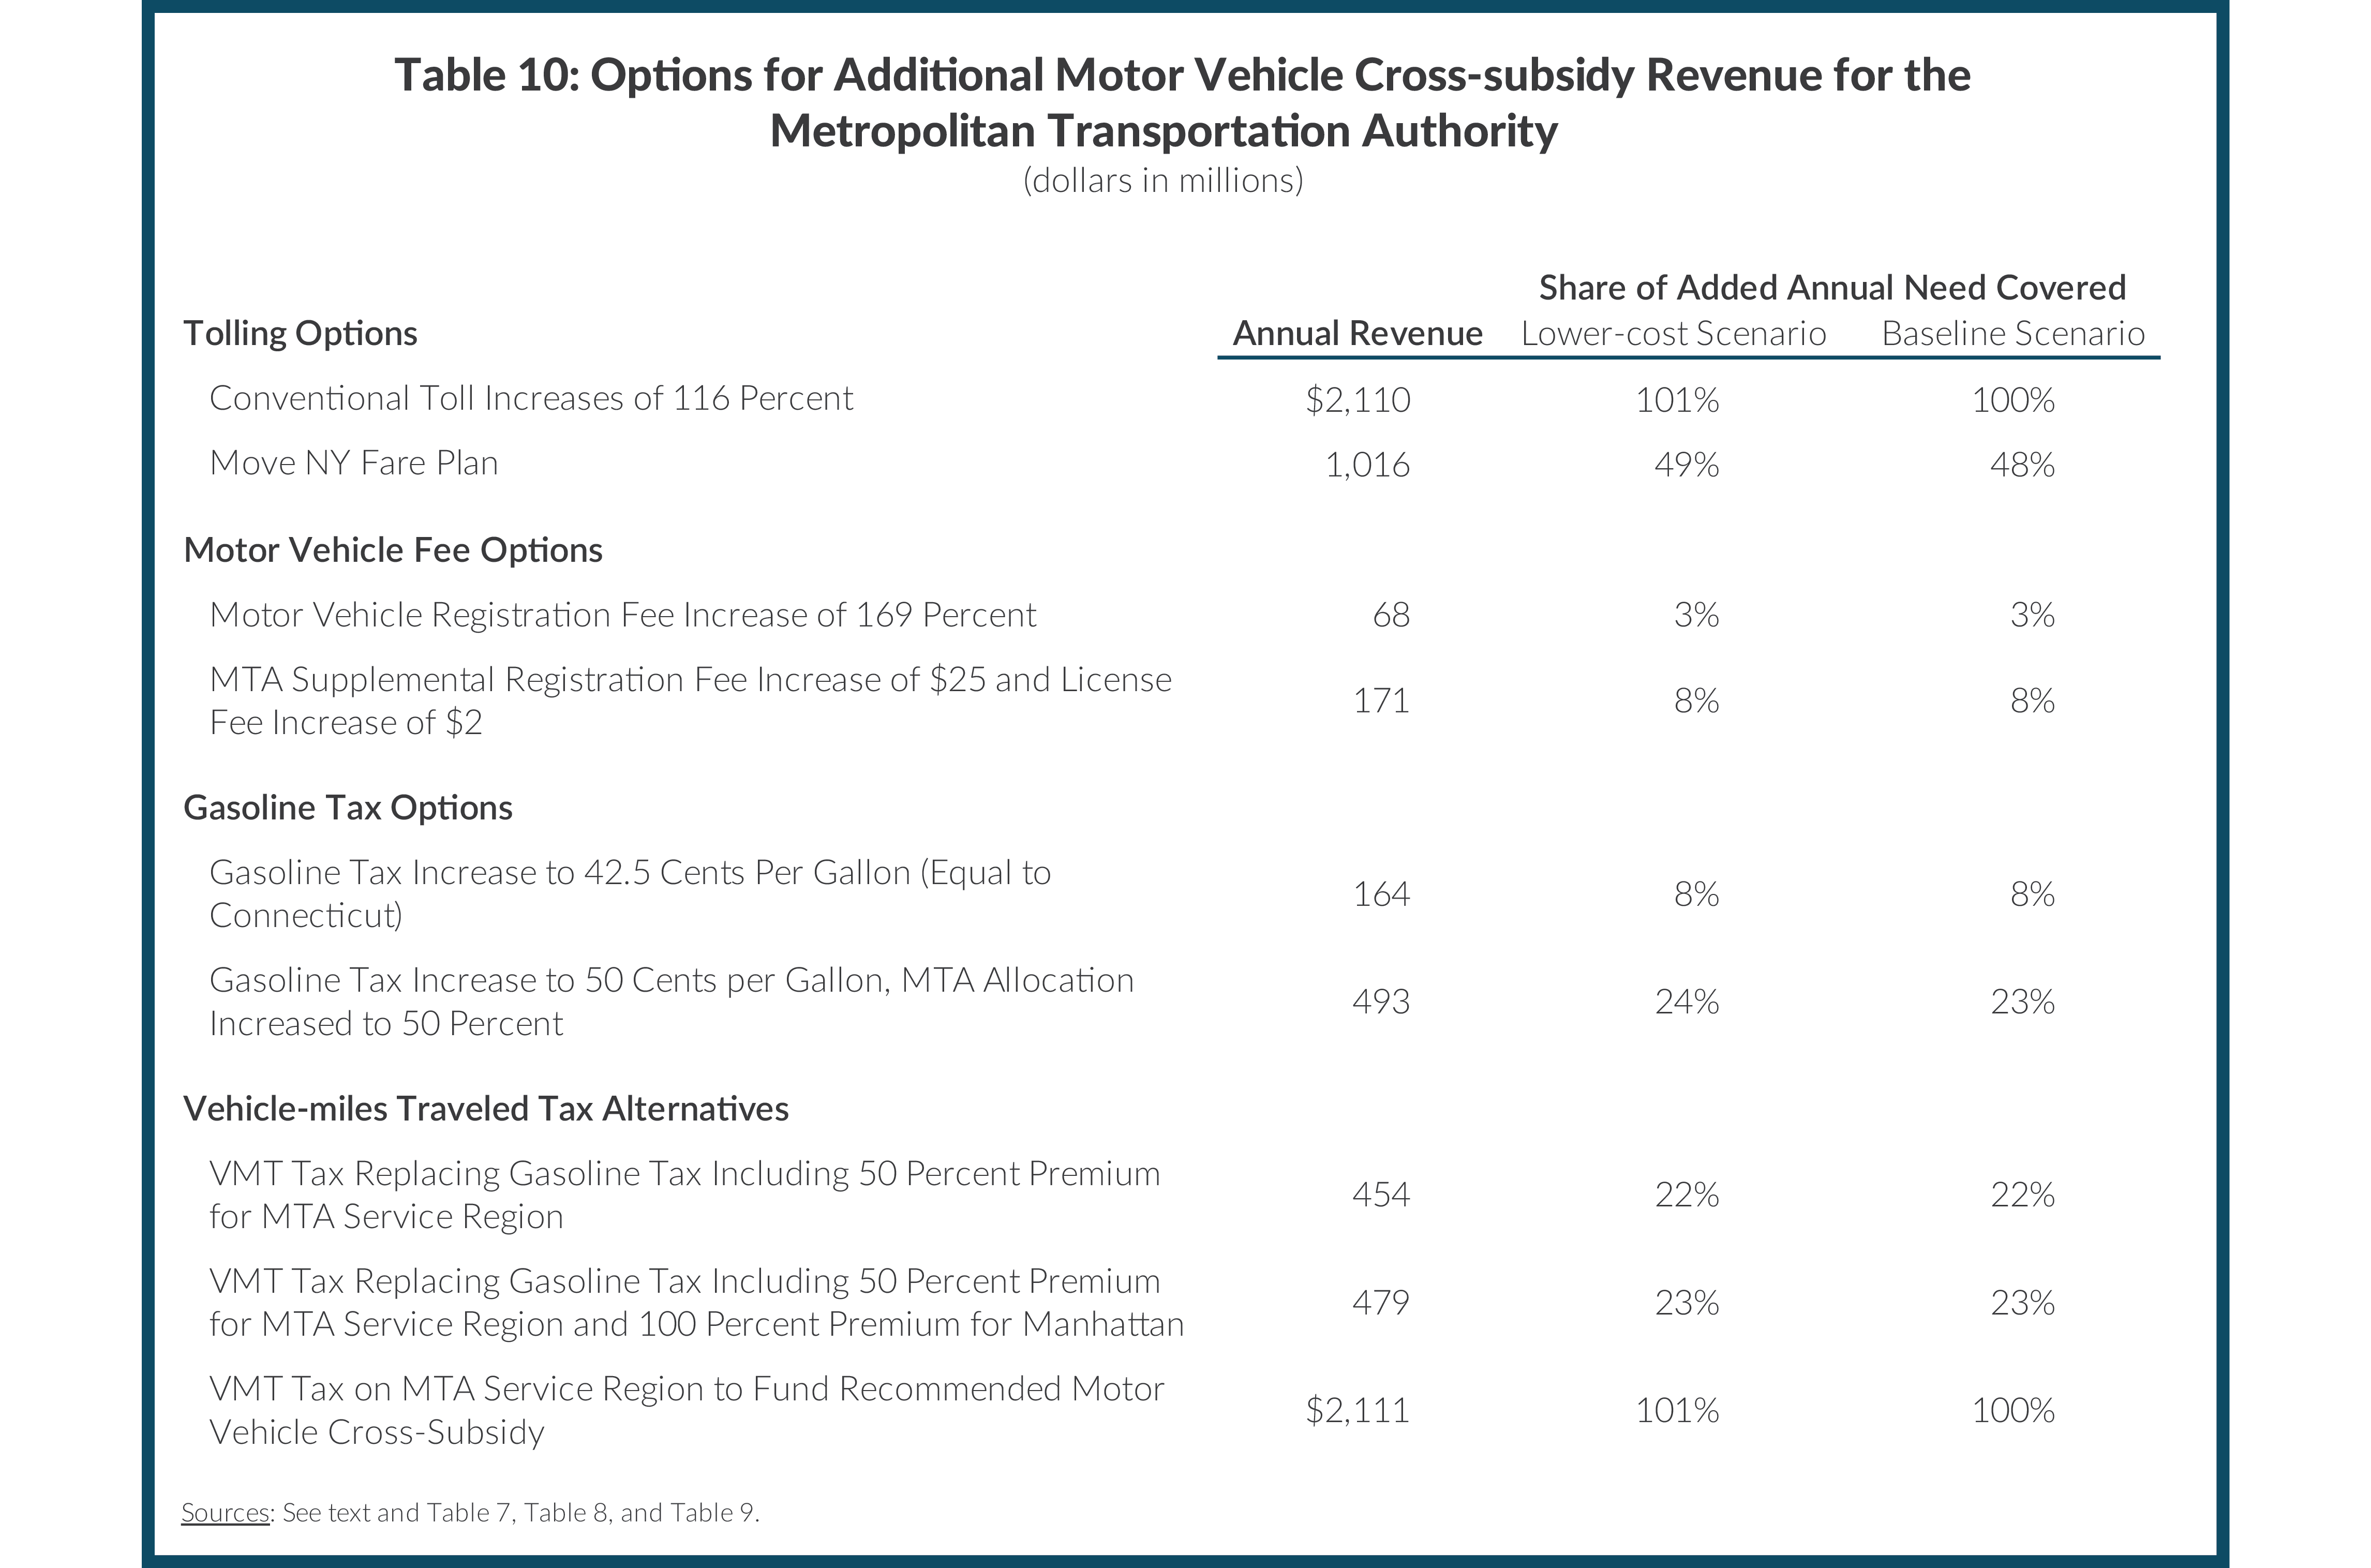
Of the options explored, two are capable of closing the full funding gap alone. Doubling the planned 2018 MTA bridge tolls would raise the needed revenue if use remained constant; however, this option likely would raise problems due to declines in bridge and tunnel volume and the harsh consequences for those needing the bridges for unalterable travel needs. Accordingly, a more acceptable and plausible variant of this option is higher, but not doubled, tolls.
The alternative tolling policies of the Move NY plan do not fully close the gap, but make a substantial contribution. The plan has the advantage of easing road congestion.47 In addition, future increases in its proposed toll rates have the potential to make even greater progress in closing the revenue gap in years after 2018. Combined with other options, this plan could be a key element in meeting the MTA’s future capital funding needs. The Move NY plan and the application of higher tolling policies to State authorities in addition to the MTA have potential to raise significant revenue for road and bridge infrastructure.
A new VMT tax is capable of closing the MTA funding gap. This option is attractive as a mechanism for mass transit funding and as a replacement for gasoline taxes for highway and bridge funding. Deployment of GPS technology could also make it effective in reducing congestion through variable rates for peak hours and particular road or bridge use. Implementation of the new approach should proceed cautiously with time for adjustments, but this is a highly promising strategy. Moreover variable rates for vehicle type and fuel efficiency may also direct motorists toward more environmentally friendly motor vehicles when such a trip is necessary.
The other options alone have more limited potential for closing the MTA funding gap. Higher motor fuel taxes and increased vehicle fees are more conventional and easier to implement than a VMT tax or the Move NY plan, but reasonable increments can yield only a modest portion of the needed funding.
A clear implication of this analysis is that bold action is required by the State’s political leaders to meet critical mass transit capital investment needs. Such innovations have the added advantages of yielding revenue to support statewide transportation investments and contributing to a more environmentally friendly transportation system.
Footnotes
- Congressional Budget Office, The Highway Trust Fund and the Treatment of Surface Transportation Programs in the Federal Budget (June 11, 2014), p. 1, www.cbo.gov/publication/45416.
- Citizens Budget Commission, A Better Way to Pay for the MTA (October 2012), www.cbcny.org/sites/default/files/REPORT_MTA_10102012.pdf; Danger Ahead: How to Balance the MTA’s Budget (June 2006), www.cbcny.org/sites/default/files/reportsummary_mta_06272006.pdf; and Financing Transportation Services in the New York Region (March 2004), www.cbcny.org/sites/default/files/report_transportation_03292004.pdf.
- The recently enacted increase for 2015 is 4 percent in charges; for 2017 the planned increase is 4 percent in net revenue, requiring slightly higher increases in charges due to expected negative impacts on volume of use. See: Metropolitan Transportation Authority, MTA 2015 Final Proposed Budget, November Financial Plan 2015-2018 (November 2014), p. I-2, http://web.mta.info/news/pdf/MTA_2015_Final_Proposed_Budget_November_Financial_Plan_2015-2018_Volume_1.pdf.
- Metropolitan Transportation Authority, MTA 2015 Adopted Budget, February Financial Plan 2015-2018 (February 2015), p. II-1, http://web.mta.info/mta/budget/pdf/MTA%202015%20Adopted%20Budget%20February%20Financial%20Plan%202015-2018.pdf.
- Metropolitan Transportation Authority, MTA 2015 Adopted Budget, February Financial Plan 2015-2018 (February 2015), “Baseline Total Non-Reimburseable – Reimbursable Positions,” p. III-27, http://web.mta.info/mta/budget/pdf/MTA%202015%20Adopted%20Budget%20February%20Financial%20Plan%202015-2018.pdf.
- Pension costs are expected to increase for 2014 to $1,359 million, but decrease each year through 2017 owing to one-time contributions to offset unfunded pension liabilities. The MTA expects the $135 million contribution to the Long Island Rail Road Additional Pension Liability, its lowest funded plan, to reduce future contributions in an amount comparable to achieving a 7 percent compounded rate of return, producing annual savings of approximately $10 million. See: Metropolitan Transportation Authority, MTA 2015 Adopted Budget, February Financial Plan 2015-2018 (February 2015), p. II-3, http://web.mta.info/mta/budget/pdf/MTA%202015%20Adopted%20Budget%20February%20Financial%20Plan%202015-2018.pdf.
- Metropolitan Transportation Authority, MTA 2015 Adopted Budget, February Financial Plan 2015-2018 (February 2015), “February Financial Plan 2015-2018 Plan Adjustments,” p. II-4, http://web.mta.info/mta/budget/pdf/MTA%202015%20Adopted%20Budget%20February%20Financial%20Plan%202015-2018.pdf.
- Metropolitan Transportation Authority, Independent Auditor’s Review Report, Consolidated Interim Financial Statements as of and for the Nine-Month Period Ended September 30, 2014 (January 2015), “Consolidated Interim Statements of Net Position, September 30, 2014 and December 31, 2013,” p. 20, http://web.mta.info/mta/budget/pdf/Consolidated_2014_FinancialsQ3.pdf.
- In 2010 the MTA Board and CPRB approved a $23.8 billion 2010-2014 Capital Plan; however, portions of the financing for this plan were appropriated by the State legislature for only two years. In the State Fiscal Year 2013 budget the legislature included full funding for the remaining three years of the plan, including a $770 million appropriation, an increase of the MTA’s debt capacity to $41 billion, and recognition of $2.2 billion in a federal loan to support East Side Access investments. Furthermore, the MTA achieved $1.6 billion in savings through more efficient implementation of its capital plan. See: Permanent Citizens Advisory Committee to the MTA, The Road Back: A Historic Review of the MTA Capital Program (May 2012), pp. 19-26, www.pcac.org/wp-content/uploads/2014/09/The-Road-Back.pdf.
- The $16.1 billion figure also includes MTA Bus Company and MTA Interagency investments. See: Metropolitan Transportation Authority, MTA Capital Program 2010-2014: Amendment as approved by the MTA Board (July 2013), Table I and Table XVI, pp. 3, 53, http://web.mta.info/capital/pdf/CapitalConstruction_1014.pdf.
- Metropolitan Transportation Authority, Capital Needs Assessment 2015-2034 (October 2013), p. 19, http://web.mta.info/mta/capital/pdf/TYN2015-2034.pdf.
- Joan McDonald, New York State Department of Transportation, letter to Thomas F. Prendergast, Chairman, Metropolitan Transportation Authority (October 2, 2014; accessed October 20, 2014), www.scribd.com/doc/241839626/Capital-Program-Veto-Letter.
- Citizens Budget Commission, Misplaced Priorities in the MTA’s Capital Plan (October 2014), www.cbcny.org/sites/default/files/REPORT_MTACapitalPlan_10222014.pdf.
- Jimmy Vielkind, “Cuomo: M.T.A. capital plan is ‘bloated’,” Capital New York (October 7, 2014), www.capitalnewyork.com/article/albany/2014/10/8554075/cuomo-mta-capital-plan-bloated.
- While eliminating new expansion projects—with the exception of East Side Access—would reduce the total size of the plan, some costs may not be recovered. The revised plan total of $29.3 billion is illustrative.
- Metropolitan Transportation Authority, MTA Capital Program 2015-2019: Renew. Enhance. Expand. (September 2014), Table 2, p. 38, http://web.mta.info/capital/pdf/Board_2015-2019_Capital_Program.pdf.
- From 2015 to 2018 the MTA has reduced revenues from subsidies by nearly $1.3 billion under the line “Committed to Capital.” It is expected that these funds will support capital spending related to both the current capital plan and the 2015-2019 capital plan. The MTA allocates $290 million per year to the 2015-2019 capital plan beginning in 2015. See: Metropolitan Transportation Authority, MTA 2015 Adopted Budget, February Financial Plan 2015-2018, (February 2015), “Consolidated Subsidies, Cash Basis,” p. II-6, http://web.mta.info/news/pdf/MTA_2015_Final_Proposed_Budget_November_Financial_Plan_2015-2018_Volume_1.pdf; and Robert Foran, Chief Financial Officer, Metropolitan Transportation Authority, briefing to CBC staff (November 20, 2014).
- This does not include the proposed $150 million from the Special Infrastructure Fund to fund transit-oriented development including the development of parking facilities at LIRR hubs at Nassau and Ronkonkoma. See: State of New York Division of the Budget, FY 2016 Capital Program and Financing Plan (January 2015), http://publications.budget.ny.gov/eBudget1516/capitalPlan/CapPlan.pdf.
- In practice the MTA typically does not fully commit all the contracts authorized in a capital plan in that five-year period. For instance, the 2005-2009 Capital Program provided for $23.7 billion in commitments; as of December 31, 2009, only $18.8 billion had been committed. See: Metropolitan Transportation Authority, Consolidated Financial Statements as of and for the years ended December 31, 2009 and 2008 (April 2010), p. 22, http://web.mta.info/mta/budget/pdf/cons_0908.pdf.
- This schedule assumes 5 percent, 10 percent, 20 percent, 30 percent, 20 percent, 10 percent, and 5 percent of the contract amount is paid in the respective seven years.
- The column recognizes general tax subsidies ought to fund debt service for state of good repair (SGR) capital investments, estimated to be $836 million in 2018. This is 29.1 percent of debt service for mass transit, based on the SGR share of total capital commitments for 1982 to 2014.
- CBC guidelines were established to fund the MTA on budgets prepared according to GAAP, which would account for non-cash expenses such as depreciation and unfunded OPEB liabilities. GAAP budgeting would require additional resources above those identified in this section. See: Citizens Budget Commission, A Better Way to Pay for the MTA (October 2012), pp. 5-6, www.cbcny.org/sites/default/files/REPORT_MTA_10102012.pdf.
- Partnership for New York City, Growth or Gridlock? The Economic Case for Traffic Relief and Transit Improvement for a Greater New York (December 2006), pp. 19-41, www.pfnyc.org/reports/Growth%20or%20Gridlock.pdf.
- Matthias Sweet, “Traffic Congestion’s Economic Impacts: Evidence from US Metropolitan Regions,” Urban Studies (June 2014), vol. 51, no. 10, pp. 2088-2110.
- Matthias Sweet, “Traffic Congestion’s Economic Impacts: Evidence from US Metropolitan Regions,” Urban Studies (June 2014), vol. 51, no. 10, pp. 2088-2110; and INRIX, “Traffic Scorecard” (accessed January 19, 2015), www.inrix.com/scorecard/.
- Particulate matter is commonly referred to as “soot” and is released by combustion sources. Federal and state regulators test for PM2.5 which includes particles in the air that are less than 2.5 micrometers in diameter. Motor vehicles account for approximately 10 percent of fine particulate matter. Ozone is not emitted by pollution sources, rather it is formed at air temperatures above 80 degrees Fahrenheit when sunlight reacts with hydrocarbons such as gasoline vapors and nitrogen dioxide. See: Sarah Crean, “While Improving, City’s Air Quality Crisis Quietly Persists,” Gotham Gazette (June 19, 2014), www.gothamgazette.com/index.php/government/5111-while-improving-quiet-crisis-air-quality-persists-new-york-city-asthma-air-pollution; and New York City Department of Health, New York City Trends in Air Pollution and its Health Consequences (September 26, 2013), pp. 10-12, www.nyc.gov/html/doh/downloads/pdf/environmental/air-quality-report-2013.pdf.
- New York’s average automobile insurance is 10th lowest of all 50 states. For full description of methodology see: Barbara Marquand, Insure.com, “Car insurance rates by state, 2014 edition” (accessed February 12, 2015), www.insure.com/car-insurance/car-insurance-rates.html.
- Other crossings are tolled at different rates. The Verrazano-Narrows Bridge’s roundtrip toll, collected entering Staten Island only, is $10.66 with E-ZPass and $15 with cash; Henry Hudson Bridge’s E-ZPass toll is $2.44 and its cash toll is $5, submitted by mail; lastly the Cross Bay and Marine Parkway Bridges levy $2 E-ZPass tolls and $3.75 cash tolls.
- Metropolitan Transportation Authority, “MTA Announces Limited Fare and Toll Proposals” (press release, November 17, 2014), www.mta.info/press-release/mta-headquarters/mta-announces-limited-fare-and-toll-proposals.
- They are the New York State Thruway Authority, New York State Bridge Authority, Buffalo and Fort Erie Public Bridge Authority, Niagara Falls Bridge Commission, Ogdensburg Bridge and Port Authority, Thousand Island Bridge Authority, and Nassau County Bridge Authority.
- Niagara Falls Bridge Commission’s fiscal year ends on October 31 and Ogdensburg Bridge and Port Authority’s fiscal year ends on March 31. See: New York State Thruway Authority Audited Financial Statements (2014), www.thruway.ny.gov/about/financial/statements/2013-audited-financial-statements.pdf; State of New York, Office of the State Comptroller, Annual Public Authority Budget and Financial Plan Request 2015 (August 2014), New York State Bridge Authority, pp. 1-3, www.nysba.net/Annual%20Reports/2015/2015%20Budget%20and%20Financial%20Plan.pdf; Buffalo and Fort Erie Public Bridge Authority, Financial Statements, December 31, 2013 (2014), http://2015.peacebridge.com/docs/Financial_Statements_2013.pdf; Niagara Falls Bridge Commission, Financial Statements and Additional Information For the Years Ended October 31, 2013 and 2012 (2014), www.niagarafallsbridges.com/images/finance12-13.pdf; Ogdensburg Bridge and Port Authority, Bridge Fund Budget for the Year Ending March 31, 2016 (2014), www.ogdensport.com/PDFs/Annual%20Budget%202015%202016.pdf; New York State Authorities Budget Office, Public Authorities Reporting Information System, Annual Report for Nassau County Bridge Authority (July 18, 2014), www.abo.ny.gov/annualreports/PARISAnnualReports/FYE2013/Local/ARNassauCountyBridgeAuthority2013.pdf; and New York State Division of the Budget, New York State Public Authorities (January 2013), www.budget.ny.gov/pubs/archive/fy1213archive/eBudget1213/agencyPresentations/pdf/PublicAuthorities.pdf.
- New York State Division of the Budget, FY 2016 Economic and Revenue Outlook (January 2015), p. 335, http://publications.budget.ny.gov/eBudget1516/economicRevenueOutlook/economicRevenueOutlook.pdf.
- Counties may add a County Use Tax to registration fees, but these are typically modest, ranging from $5 to $15 per year for passenger vehicles and between $10 and $30 per year for commercial vehicles. A New York City-specific fee of $15 per year for passenger vehicles and $40 per year for commercial vehicles is collected. See: New York State Department of Motor Vehicles, “Passenger Vehicle Registration Fees, Use Taxes and Supplemental Fees,” (accessed November 24, 2014), http://dmv.ny.gov/registration/registration-fees-use-taxes-and-supplemental-fees-passenger-vehicles.
- The example sedan is a 2015 Honda Accord LX priced at $22,105 and weighing 3,192 pounds.
- Data updated for 2014 from National Conference of State Legislatures. See: National Conference of State Legislatures, “Registration and Title Fees by State (2012 Chart)” (accessed February 24, 2015), http://www.ncsl.org/research/transportation/registration-and-title-fees-by-state.aspx; and data from websites of states’ departments of motor vehicles.
- Calculation assumes non-MTA service region registration revenue increased 169 percent, which would result in heavier vehicles having registration fees higher than $70.
- This assumes doubling annual revenue generated by the supplemental registration fee for the MTA service region. See: New York State Division of the Budget, FY 2016 Economic and Revenue Outlook (January 2015), p. 340, http://publications.budget.ny.gov/eBudget1516/economicRevenueOutlook/economicRevenueOutlook.pdf.
- New York State Department of Taxation and Finance, Publication 908, Fuel Tax Rates (January 2015), www.tax.ny.gov/pdf/publications/multi/pub908.pdf.
- These include receipts from the Motor Fuel Tax and from expected gasoline and highway diesel Petroleum Business Tax receipts.
- New York State Division of the Budget, FY 2016 Economic and Revenue Outlook (January 2015), http://publications.budget.ny.gov/eBudget1516/economicRevenueOutlook/economicRevenueOutlook.pdf.
- New York State Division of the Budget, FY 2016 Economic and Revenue Outlook (January 2015), pp. 199, www.budget.ny.gov/pubs/executive/eBudget1415/economicRevenueOutlook/economicRevenueOutlook.pdf.
- Issues relating to relatively high collection costs and protecting drivers’ privacy arise in the implementation of a VMT tax, but these anticipated problems have widely acceptable solutions. See: Zhan Guo et al., The Intersection of Urban Form and Mileage Fees: Findings from the Oregon Road User Fee Pilot Program, MTI Report 10-04, (March 2011), http://transweb.sjsu.edu/PDFs/research/2909_10-04.pdf; and Jeffrey Zupan and Richard Barone with Jackson Whitmore, Mileage-Based User Fees: Prospects and Challenges, Final Report (Regional Plan Association, June 2012), www.dot.ny.gov/divisions/engineering/technical-services/trans-r-and-d-repository/C-10-22-21144%20Mileage%20Based%20User%20Fees%20Final%20Report%2029June12.pdf.
- Estimated based on total miles from Regional Plan Association 2012 report and county-level shares from New York State Department of Environmental Conservation study. See: Regional Plan Association, Mileage-Based User Fees: Prospects and Challenges (June 2012), Jeffrey Zupan and Richard Barone with Jackson Whitmore, Mileage-Based User Fees: Prospects and Challenges, Final Report (Regional Plan Association, June 2012), Table 14, p. 31, www.dot.ny.gov/divisions/engineering/technical-services/trans-r-and-d-repository/C-10-22-21144%20Mileage%20Based%20User%20Fees%20Final%20Report%2029June12.pdf ; and New York State Department of Environmental Conservation, “New York City Metropolitan Area 24-hour PM2.5 Nonattainment Area Boundary Determination” (accessed November 21, 2014), www.dec.ny.gov/chemical/40748.html.
- Due to rounding, these per mile rates would yield nearly $3 million in surplus revenue. These rates include added administrative costs, estimated to be 7 percent of receipts, as opposed to current administrative expenses which are estimated to be 1 percent of receipts. See: Jeffrey Zupan and Richard Barone with Jackson Whitmore, Mileage-Based User Fees: Prospects and Challenges, Final Report (Regional Plan Association, June 2012), https://www.dot.ny.gov/divisions/engineering/technical-services/trans-r-and-d-repository/C-10-22-21144%20Mileage%20Based%20User%20Fees%20Final%20Report%2029June12.pdf.
- St. Louis Federal Reserve Bank, FRED Economic Data, “Moving 12-Month Total Vehicle Miles Traveled” (accessed November 21, 2014), http://research.stlouisfed.org/fred2/series/M12MTVUSM227NFWA.
- Gross receipts of $964 million are adjusted to $905 million based on expected increase in administrative costs.
- Proponents expect travel speeds within the Manhattan Central Business District to improve between 15 percent and 20 percent. See: Move NY, The Move NY Fair Plan (February 17, 2015), p. 18, www.capitalnewyork.com/sites/default/files/Move%20NY%20Fair%20Plan-150217v1.pdf.