A New Approach to Funding New York City Health + Hospitals
New York City Health + Hospitals (H+H), with a nearly $8 billion annual budget, plays an important role in the local health care system. Its 11 acute care hospitals, multiple clinics and long-term care facilities are a major source of inpatient and outpatient care for uninsured individuals and other individuals with mental health conditions who may not be able to readily access voluntary institutions. H+H also is a preferred source of care for many who find its facilities geographically convenient and its staff culturally competent. In a typical year, H+H provides 192,000 acute inpatient admissions and 3.4 million clinic visits, 17 percent and 49 percent of the respective citywide totals.1
In order to provide these services H+H requires a subsidy from New York City taxpayers. While it receives payments for many of its services from the joint federal-state Medicaid program, the federal Medicare program, private insurance companies, and self-paying patients, these operating revenues are not sufficient to meet all its costs. The shortfall is covered in large part by a local tax subsidy, and by other supplemental sources. The Independent Budget Office estimates City support to H+H in fiscal year 2019 was $1.7 billion, up from $359 million in fiscal year 2009, and projected to reach $2.3 billion in fiscal year 2023.2
A long-standing and problematic policy issue is whether the City’s subsidy in any year is an appropriate amount. If the subsidy is too low, H+H may provide lower quality services or not be able to offer care to all who seek it. If the subsidy is too high, taxpayers’ money may be wasted supporting inefficient practices. As the size of the subsidy has grown in recent years, concern has increased about the way in which the City determines the amount it allocates to H+H.3
This report analyzes the nature of the shortfall in H+H operating revenues and presents a method for determining a reasonable annual local tax subsidy for H+H. The first section examines the reasons why H+H incurs an operating deficit. Key findings are:
- H+H in fiscal years 2015 to 2017 had an average operating deficit—the difference between what is spent on patient services and what H+H is paid for providing those services—of nearly $3 billion, or 46 percent of its operating expenses. This deficit is typically covered with City funds, federal support for supplemental payments not linked to direct service provision, and drawing down reserve funds.
- The deficit is primarily due to outpatient services (61 percent of losses) rather than inpatient services (39 percent). In terms of revenue sources the cause of the deficit is about one-fourth care for the uninsured and more importantly payments below cost from Medicaid (56 percent) and other insurance programs (23 percent).
The second section compares H+H’s fiscal performance to two sets of voluntary hospitals – those with a similar “safety net” mission and the hospital networks built by academic medical centers. Key findings are:
- The fiscal performance of the voluntaries is better than that of H+H; the safety net institutions have deficits that average 15 percent of operating expenses and the large networks average a surplus 9 percent above operating expenses.
- H+H provides a different mix of services than voluntary institutions with more of its expenses devoted to outpatient care (46 percent) than the voluntary safety net institutions (39 percent) and the large networks (40 percent). H+H also devotes more resources to inpatient mental health services (10 percent) than the safety net institutions (5 percent) and large networks (2 percent).
- The unit costs of H+H services are generally higher than those of voluntary institutions, although the comparisons should be interpreted cautiously due to different patient characteristics and other factors.
- The institutions have different mixes of revenues. The large networks receive nearly half (47 percent) of their revenue from commercial insurance, a proportion that dwarfs that of H+H (7 percent) and safety net institutions (14 percent). H+H is more heavily dependent on Medicaid (55 percent) than safety net institutions (48 percent) and large networks (21 percent).
- From each of the major payment sources H+H recovers a smaller share of the associated cost of services for its enrollees than the voluntaries. H+H recovers an estimated 53 percent of associated cost from Medicaid compared to 77 percent among safety net institutions; H+H recovers 42 percent from commercial insurance compared to 90 percent for safety net institutions and 167 percent among the large networks. The profit margins of the large networks are dependent on the surpluses generated by commercial insurance.
The final section offers recommendations for how City and State policy should be changed to provide a basis for setting a subsidy for H+H that will support its vital services while simultaneously providing an incentive for efficiency and to reduce the need for such a subsidy with more effective State policies relating to hospital finances. The recommendations are made in the context of an ongoing effort by the de Blasio Administration and the H+H leadership team to transform H+H, including efficiency increases, revenue maximization, and service improvement, and are intended to complement their efforts and progress.
Recommended City policy reforms are:
- The City Office of Management and Budget (OMB) and H+H leadership should develop a new approach to financial planning and budgeting. Multiyear goals should be set for increasing efficiency as evidenced in reduced unit costs such as lower cost per visit and per discharge and for added revenue based on benchmarks from safety net institutions and internal comparisons among H+H facilities. Illustrative calculations using the 2015-2017 data indicate this benchmarking approach could set a target operating deficit between $490 million and $1.8 billion lower than the actual average of $3 billion, and would permit significant reduction in the amount of the City subsidy needed to offset the deficit.
- Progress toward the benchmarks should be publicly monitored, and H+H leadership held accountable. Central and facility managers should have compensation incentives to meet targets and be accountable if they do not without sufficient mitigating circumstances.
Recommended State policy reforms are:
- Better target Medicaid supplemental payments to H+H and other facilities with the greatest need, and finance the nonfederal portion of these payments with State revenues rather than local intergovernmental transfers.
- Use more equitably the surplus operating revenue earned by large networks from commercial insurers to cross subsidize indigent care on a system wide as well as an intra-institutional basis. One strategy is to tap some of the large networks’ profits from commercial insurers to help finance the nonfederal portion of supplementary Medicaid payments.
- Better align Medicaid hospital payment rates to reasonable unit costs of services, and fund with better use of Medicaid supplemental payments, more equitably allocated high commercial insurance payments and other broad based sources.
The Sources of H+H’s Operating Deficit
Multiple factors can account for a health facility’s operating deficit: The facility can provide services to uninsured individuals whose payments for services are well below the cost of that care; public and private insurance programs may provide payments that are less than the cost of efficiently provided care; and it may be providing care in an inefficient manner that causes costs to exceed reasonable payments from insurance programs. The picture may be complex with these factors playing varying roles among types of services and insurance programs.
Data from New York facilities provided to the state and federal governments annually provide a basis for understanding this issue. The official submissions, known as Institutional Cost Reports, follow Generally Accepted Accounting Principles, and establish an operating deficit or surplus based on the difference between operating revenues (revenues such as insurance and government payments earned by providing services) and operating expenses (the costs related to providing those services). In order to avoid misleading findings due to a single year with unusual circumstances this analysis uses data for the three most recent years available (2015, 2016, and 2017) and presents their annual average.
In these years payments from private and public sources earned by providing services covered only 54 percent of H+H’s total operating expenses, averaging $6.5 billion, yielding an annual average operating deficit of $3 billion, or 46 percent (See Table 1.) Outpatient services were the dominant source of the deficit, accounting for 61 percent of the deficit compared to only 45 percent of expenses. Among outpatient services the emergency department accounted for about 7 percent of the deficit, mental health and substance abuse for 8 percent, and other clinics for 37 percent.
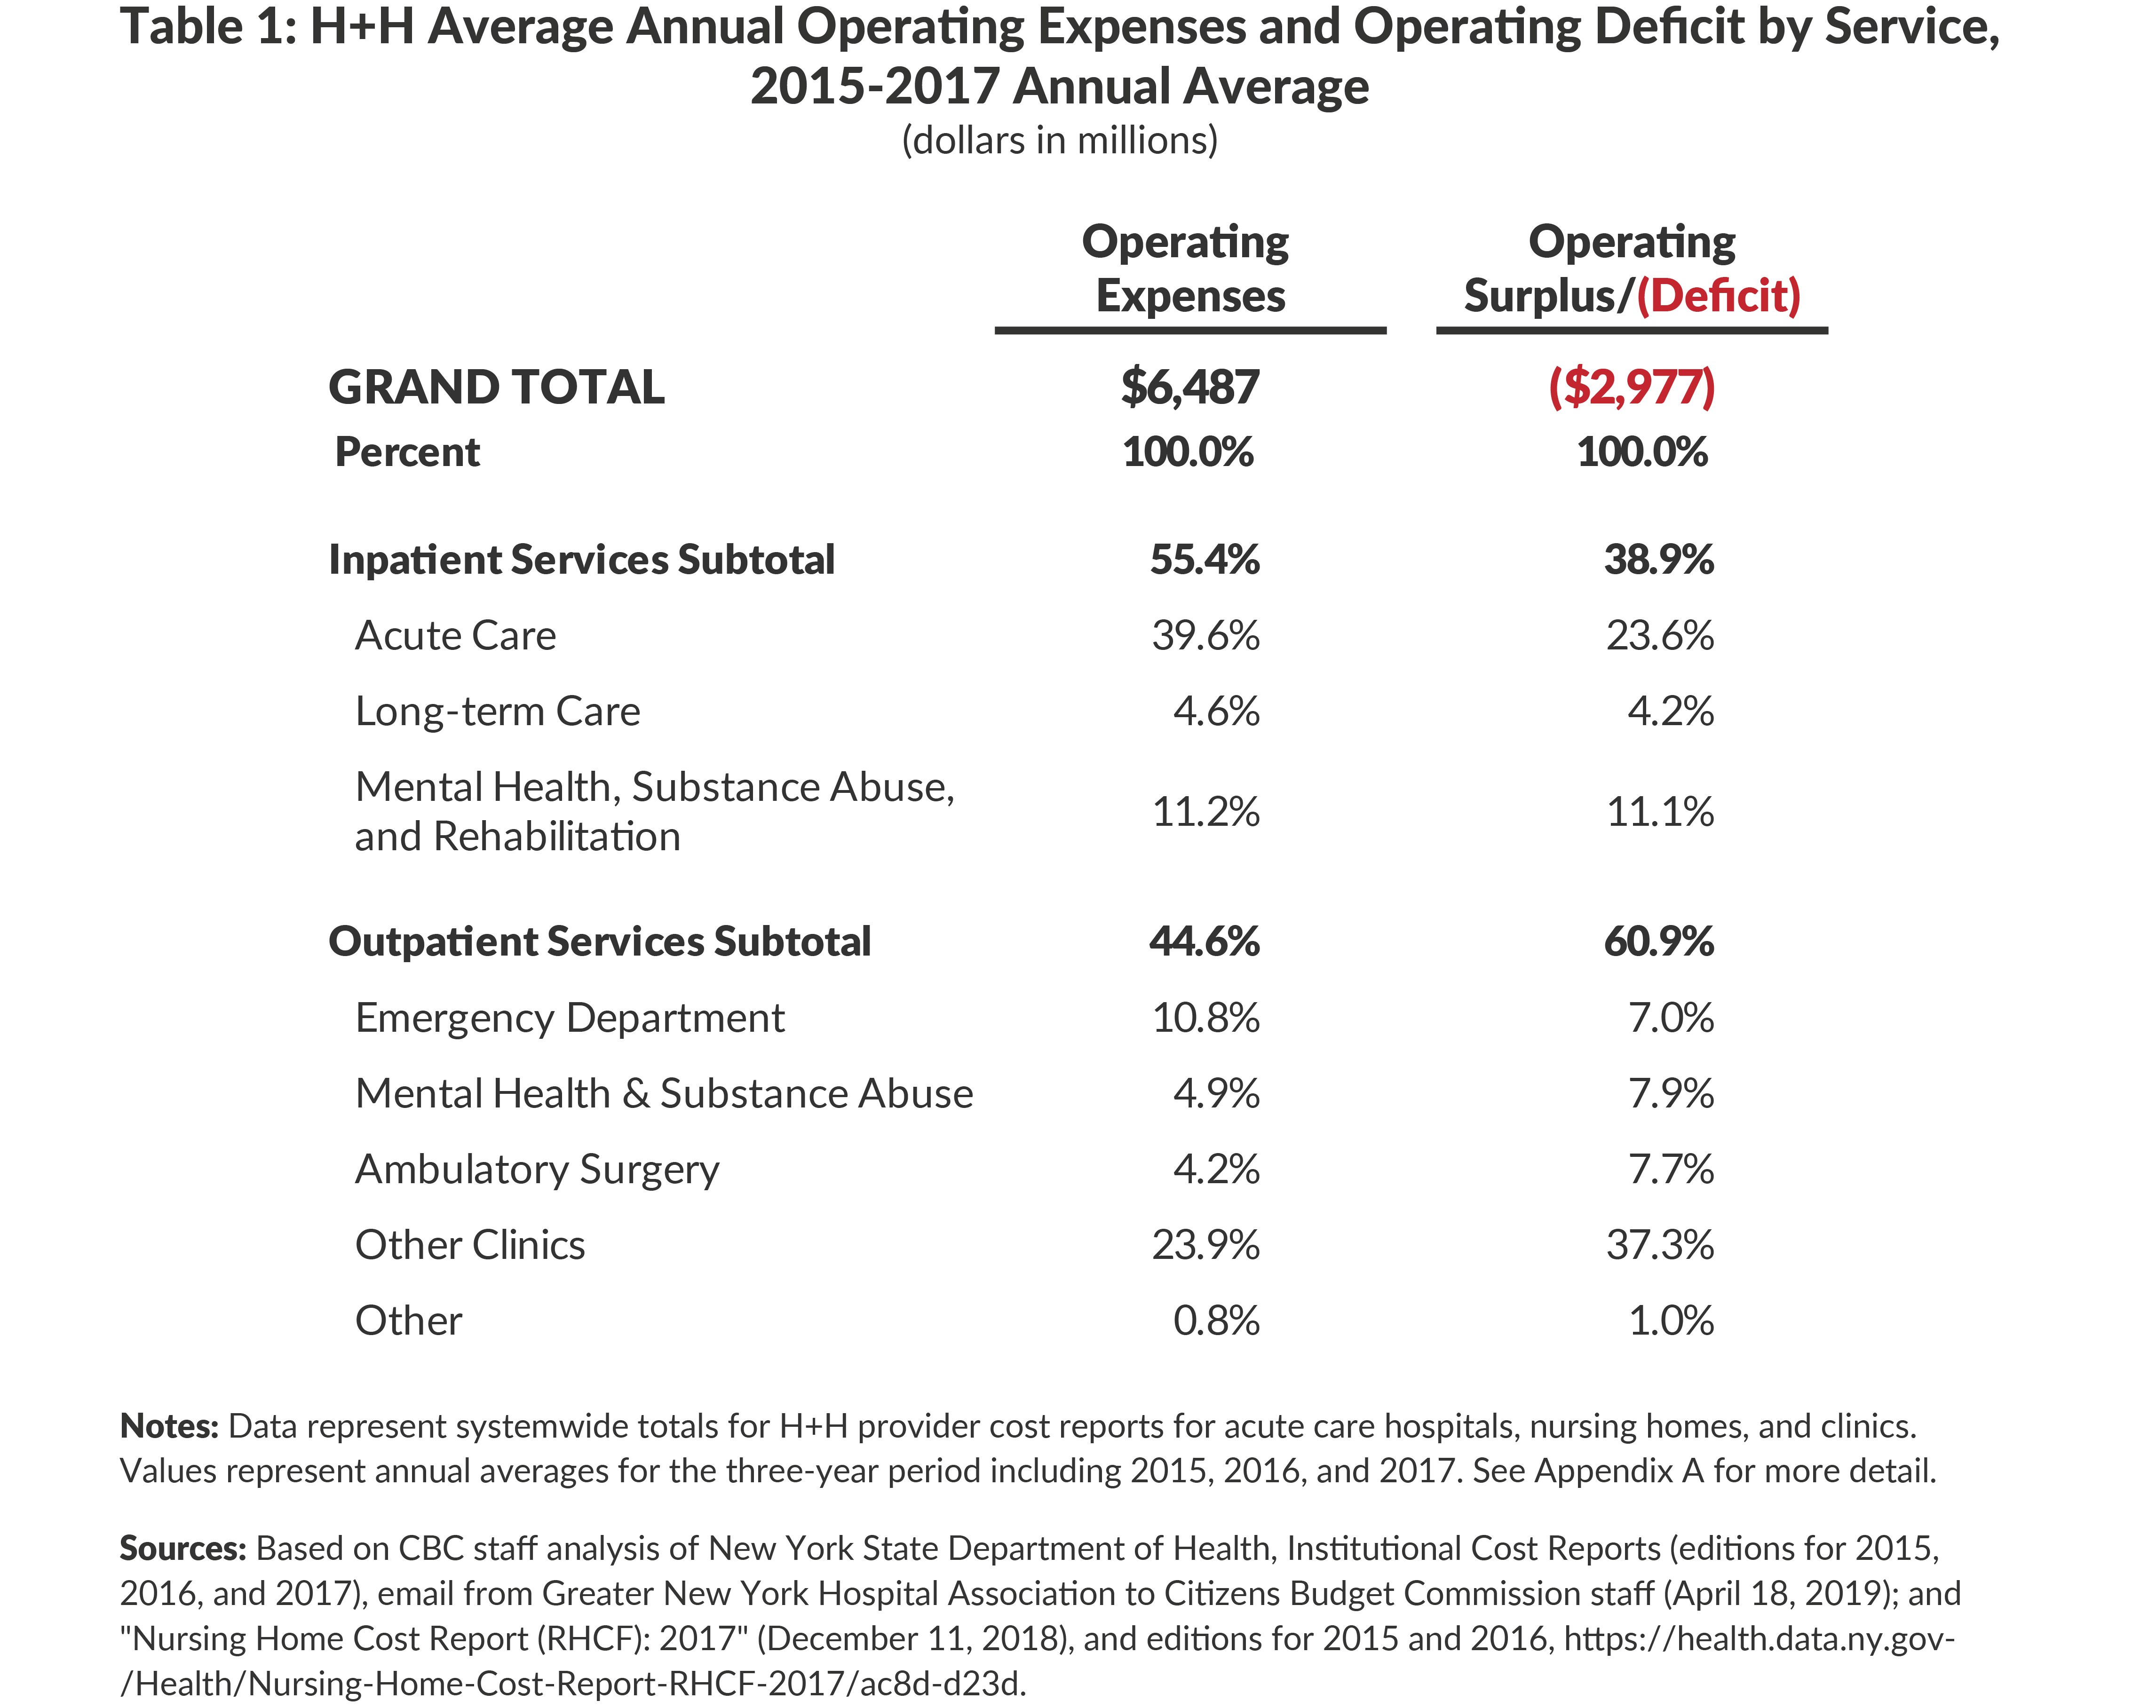
Inpatient services accounted for more than half operating expenses but 39 percent of the deficit. For long-term care and mental health and substance abuse services the share of expenses and deficit were similar; acute inpatient care generated nearly one-quarter of the total deficit and 40 percent of expenses.
Table 2 presents data relating to the source of the H+H deficit by insurance program. The uninsured are often cited as a major source of deficits, but they are not the largest source of the problem; while the relatively little revenue they generate covers only about 16 percent of their costs, they are responsible for approximately one-fifth of the operating deficit. Far more important is Medicaid’s payments for services; while these payments comprise the bulk of H+H’s operating revenue, they cover only 53 percent of the associated costs, causing 56 percent of the operating deficit. (These Medicaid payments exclude supplemental Medicaid payments that are not operating revenue and are discussed below.) Commercial insurance accounts for 11 percent of the deficit because its payments cover less than 42 percent of the associated costs. The federal Medicare program accounts for less than one-tenth the deficit with its payments covering more than 80 percent of the associated costs.4

The aggregate performance of H+H should be the basis for determining the City subsidy, but it should be noted fiscal performance varies widely among its separate facilities. Most important is the variability among the 11 acute care hospitals, which account for 91 percent of total H+H operating expenses. As shown in Table 3, the deficits at these facilities vary from 38 percent to 55 percent of operating expenses. Some of this variability likely is attributable to factors beyond hospital managers’ direct control, such as the mix of patients by type of insurance coverage and services they receive. But managerial efficiency likely also plays a role. To illustrate, the average cost of an admission (adjusted for the acuity of the patients’ conditions) varies from $13,003 to $19,682; similarly the cost of a clinic visit (not adjusted for acuity) varies from $355 to $595. In terms of revenue performance, the hospitals vary in the percent of associated cost they collect from Medicaid from 39 percent to 69 percent. (See Table 3.)

In sum, the available data indicate H+H loses money on all its service types, but outpatient services are the major source of its deficit with acute inpatient care also playing a large role. Similarly, H+H loses money on coverage from all forms of insurance, but Medicaid is the largest source of the deficit – over half— with the uninsured accounting for about one-fifth the deficit. Within H+H, hospitals vary notably in their performance with a wide range in scale of deficits, unit costs, and ability to cover costs from the largest payer, Medicaid.
Comparisons with Voluntary Institutions
Understanding the sources of H+H’s operating deficit is an important step in determining a reasonable local subsidy, but it can leave relevant policy questions unanswered. What should be the standard for determining the reasonable costs per admission or per visit that insurance programs should cover? What should be the standard for determining how much of those costs should be collected from each insurance program and from the uninsured?
One basis for setting standards is the performance of voluntary institutions in New York City. To explore the merits of this approach CBC staff analyzed data comparable to that for H+H from two sets of voluntary institutions: eight hospitals classified by the State as “Safety Net” institutions, meaning they serve predominantly indigent patients similar to H+H’s clients, and five large networks centered on academic medical centers that serve a different mix of patients with differing services but with reputations as high-quality institutions. In each case the tables below present an unweighted mean for each group of voluntary institutions, meaning each institution is counted equally regardless of its size. The individual institutions within each voluntary group exhibit notable variability and data for each institution is presented in Appendix B.
The fiscal performance of the voluntary facilities was better than that of H+H. Among the safety net institutions the deficit averaged 15 percent of operating expense, well below H+H’s 46 percent, with the worst performing of the eight facilities incurring a 29 percent average deficit and the best a deficit of 1 percent. Among the large networks, each of the facilities had an operating surplus with the average surplus 9 percent of operating expenses. (See Appendix B–Table 2).
The better performance among the voluntaries is in part related to the different mix of services they provide, devoting more to the better paid inpatient services and less to mental health and outpatient clinics. Among the large networks about 60 percent of expenses are devoted to inpatient services with only 2 percent within that subtotal devoted to mental health. The safety net hospitals have a similar share (61 percent) for inpatient services but more of this (5 percent) is for mental health; in contrast H+H allocates just 54 percent for inpatient services with more than 10 percent for mental health. For outpatient services H+H devotes a larger share of resources (23 percent ) to clinic visits than the 13 percent among both sets of voluntaries, but the share allocated to emergency departments and mental health outpatient services are similar for H+H and the safety nets with each well above the large network shares. (See Table 4.)
The voluntaries also have a different mix of revenues, reflecting the differing socioeconomic characteristics of the patients they serve. H+H and the safety nets have similar shares of revenue from the public programs, Medicaid and Medicare, 87 percent and 85 percent, respectively, figures well above that of the large networks, 52 percent. The large networks derive almost half (47 percent) of their revenue from commercial insurance, a proportion that dwarfs that of the safety nets (14 percent) and H+H (7 percent).
Although H+H and the safety net hospitals have a similarly high dependence on public insurance programs, the safety nets cover more of their associated costs with the revenue from these programs. While Medicaid covers only about 53 percent of associated costs for H+H, it covers 81 percent for safety net hospitals. Similarly, Medicare fully covers costs for the safety net hospitals, but only covers 81 percent at H+H. The difference between H+H and safety net hospitals is even greater for commercial insurance; H+H recovers only 42 percent of associated costs for these patients while the safety net proportion is 90 percent. (See Appendix B—Table 3.)
These difference are related to three factors: (1) the rates set by the public payers and negotiated with the commercial payers may be closer to cost for the safety net providers; (2) the safety nets may be more effective at billing and collecting from insurers than are H+H facilities due to better staffed finance departments, and better information technology and collection practices; and (3) the H+H commercial collections are largely from plans established under the State’s Essential Plan program and those plans’ rates are linked to relatively low Medicaid rates.

The strong positive fiscal performance of the large networks is due almost exclusively to the role of commercial insurance. Not only do the networks have a larger share of commercially insured patients, they also receive payment rates from the insurance companies that greatly exceed the associated costs. Among the networks the average revenue from commercial insurance exceeds the associated cost by 67 percent. This high profit margin accounts for the institutions’ operating surplus. The networks do better than H+H in covering cost from Medicaid and Medicare (77 percent and 89 percent, respectively), but still are losing money on patients with this type of coverage.
One reason the insurance payment rates and cost may be better matched for voluntary hospitals than for H+H is that costs may be relatively high at H+H. The evidence relating to this is difficult to interpret but suggests some H+H costs are high relative to the safety net institutions. For inpatient services it is possible to calculate costs that take into account the reported severity of the conditions for which patients are admitted. This “case-mix adjusted” cost per admission is $16,590 for H+H, notably higher than the average $12,033 for safety net facilities and $13,561 for the networks.5
However, this case-mix adjustment suffers from two weaknesses. First, the severity adjustment relates only to the medical condition of the patients but does not take into account socio-economic factors that may lead to longer hospital stays for a given condition. Patients who are homeless, have little or no family support, or suffer from severe mental illness may be harder to discharge to appropriate circumstances than others with identical medical conditions but better social supports. In these cases the cost may be higher per discharge because longer hospital stays are needed. To take these factors into account it may be reasonable to consider the (case-mix adjusted) cost per day for inpatient care rather than the cost per discharge. On this metric H+H is about 11 percent more costly on average than the safety net hospitals—$2,491 versus $2,242. (See Appendix B—Table 7.)
Second, the case-mix adjustment is based on the severity reported by the institutions in their billing documents. As noted above, H+H may be doing a less effective job in documenting conditions and procedures in medical records than the voluntaries, leading to an underestimate of the severity of the conditions H+H treats. A study using 2014 data found this to be an important factor; the case-mix data used for this CBC staff analysis are from 2017 and improvements were made in the intervening years that lessen the impact of this weakness.6 Moreover, H+H in 2018 increased efforts to improve billing practices and their case-mix index has been better reflecting severity in the latest years.7 If H+H’s fiscal year 2019 case-mix index were applied to the three-year average cost data, the difference between H+H and the safety net voluntaries would disappear on a per diem basis and be more than halved from 38 percent to 17 percent on a per discharge basis.8 However this updated comparison should be interpreted cautiously because it does not reflect changes in case mix at the voluntaries since 2017.
In sum, with respect to inpatient services, H+H costs appear to be relatively high but the gap may be narrowing. Compared to safety net institutions, case-mix adjusted cost per discharge was 38 percent higher before 2018 and remains at least about 17 percent higher in 2019. The higher cost is due primarily to longer lengths of stay (not higher per diem cost). Both types of institutions serve predominantly indigent patients; although the H+H patients may have more social hardships, the longer stays that drive the difference in cost per discharge may not be fully justified by these differences.
With respect to outpatient services the comparative data are less refined and should be interpreted only as suggestive. For emergency departments, per visit costs are 6 percent higher at H+H than the average at safety net institutions— $730 versus $690. The safety net average is raised by particularly high costs at one institution; the other hospitals have per visit costs averaging 19 percent below H+H. (See Appendix B—Table 7.) This metric is not adjusted for severity, and the extent to which H+H emergency departments serve more or less severe cases than those at safety net hospitals is not known.
For hospital outpatient clinics the cost per visit at H+H ($432) is also higher than at safety net hospitals ($373). (See Appendix B—Table 7.) This metric is not adjusted for the severity of cases treated, and it is not known how this might affect the comparison.
Policy Implications
The findings of this analysis of the sources of the H+H operating deficit have implications for policy at the City and State level. City leaders should use performance benchmarks to guide the determination of the size of the H+H subsidy and promote adherence to the guidelines by assessing and compensating individual facility leadership based on their performance. State policy should be revised to implement more equitably the goal of containing the State’s share of Medicaid costs; this requires revisions to the State’s supplemental Medicaid payment programs and altered regulation of the use of the surplus revenue some hospitals receive from commercial insurance companies.
City Policy Reforms
Throughout the history of H+H the City has been in the position of not only having to budget a subsidy at the start of the fiscal year but also having to back up the entity’s financial performance during the year. When an initially budgeted local subsidy falls short of H+H’s needs because H+H fails to achieve the revenue goals in its adopted budget or incurs expenses in excess of the adopted budget, then the City takes actions to offset the potential deficit. In the past this has sometimes required an increase in the local subsidy from the initially budgeted amount. For example, in 2017 the Office of the State Comptroller noted its review of H+H’s financial plan: “Last year, the Corporation’s financial situation was worse than originally projected. As a result, the City relieved the Corporation of $337 million in financial obligations, including debt service on bonds issued by the City on the Corporation’s behalf.”9 The source of this dilemma is a combination of imperfect approaches to setting the initial H+H budget and limited actions to enforce or encourage adherence to the budget.
The City’s annual budget sets an H+H subsidy based on a four-year financial plan prepared by H+H and reviewed by the City Office of Management and Budget (OMB). The financial plan is presented in a different format than is used in the Institutional Cost Reports and in H+H’s audited financial statements. The plan establishes a baseline projection of total expenses and revenues (including operating revenues, supplementary Medicaid payments and subsidies) and a resulting gap. It also identifies “initiatives” affecting revenues and expenses that are expected to close or narrow the gap.
Recent financial plans have been designed to implement a transformation strategy designed by the current mayoral administration in April 2016: One New York: Health Care For Our Neighborhoods: Transforming Health + Hospitals. The plan has four broad goals, one of which is to transform Health + Hospitals into a high-performing health system. In April 2017 a Commission appointed by the Mayor issued recommendations for achieving this goal, and in 2018 the Mayor appointed a new H+H President who has brought in new leadership.
Table 5 presents the latest (May 2019) H+H financial plan. It has baseline gaps that grow from $1.3 billion in 2020 to $2.0 billion in 2023. The plan does not include publicly available information about the assumptions behind the baseline projections, but the baseline gaps are calculated after taking into account a budgeted local subsidy based on sustaining levels in previous years. With respect to revenues, combined operating and supplementary revenues are nearly stable, and a total revenue decline results primarily from a drop in supplemental payments in fiscal year 2021 due to cuts in the federal Disproportionate Share program. All categories of baseline expense increase with the four-year growth totaling $469 million or 5.6 percent. The baseline projections are not explicitly related to broader market trends in which the volume of inpatient care system-wide has been declining and H+H market share for some inpatient services also has been declining. In this context stable revenues may be an optimistic assumption and declining volume could increase unit costs without appropriate staffing adjustments.
The plan identifies initiatives with an annual value that grows from $1.4 billion in fiscal year 2020 to $1.6 billion in fiscal year 2023. The initiatives provide a modest surplus of $73 million in fiscal year 2020, but leave a projected $99 million loss in fiscal year 2021 that grows to $399 million in fiscal year 2023. The losses are expected to be covered from H+H’s cash reserves, but the plan drains these reserves from $854 million at the end of fiscal year 2020 to just $83 million at the end of fiscal year 2023.
The plan’s initiatives are mostly aimed at increasing revenues. Revenue initiatives are $1,027 million in fiscal year 2023, fully 64 percent of the initiatives’ total. The bulk of the new revenues, $710 million annually, are from “insurance initiatives.” These efforts rely heavily on improved billing practices and also include getting more currently uninsured patients to be covered by available programs, expanding the Metro Plus program of H+H sponsored insurance, and better payments from managed care companies.10 This is an appropriate goal given the earlier finding that H+H collects a lower share of associated expenses from insurers than do voluntary institutions. However, gains of this magnitude require not only changes in H+H billing and collection practices, but also renegotiated rates with private insurance companies.While H+H leaders are advocating for such changes, the policies remain outside their direct control.
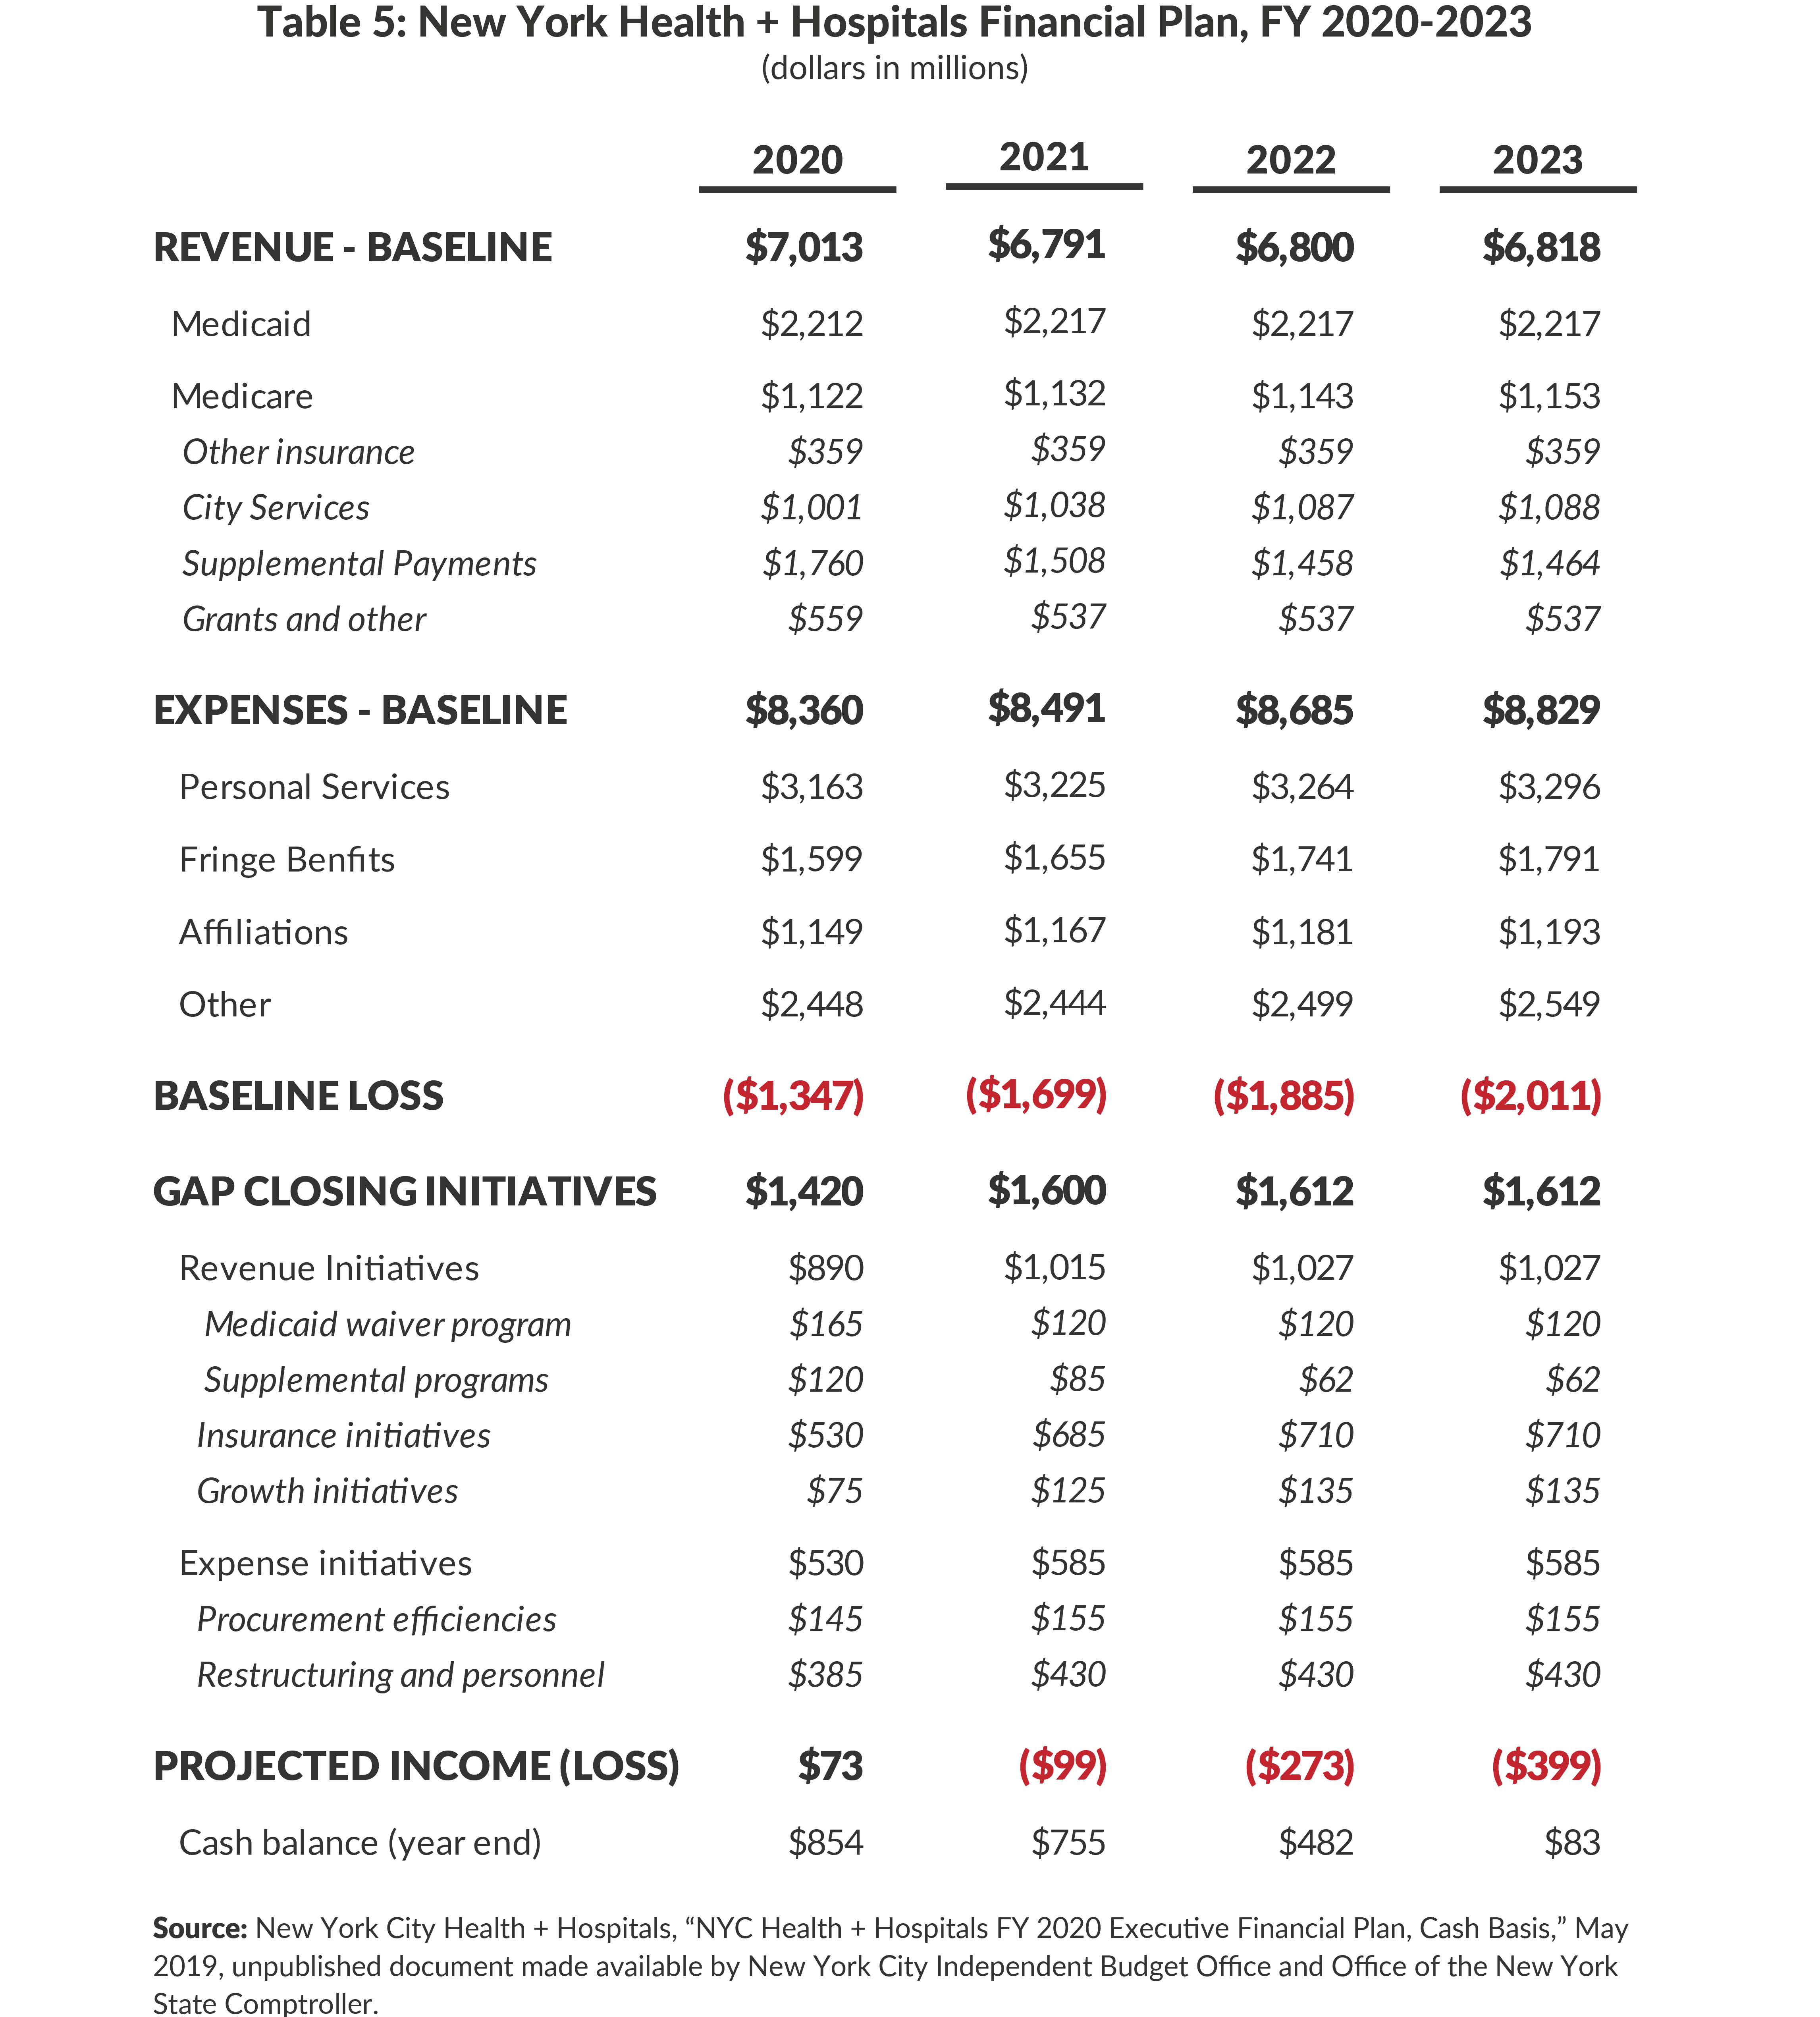
The other H+H revenue initiatives are additional funding from a State-administered Medicaid waiver program and a larger share of the supplemental payments administered by the State. Such gains are likely to require State legislative action and federal approval. The “growth” initiatives are added gross revenue expected from expansion of certain service activities.
The expense initiatives total $585 million in fiscal year 2023. They consist of $155 million in procurement improvements and $430 million in unspecified “restructuring and personnel initiatives.” Explicit actions to reduce inpatient capacity and consolidate services are not identified.
Efficiencies are an appropriate goal given the earlier finding that H+H unit costs exceed those of voluntary safety net institutions. If the voluntary safety net institutions are taken as a benchmark then annual savings from matching their inpatient unit cost (case mix adjusted discharge) would be between an estimated 38 percent and 17 percent depending on the extent to which H+H has improved its case mix reporting in recent years. Applying this percent savings to the past three-year average inpatient spending yields savings ranging from nearly $1.2 billion to $545 million; applied to projected future spending the savings would be even greater.11 Additional efficiencies may be possible by lowering outpatient unit costs, since outpatient services comprise a major share of H+H expenses and unit costs vary notably among H+H institutions. Based on these estimates, the H+H initiatives are at a reasonable scale and could be even greater.
Embedded in the financial plan are assumptions about implementation of the Mayoral initiative NYC Care. Announced in January 2019, the program will be phased-in beginning in fiscal year 2020.12 Under the program uninsured individuals, many of whom are unauthorized immigrants ineligible for other public programs, will be able to receive ambulatory care at H+H clinics and neighborhood health centers, including primary care and preventive services. The program is intended to be an improvement in access to care for the estimated 600,000 uninsured, who currently often do not receive preventive and primary care, and receive treatment for acute conditions at emergency rooms. Implementing the program will require H+H to hire new primary care physicians and other providers and expand its volume of these services with associated added cost. The services to uninsured patients will yield operating revenues that are only a fraction of the incremental costs, adding to the required City subsidy. The Mayor has pledged $100 million annually in additional City funding for full implementation of the program, but an accounting of the added cost versus revenues and subsidy is not publicly available.
Overall the H+H financial plan and its gap closing initiatives can be judged both as inadequate and overly optimistic. It is inadequate in the sense that it does not fully close projected budget gaps and drains H+H reserves, pointing to future circumstances requiring even greater local subsidies or significant service cuts. More initiatives, particularly relating to lowering expenses, are needed to address this shortcoming. At the same time the plan is overly optimistic in the sense that its goals for revenue enhancements require not only substantial improvement in H+H performance but also require changes in State and federal policies for which H+H and municipal leadership may advocate but are beyond their control and subject to counter pressures.
H+H and OMB leadership should develop a new approach to financial planning and budgeting. Multiyear goals should be set for reaching reasonable unit costs for major service lines and revenue targets for each major payment source as a share for associated expenses. These goals should be based on benchmarks derived from comparative analysis with safety net hospitals or internal comparison among H+H facilities. The approach used in this report’s analysis requires refinement, but it suggests how financial plan targets can be set. Table 6 provides illustrative deficit targets using the data from 2015-2017 and four benchmarking options. Two options benchmark to voluntary safety net hospitals; one targets the revenue recovery ratios by service line and one the revenue recovery ratios by payer. In each case H+H could move toward the benchmark target by a combination of better revenue billing and collection practices and staffing or other expenditure reductions to bring its unit costs closer to safety net benchmarks. The calculations indicate benchmarking to these institutions would set a goal of lowering the operating deficit by $1.3 billion to $1.8 billion, or 45 percent to 61 percent.
The other two options benchmark to a well performing institution within the H+H system. As shown earlier in Table 3, Elmhurst Hospital has the smallest operating deficit among H+H’s 11 acute care hospitals. Benchmarking to Elmhurst’s revenue recovery ratios by service line and by payer would reduce the H+H systemwide deficit by $546 million to $490 million, or 18 percent to 16 percent.

Once goals are set, progress should be monitored and leadership held accountable. This process should focus on individual facilities with their unit cost and revenue metrics regularly and publicly reported and compared to budgeted goals. Leadership teams at each facility should have incentives to meet and exceed targets. As a public authority H+H’s compensation for executives is not restricted by civil service pay scales; they can have compensation arrangements that include bonuses based on annual performance. Such arrangements should be tried as an approach to improve performance; conversely continued tenure in leadership in part could depend on meeting performance goals, conditioned on appropriate consideration of mitigating circumstances.
State Policy Reforms
The scale of a necessary and reasonable City subsidy is determined in large part by State policies governing payments to hospitals. A priority goal of State policy has been to contain total Medicaid spending and especially the State share of Medicaid costs. A major instrument for implementing this goal is setting of Medicaid payment rates to hospitals at relatively low levels. As this report’s analysis indicates, at all types of hospitals Medicaid revenues fall short of associated service costs. While this gap likely could be narrowed, particularly at H+H, by achieving more efficient unit costs, the evidence points to insufficient payments from Medicaid as a major source of operating deficits at H+H and voluntary safety net institutions. The State is aware of and concerned about the consequences of the relatively low Medicaid rates. Two factors offset the associated losses and help contain the State’s fiscal obligations:
- Commercial insurers pay hospitals at rates in excess of associated costs, generating surpluses to offset Medicaid losses.
- The State provides about $5 billion annually in supplemental Medicaid payments to hospitals (and some ambulatory facilities) with much of the money going to financially distressed hospitals.13
- In recent years the State added a new program, the Value-Based Payment Quality Improvement Program or VBPQIP, to the longer standing Disproportionate Share (DSH) and Upper Payment Limit (UPL) programs. These programs are funded half by the federal government. Although the State funds the non-federal portion of these programs for State institutions and voluntary hospitals, the State requires the local public hospitals who are large beneficiaries to pay the nonfederal share with transfers from their local governments rather than with State funds. The bulk of these supplemental payments now offset losses related to low Medicaid payment rates rather than cover the cost of uncompensated care to the uninsured (a primary purpose of the original DSH program).
The State should develop and pursue a multiyear plan for more equitable financing of hospital services including changes in three areas: Medicaid supplemental payments, commercial insurance payments, and Medicaid rates.
The State should redesign the Medicaid supplemental payment programs. The State’s management of these programs has two weaknesses. First, the funds are not well targeted to the institutions doing the most for Medicaid and uninsured patients. While the bulk of the funds go to appropriate institutions, the allocation formulas used also direct significant funds to well-financed hospitals with relatively small volumes of indigent care losses. This flaw is documented in several reports and was addressed (but not resolved) by a State appointed working group.14 The pattern also is evident in the data assembled for this report. Hospital financial reports present these supplemental payments as “below the line” or non-operating revenue that helps offset operating deficits (or add to an operating surplus). In the three-year period examined, the supplemental payments on average covered 75 percent of H+H’s operating deficit, exceeded the operating deficit of the safety net hospitals, and increased the large networks’ operating surplus by 13 percent. (See Appendix Table 6.) More appropriate distribution of these funds could reduce the need for a City subsidy to H+H and could free some currently poorly targeted allocations to fund more reasonable Medicaid service payment rates.
The financing of the nonfederal potion of these supplemental funds also should be revised. Like other Medicaid payments, these are funded half by the federal government and half by sources set by the State. For H+H (and other local public institutions), the nonfederal share of most payments must be provided by the local government. In the case of H+H, the City provides the nonfederal share of most of its supplemental payments; this is about $1.1 billion annually and comprises a major portion of the local subsidy.15 In addition some nonfederal funds are derived from State taxes on hospital services, in effect requiring the facilities to provide half the total funding distributed under one of the programs.16 Reducing reliance on local tax funds and increasing reliance on the broader based statewide tax base would make these programs more equitably financed and lower the local subsidy.
The role that commercial insurance plays in New York’s hospital financing system suggests that payments from this source should be used more equitably to finance indigent care. Current policy allows insurance companies and hospitals to negotiate the hospital rates and keep them confidential. The large network facilities, which are a competitive attraction under most plans, are able to negotiate highly favorable rates.17 As indicated earlier, the average profit margin for large networks from commercial insurance is 67 percent, and this accounts for most of their surplus. In contrast, H+H and some safety net hospitals have notably less bargaining power with commercial plans and receive less than full cost from commercial plans. In this manner, commercial insurance reinforces a pattern among institutions in which “the rich get richer, and the poor get poorer.”
A more equitable strategy for the State to consider is to redistribute more broadly the surplus from commercial insurance payments. Current policy allows these revenues to underwrite Medicaid losses at hospitals with sufficient bargaining leverage to negotiate favorable rates, but it does not provide substantial benefits to the safety net and H+H hospitals with little leverage and relatively few commercially insured patients. Mechanisms should be developed to extend this cross-subsidy from commercial insurance across institutions, not just within institutions. One strategy could be to transfer to the State in some way consistent with federal law commercial insurance surplus revenues of hospitals not meeting a threshold of indigent care volume in order to help finance the nonfederal portion of Medicaid supplemental payments targeted to the hospitals with large indigent care volumes or increase Medicaid rates.
Finally, increasing Medicaid payment rates for some services to reflect more closely reasonable costs is a desirably longer-term goal. The policy reforms outlined above could provide resources to help meet this goal and offset some of the otherwise added State costs. In addition resources can be reallocated by identifying savings in long-term care services, a benefit for which New York has exceptionally high expenses. Medicaid payments are at least 50 percent financed by federal funds. To the extent additional resources are need to reasonably increase some payment rates, it is widely recognized that financing redistributive activities such as care for the indigent is more appropriately done from state and federal tax bases rather than local sources.18
Download Report
A New Approach to Funding New York City Health + HospitalsAPPENDIX A: Methodology and Sources for Analysis
Hospital Analysis
Summary
All analysis (except case mix adjustment) was based on data generated from hospital institutional cost reports (ICR). All data presented in this analysis represent three-year averages for the period including 2015, 2016, and 2017 reporting years. The raw ICR data was provided in machine readable form to CBC by the Greater New York Hospital Association (GNYHA) on April 18, 2019. All analysis and interpretation of the raw data was completed by CBC staff. The following ICR exhibits were utilized for this analysis: Exhibit 26A, Exhibit 32, Exhibit 33, Exhibit 46, and All Cost Traceback. Relevant data points were calculated as follows:
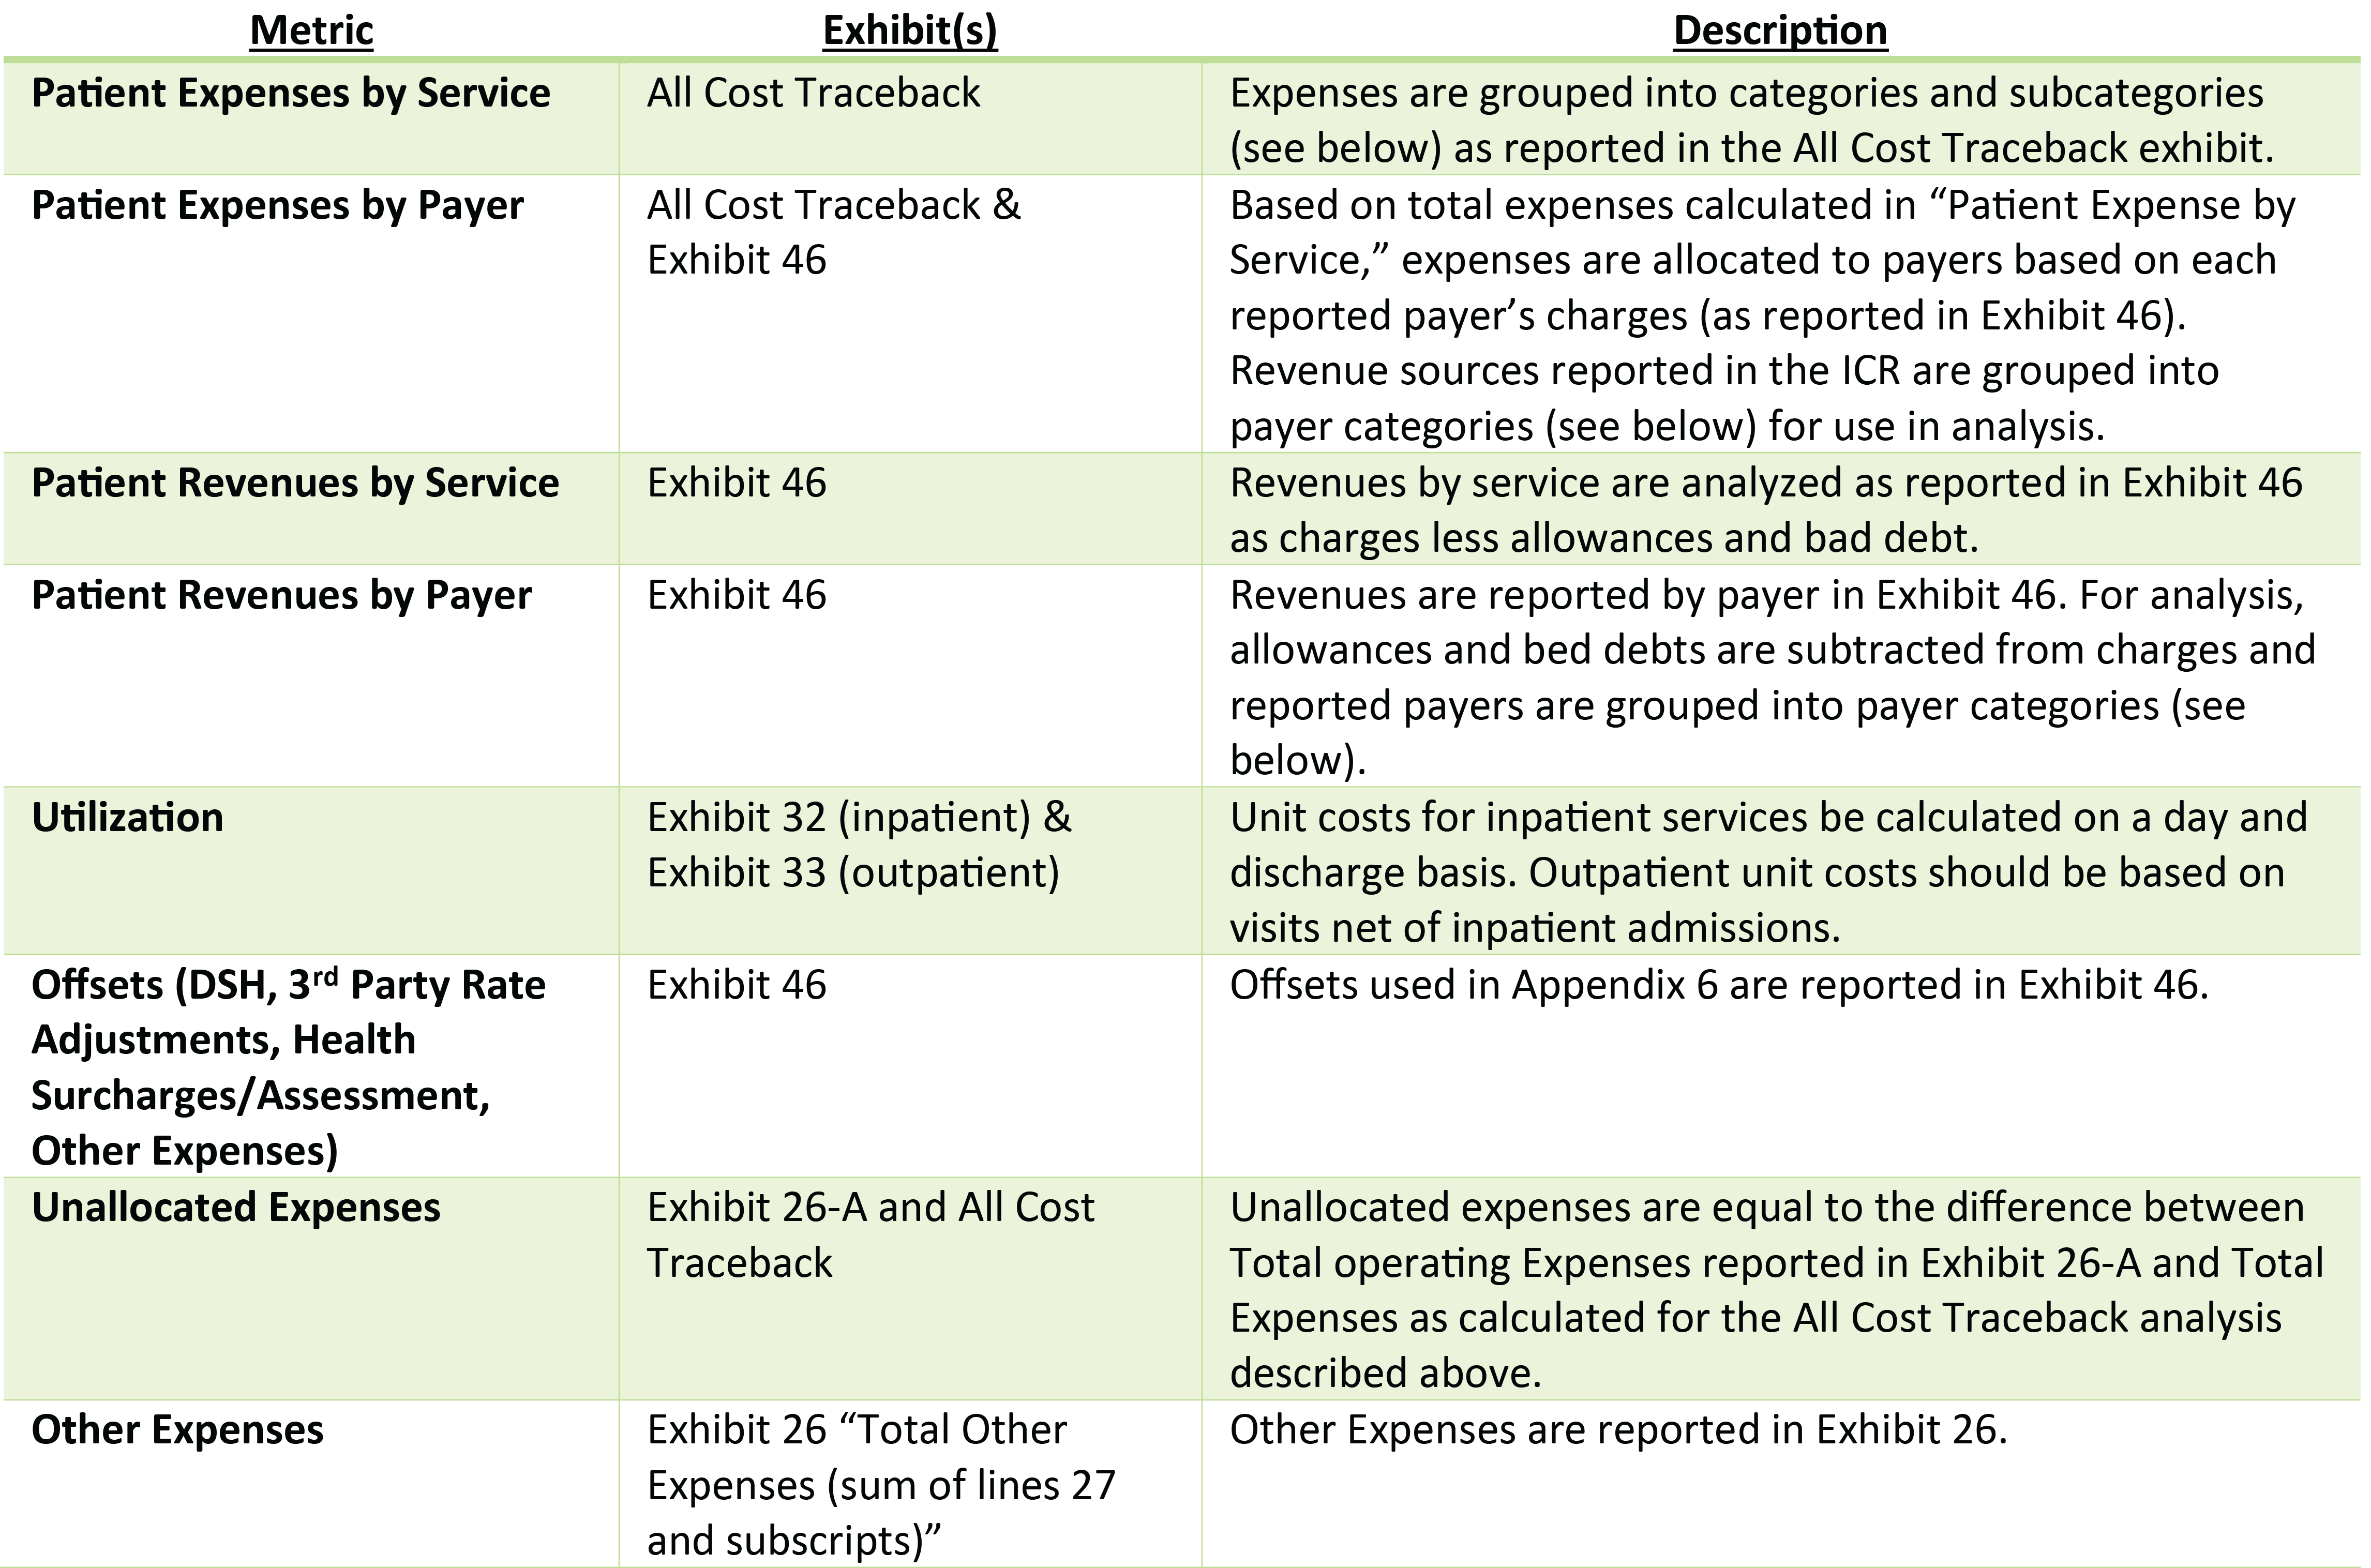
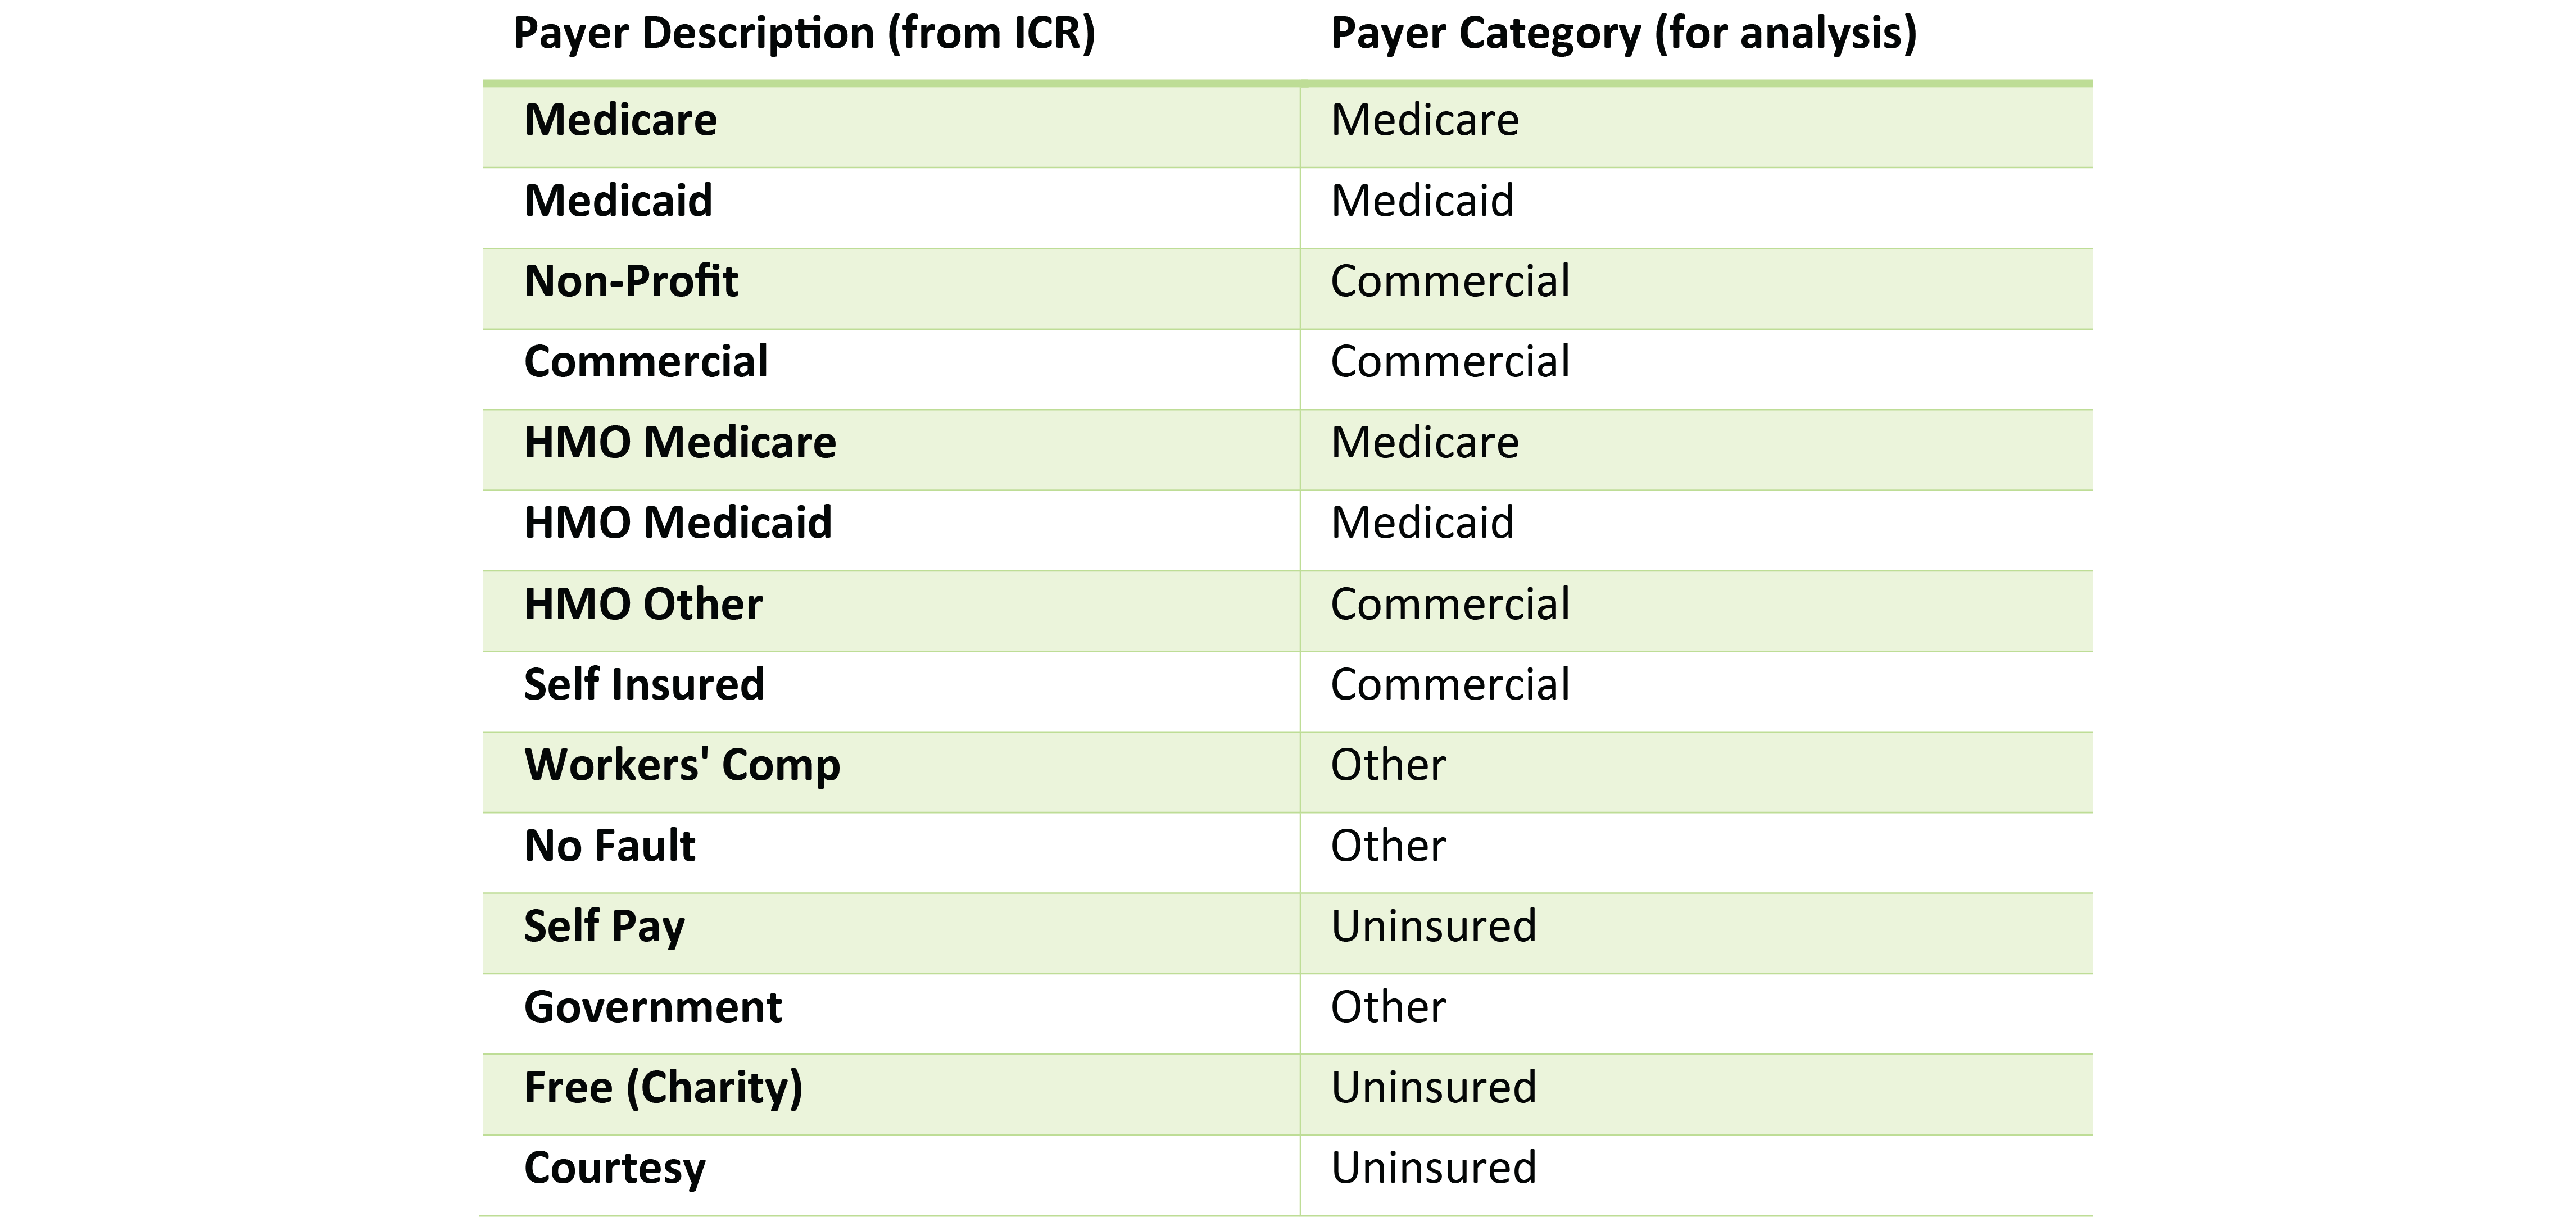
Service and payer mapping: for this analysis, both expenses and revenues were mapped to each of services and payers. The mapping of ICR data to each of the presented categories was completed as follows:
Mapping of Payers – Hospitals
Mapping of Services – Hospitals
Case Mix Adjustment
A case mix adjustment was applied to inpatient hospital data presented in Table 3, Appendix B Table 7, and Appendix B Table 8. The case mix adjustment was calculated using utilization data described above, discharge data reported through the Statewide Planning and Research Cooperative System (SPARCS) for 2016, and APR-DRG weights reported by the New York State Department of Health. For each facility, APR-DRG weights were applied to discharges from SPARCS, providing a case mix adjustment factor for each facility. The case mix adjustment factor was applied to per-discharge and per-day costs calculated from ICR data.
Mapping of Providers
Hospitals within New York City were included in this analysis. All 11 hospitals of the H+H system were included as well as H+H’s long-term and free-standing ambulatory care facilities. The major network hospitals located in New York City were included for five major systems: Lenox Hill (Northwell’s New York City facility), Monetfiore, Mt. Sinai, NY Presbyterian, and New York University. Only those hospitals of a network that are fully members of the relevant system and which are located within the five boroughs were included. For certain Provider IDs, multiple facility locations are captured. This includes the Weill Cornell Medical Center (previous ID 7002025) and Columbia University Medical Center (previous ID 7002030), which are both merged under New York-Presbyterian Hospital (ID 7002054). This also effects NYU Lutheran Medical Center (previous ID 7001019) which was merged under NYU Langone Tisch Hospital (ID 7002053). The Safety Net hospitals group is populated by hospitals within New York City listed as enhanced safety net hospitals in an email from GNYHA staff to CBC staff. Mt. Sinai Beth Israel Hospital (ID 7002002) would also qualify as a safety net provider, but is grouped with Mt. Sinai in the Major Network category.
Nursing Home Analysis
Summary
The nursing home analysis was conducted utilizing three-year average data from nursing home cost reports obtained through the Open Health Data portal. Data included in this report represent three year averages for report years 2015, 2016, and 2017. This report analyzes data for three H+H nursing homes: McKinney, Gouverneur, and Sea View. For each provider in all years, all services relate to the acute category of service and the long-term care subcategory of service. Expenses are reported in Schedule 6 of the cost reports as totals, and are allocated to payers based on utilization. Revenue by payer is reported in Schedule 7 of the cost reports and mapped to payers as summarized below. Utilization is reported in terms of patient days by payer in Part I and mapped to payers as summarized below. No case mix adjustments are made to nursing home utilization data.
Mapping of Revenue and Utilization to Payers – Nursing Homes

Clinic Analysis
Summary
The clinic analysis was conducted based on data from clinic financial statements provided by the New York State Department of Health in response to a Freedom of Information Law (FOIL) request submitted by Citizens Budget Commission staff. Data included in this report represent three-year averages for report years 2015, 2016, and 2017. This report analyzes data for six H+H clinics: Belvis, Cumberland, East New York, Gouverneur, Morrisania, and Renaissance. For each provider in all years, all services relate to the clinic category of service. Expenses are reported in financial statements as totals, and are allocated to payers based on utilization. Revenue by payer is reported in the financial statements, with mapping of revenues by payer as summarized in the table below. Utilization is reported in terms of visits and mapped to payers as summarized below. No case mix adjustments are made to nursing home utilization data.
Mapping of Revenue and Utilization to Payers – Clinic

APPENDIX B
Download Appendix B
H+H Report Appendix BPress Release
The Citizens Budget Commission (CBC) today released “A New Approach to Funding New York City Health + Hospitals.” The report recommends a benchmarking approach to bring costs and revenues in line with other “safety net” hospital systems in order to reduce the large annual City subsidy needed to operate New York City Health + Hospitals (H+H). The report also recommends changes to State policies to better support H+H.
H+H operates with a financial deficit that has required growing and sometimes unpredictable subsidies. The deficit is due largely to reimbursement from Medicaid, Medicare, and commercial insurance. H+H recovers a smaller share of the associated cost than both large hospital networks and “safety net” institutions. The discrepancy is largest on commercial insurance: H+H recovered an average of 42 percent from commercial insurance compared to 90 percent for safety net institutions and 167 percent for large networks between 2015 and 2017. These rates allow large hospital networks to subsidize care for patients who are uninsured and covered by Medicaid, and allow some to generate sizable surpluses.
While H+H provides care for a significant portion of the city’s uninsured individuals, 56 percent of its deficit is due to care provided to Medicaid patients. H+H recovers only 54 percent of its costs for Medicaid enrollees, compared to 81 percent for safety net hospitals and 77 percent for large networks. Furthermore, while H+H provides a significant portion of inpatient care to the City’s uninsured and Medicaid population, 61 percent of its deficit is due to outpatient services.
“H+H is on the right track; it is starting to increase revenue recovery and control spending. But it should be able to do more, like its counterparts,” said Andrew Rein, President of the Citizens Budget Commission. “Its subsidy should not be set based on whatever results happen to be achieved. Benchmarking H+H to safety net hospitals sets the right bar to improve financial performance and stabilize and reduce the need for City subsidy.”
In order to reduce the H+H deficit, CBC recommends the following:
- Develop a new approach to financial planning and budgeting. H+H leadership should set multiyear goals for increasing efficiency by setting targets for reduced unit costs (for example, lower cost per visit and per discharge) and for added revenue based on benchmarks from safety net institutions. An alternative approach would benchmark H+H hospitals among the highest performing H+H facilities.
- Progress toward the benchmarks should be publicly monitored and H+H leadership held accountable. Central and facility managers should have compensation incentives to meet targets and, absent mitigating circumstances, be held accountable if they do not.
- Redistribute more broadly the surplus from commercial insurance payments. Current policy allows these revenues to underwrite Medicaid losses at hospitals with sufficient bargaining leverage to negotiate favorable rates and a large commercially insured population, but it does not provide substantial benefits to the safety net and H+H hospitals with little leverage and relatively few commercially insured patients. Mechanisms should be developed to extend this cross-subsidy from commercial insurance across institutions, not just within institutions.
- Better target the $5 billion in Medicaid supplemental payments to H+H and other safety net institutions. The State should redesign its Medicaid supplemental payment programs, which are not well targeted to the institutions doing the most for Medicaid and uninsured patients. While the bulk of the funds go to appropriate institutions, the allocation formulas used also direct significant funds to well-financed hospitals with relatively small volumes of indigent care losses. The pattern is evident in the report’s data. These supplemental payments are “below the line” or non-operating revenue that helps offset operating deficits (or add to an operating surplus). In the three-year period examined, the supplemental payments on average covered 75 percent of H+H’s operating deficit, exceeded the operating deficit of the safety net hospitals, and increased the large networks’ operating surplus by 13 percent. More appropriate distribution of these funds could reduce the need for a City subsidy to H+H and could free some currently poorly targeted allocations to fund more reasonable Medicaid service payment rates.
Footnotes
- Data based on 2014 values reported by H+H in 2016 Transformation Plan. See New York City, One New York – Health Care for Our Neighborhoods (April 26, 2016), p. 26, www1.nyc.gov/assets/home/downloads/pdf/reports/2016/Health-and-Hospitals-Report.pdf.
- The fiscal year 2009 figure is from Erin Kelly, Stopgap Measures Aid NYC Health + Hospitals, (Independent Budget Office, March 2016), https://ibo.nyc.ny.us/iboreports/stopgap-methods-aid-nyc-health-hospitals-march-2016.pdf. Fiscal year 2019 and 2023 figures are from Melinda Elias, NYC Health + Hospitals: On the Mend?, (Independent Budget Office, March 2019), https://ibo.nyc.ny.us/iboreports/nyc-health-hospitals-on-the-mend-fopb-march-2019.pdf. The figures are for net payments from the City to H+H and include some payments for services to the City for correctional services.
- Recent reports addressing this and related H+H issues are Office of the City Comptroller, Holes in the Safety Net: Obamacare and the Future of New York City’s Health & Hospitals Corporation, (May 2015), https://comptroller.nyc.gov/wp-content/uploads/documents/Holes_in_the_Safety_Net.pdf; See New York City, One New York – Health Care for Our Neighborhoods (April 26, 2016), p. 26, www1.nyc.gov/assets/home/downloads/pdf/reports/2016/Health-and-Hospitals-Report.pdf; and Commission on Health Care for Our Neighborhoods, Recommendations on NYC Health + Hospitals’ Transformation (March 2017), www.nychealthandhospitals.org/transformation-blue-ribbon-commission/.
- See Appendix A for methodology.
- See Appendix A for methodology.
- Barbara Caress and James Parrott, On Restructuring the NYC Health+Hospitals Corporation: Preserving and Expanding Access to Care for All New Yorkers, Report to the New York State Nurses Association (October 2017), pp.17-19, www.nysna.org/sites/default/files/attach/419/2017/09/RestructuringH%2BH_Final.pdf.
- Revenue collection improvements coincided with implementation of a systemwide electronic health records system, and improvements in revenue cycle management were swift and significant. See Kevin Lynch, “New York City Council Oversight Hearing: Electronic Health Records” (New York City Health+Hospitals Testimony to the New York City Council, November 2019), www.nychealthandhospitals.org/new-york-city-council-oversight-hearing-electronic-health-records/.
- The H+H case mix index for 2018 and 2019 were supplied by H+H staff in an e-mail dated September 26, 2019.
- Office of the New York State Comptroller, Review of the Financial Plan of the City of New York, Report 11-2017, March 2017, p.30.
- New York City Health + Hospitals, email to Citizens Budget Commission staff (August 21, 2019).
- Calculation based on respective savings of 37.9 percent and 17.4 percent applied to estimated annual inpatient expenses of $3,203 million. See Appendix Table 7 for data sources and methods.
- Office of the Mayor, City of New York, “Mayor de Blasio Announces Plan to Guarantee Health Care for all New Yorkers,” Press Release, January 8, 2019.
- Patrick Orecki, Medicaid Supplemental Payments: The Alphabet Soup of Programs Sustaining Ailing Hospitals Faces Risks and Needs Reform, (Citizens Budget Commission, August 2017).
- See Patrick Orecki, “Medicaid Supplemental Payments: State Workgroup Makes Limited Progress on Part of the Problem” (Citizens Budget Commission Blog, February 15, 2019), https://cbcny.org/research/medicaid-supplemental-payments-0.
- See Patrick Orecki, “Medicaid Supplemental Payments: State Workgroup Makes Limited Progress on Part of the Problem” (Citizens Budget Commission Blog, February 15, 2019), https://cbcny.org/research/medicaid-supplemental-payments-0.
- See Patrick Orecki, Time to Rethink HCRA Taxes, (Citizens Budget Commission, April 2017); and Bill Hammond, Hooked on HCRA: New York’s 20-Year Health Tax Habit (Empire Center for Public Policy, January 2017), www.empirecenter.org/wp-content/uploads/2017/01/HookedOnHCRA-1.pdf.
- New York State Health Foundation, Why Are Hospital Prices Different? An Explanation of New York Hospital Reimbursement (December 2016), p. 6, http://nyshealthfoundation.org/uploads/resources/an-examination-of-new-york-hospital-reimbursement-dec-2016.pdf.
- See Matthew Sollars, A Poor Way to Pay for Medicaid: Why New York Should Eliminate Local Funding for Medicaid (Citizens Budget Commission, December 2011), https://cbcny.org/sites/default/files/media/files/A%20Poor%20Way%20to%20Pay%20for%20Medicaid.pdf; and Patrick Orecki, Still a Poor Way to Pay for Medicaid, (Citizens Budget Commission, October 2018), https://cbcny.org/research/still-poor-way-pay-medicaid.