New York Taxes: Layers of Liability
In fiscal years 2021 and 2022 New York State faces potential gaps of $8 billion and $15 billion , respectively, while New York City confronts potential gaps of $1.6 billion and $6.9 billion.1 Improving the fiscal outlook for both the State and the City primarily requires controlling expenditures and advocating for federal aid. Some State and City policymakers have suggested increasing taxes; however, any consideration of tax increases should include the impact on State and local economic competitiveness. In particular, City taxpayers in some cases are subject to high combined state and local tax burdens. New York is an outlier in having substantial local corporate franchise taxes (CFT) and personal income taxes (PIT) layered on top of State taxes, and tax increases may potentially increase out-migration of the high-income earning taxpayers upon which State and City budgets rely. Also, despite an increase in the number of millionaires in New York State since the 15-year temporary personal income tax surcharge was originally adopted, New York’s share of the nation’s millionaires and their income has decreased since 2010.
Businesses in New York City Pay Highest CFT in the Country
Incorporated businesses operating in New York State are subject to a 6.5 percent State CFT.2 The tax is calculated based on the portion of a company’s total sales that occur in New York.3 New York State’s 6.5 percent rate ranks 26 of the 46 jurisdictions (including New York City and Washington DC) that impose the tax. New York’s competitors almost all have higher rates—rates are 10.05 percent in New Jersey and 9.99 percent in Pennsylvania. Only Florida is lower at 4.5 percent. However, companies operating in New York City are also subject to the local New York City CFT of 8.85 percent on business conducted in the City. In addition, businesses operating in the Metropolitan Transportation Commuter District (MTCD), which includes New York City, and Orange, Rockland, Westchester, Putnam, Dutchess, Nassau, and Suffolk counties, are also subject to a Metropolitan Transportation Authority (MTA) surcharge of 28.9 percent of their State tax liability based on business conducted in the MTCD. Businesses subject to New York State, New York City, and MTA corporate franchise taxes can deduct City taxes from State taxable income, resulting in an effective State tax rate of 5.92 percent and an effective MTA tax rate of 1.71 percent. (28.9 percent times 5.92 percent). The sum of the State effective tax rate (5.92 percent), City rate (8.85 percent), and MTA taxes (1.71percent) is 16.49 percent on businesses operating in New York City. This is the highest CFT rate in the country, more than 35 percent more than the second highest rate levied in Iowa.4 (See Figure 1.)

New York City Residents Subject to Second Highest PIT Rate in the Country
New York State imposes a top PIT rate of 8.82 percent on married couples filing jointly with incomes greater than $2.2 million annually. In comparison, California’s top state rate is 13.3 percent and New Jersey’s top rate is 10.75 percent. As shown in Table 1, top marginal tax rates in other regional and national competitor states are below those of New York. Florida and Texas do not levy a PIT.
New York City residents are also subject to a local personal income tax with a top rate of 3.876 percent imposed on married couples with taxable incomes in excess of $90,000.5 When combining rates, the top PIT rate imposed in New York City is 12.696 percent, which is the second highest in the country. In addition, recipients of pass-through income and self-employed taxpayers working in the MTCD are subject to the Metropolitan Commuter Transportation Mobility Tax—a tax on income— at a top rate of 0.34 percent. (See Table 1.)

New York Share of US Millionaires is Decreasing
Between 2010 and 2017 the number of United States tax filers with adjusted gross incomes of $1 million or more (millionaires) increased 75 percent, which is more than 50 percent faster than growth in New York. In 2010 New York’s share of millionaires was 13 percent compared to 7 percent in Florida. Between 2010 and 2017 New York’s share of the nation’s millionaires decreased by 15 percent (to 11 percent share), while Florida’s increased by 26 percent (to a 9 percent share). (See Table 2.) The decreasing share of millionaires may be caused by a number of factors, including personal income tax rates. It is concerning because New York State and New York City are very dependent on tax revenues from millionaires, with almost 40 percent of personal income tax revenues coming from this group of taxpayers.6

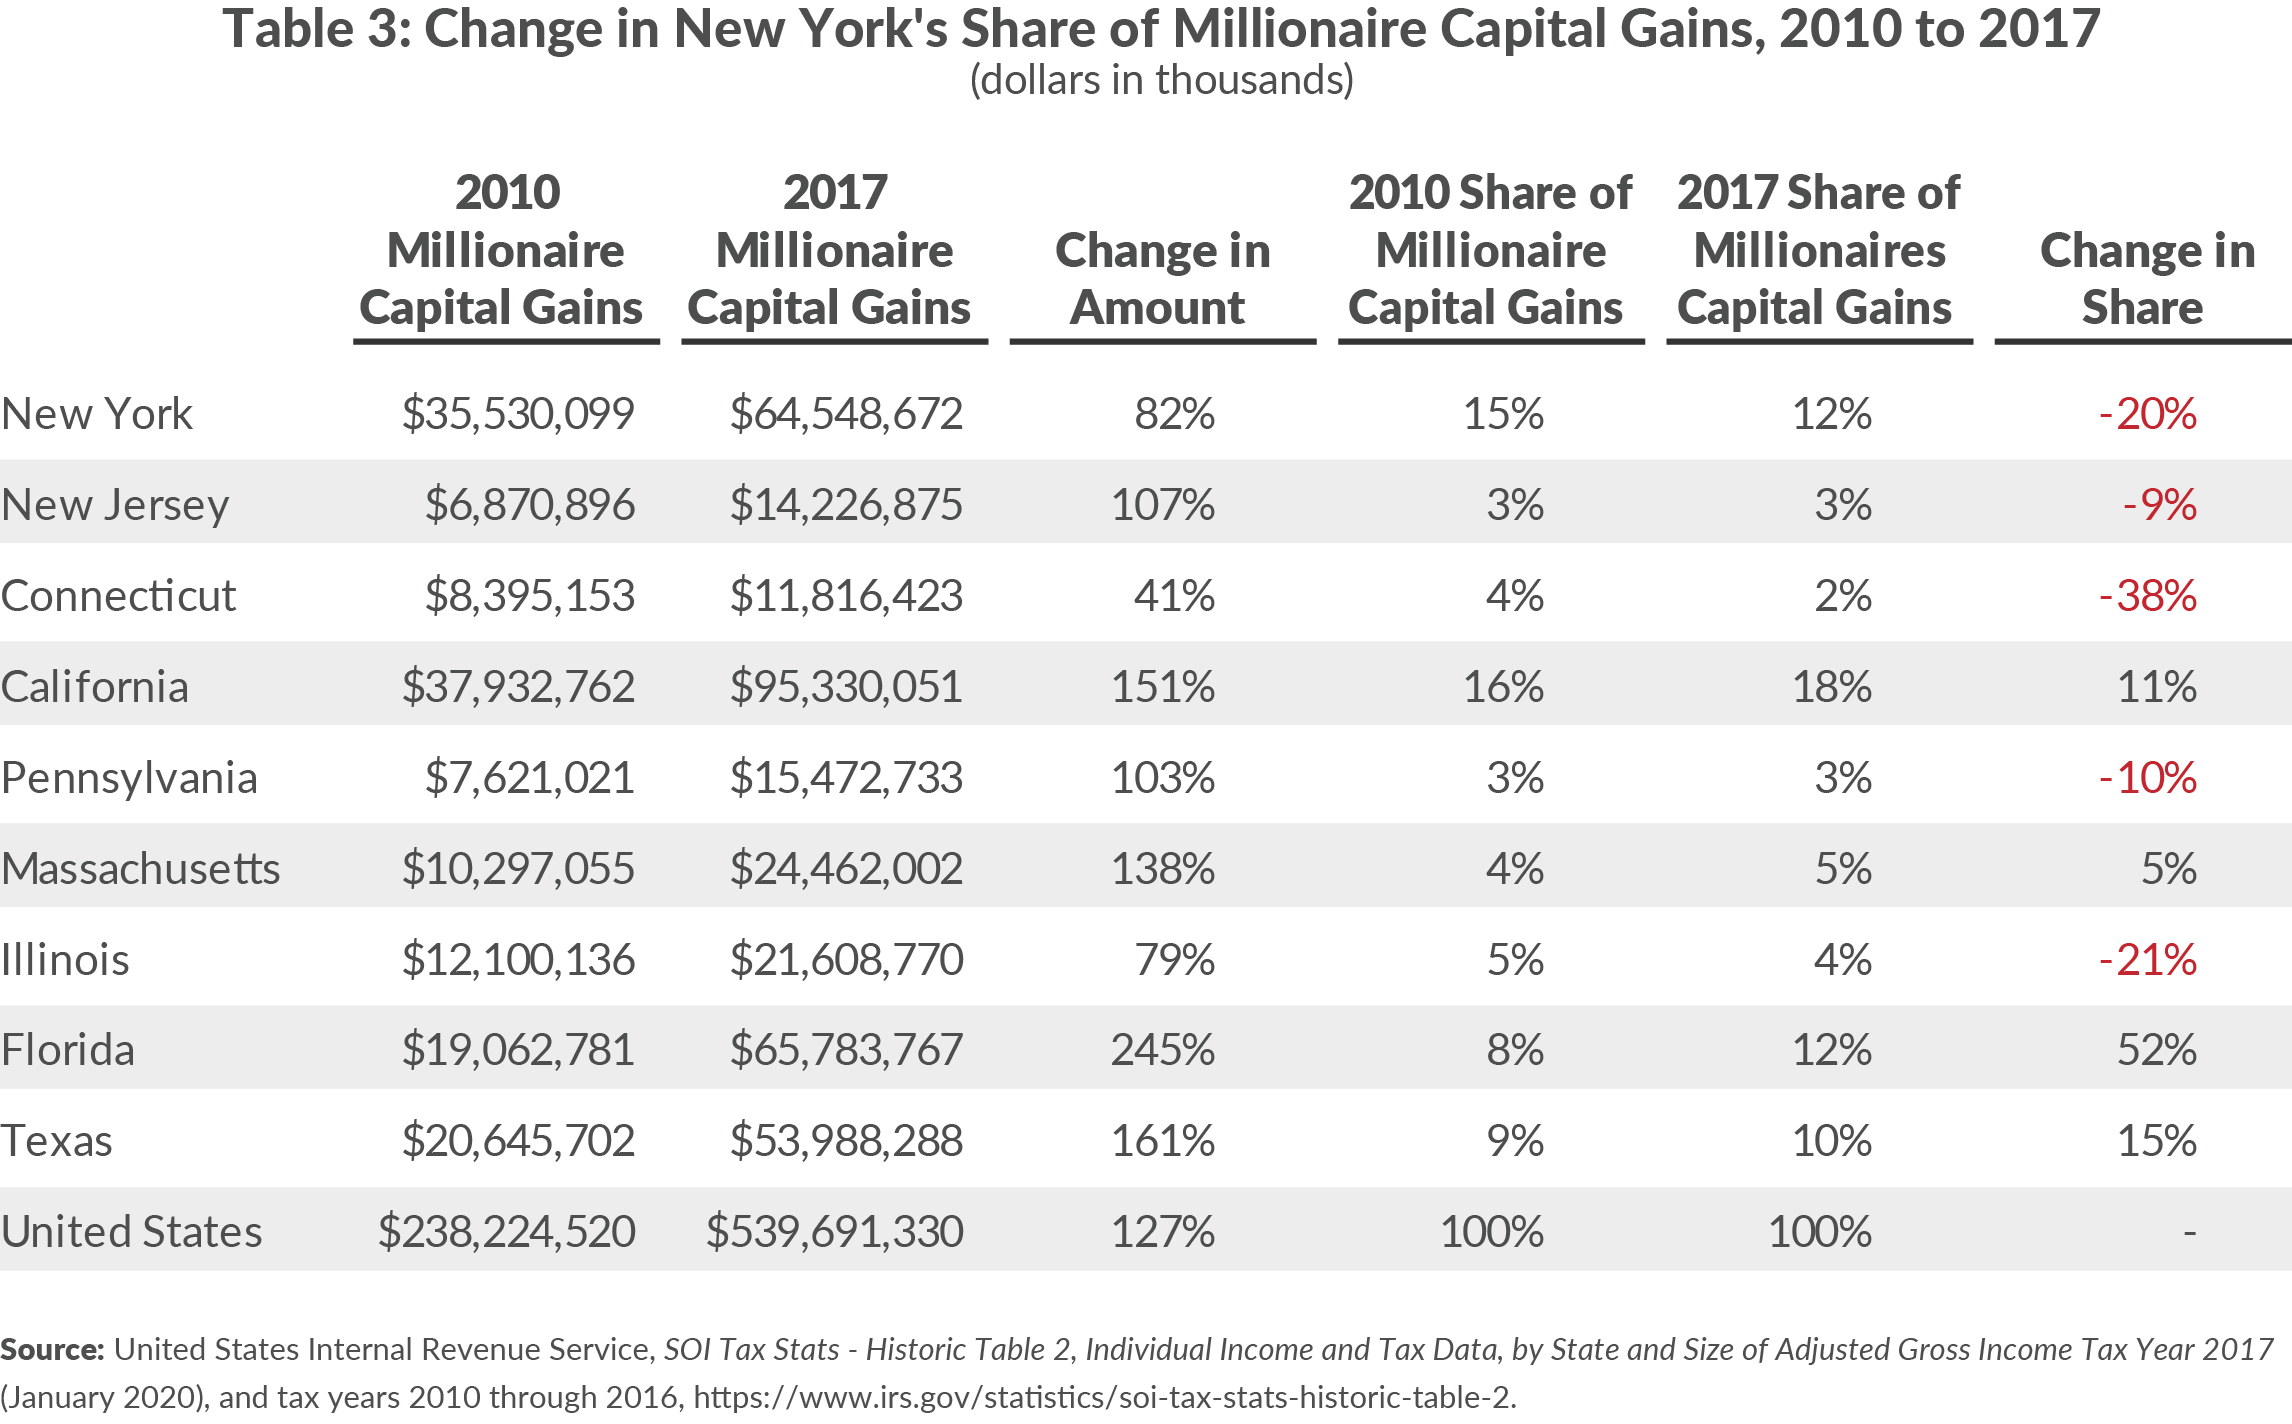
There were even greater shifts in the share of capital gains earned by New York’s millionaires, which have important revenue impacts for states’ coffers. Ordinary income is taxed where it is earned; however, capital gains are taxed by the state of residency (except for gains on sales of real property). For example, if a New Jersey resident works in New York, he or she pays New York taxes on wages earned in New York, but if the person earns capital gains, that income is taxed only by New Jersey.7 Individuals who derive most of their incomes from capital gains have a strong incentive to establish residency in a low tax state.
Between 2010 and 2017 New York’s share of national capital gains earned by millionaires decreased 20 percent, whereas Florida’s share increased by 52 percent, Texas’ grew 15 percent, and California’s grew 11 percent. (See Table 3.) If New York’s share of national millionaire capital gains had remained at 2010 shares, tax revenues could have been $1.4 billion higher.
Conclusion
As New York’s leaders look to close budget gaps, they must be cognizant that combined State and City PIT rates are the second highest in the nation, while combined CFT rates are the highest. New York’s competitive stature is not guaranteed and fewer millionaires will mean less State and City revenues.
Download Blog
New York State Taxes: Layers of LiabilityFootnotes
- David Friedfel and Charles Brecher, New York State's Hard Choices: Next Steps to Address Fiscal Stress, Citizens Budget Commission (May 22, 2020), https://cbcny.org/research/new-york-states-hard-choices; and Ana Champeny, Hard Choices That Can Balance New York City's Budget Stress, Citizens Budget Commission (June 10, 2020), https://cbcny.org/research/hard-choices-can-balance-new-york-citys-budget.
- A limited liability company (LLC) is not necessarily an incorporated entity, and therefore may be subject to the corporate franchise tax or LLC members may only be subject to the personal income tax for pass-through income. See: New York State Department of Taxation and Finance, “Limited Liability Companies (LLCs) and Limited Liability Partnerships (LLPs)” (updated February 11, 2019, accessed June 12, 2020), www.tax.ny.gov/pit/efile/llc_llp.htm.
- Other states that impose a corporate franchise tax calculate taxable income differently. Some states apply a formula that accounts for property owned in the state, or the share of payroll that is in the state. By imposing taxes based on the share of sales that take place in New York, the state avoids penalizing companies with higher corporate franchise taxes for locating workers or deploying capital in the state. Prior to 2015, New York allocated federal business income to New York with a formula that counted sales, personnel, and property equally. Some states also impose a tax based on gross receipts. See: Andrew Phillips, and Caroline Sallee, "Total State and Local Business Taxes; State-by-State Estimates for Fiscal Year 2018" (QUEST practice of Ernst & Young LLP in conjunction with the Council On State Taxation and the State Tax Research Institute, October 2019), https://assets.ey.com/content/dam/ey-sites/ey-com/en_us/news/2019/10/ey-total-state-and-local-business-taxes-october-2019.pdf.
- Janella Cammenga, "State Corporate Income Tax Rates and Brackets for 2020" (Tax Foundation, January 28, 2020, accessed June 12, 2020), https://taxfoundation.org/state-corporate-income-tax-rates-brackets-2020.
- Single filers in New York City pay the top rate of 3. 876 percent at $50,000 of taxable income.
- The number of millionaires in New York City increased by 37 percent between 2010 and 2016. During the same period, New York State millionaires increased 36%. Since growth rates were very similar, the change in New York City’s share of national millionaires likely saw a decline similar to the State’s decline. See: New York City Independent Budget Office, New York City Residents' Income and Tax Liability, Tax Year 2016, Tab 5. Major Components of Adjusted Gross Income (October 2018), https://ibo.nyc.ny.us/fiscalhistory.html.
- In tax year 2017 New Jersey residents had the largest non-resident New York State tax liability of $3.6 billion. See: New York State Department of Taxation and Finance, “Personal Income Tax Filers, Summary Dataset 1 - Major Items by Liability Status and Place of Residence: Beginning Tax Year 2015”, https://data.ny.gov/Government-Finance/Personal-Income-Tax-Filers-Summary-Dataset-1-Major/73iw-kuxv/data