NYC Ferry Comparative Analysis
CBC previously documented the high taxpayer cost of NYC Ferry. Based on recently released financial data for fiscal year 2019, NYC Ferry’s per-ride subsidy declined from $10.73 to $9.34 because its revenue grew faster than reported operating costs.1 Nevertheless, the subsidy remains high—almost 10 times that of New York City Transit subways and buses—and is primarily due to a flat fare pegged to the price of a single subway or bus ride. NYC Ferry recouped just 24 percent of its operating costs through fare revenue in 2019, up just 2 percentage points from 2018; that ratio is still among the lowest of all transit systems in New York City.
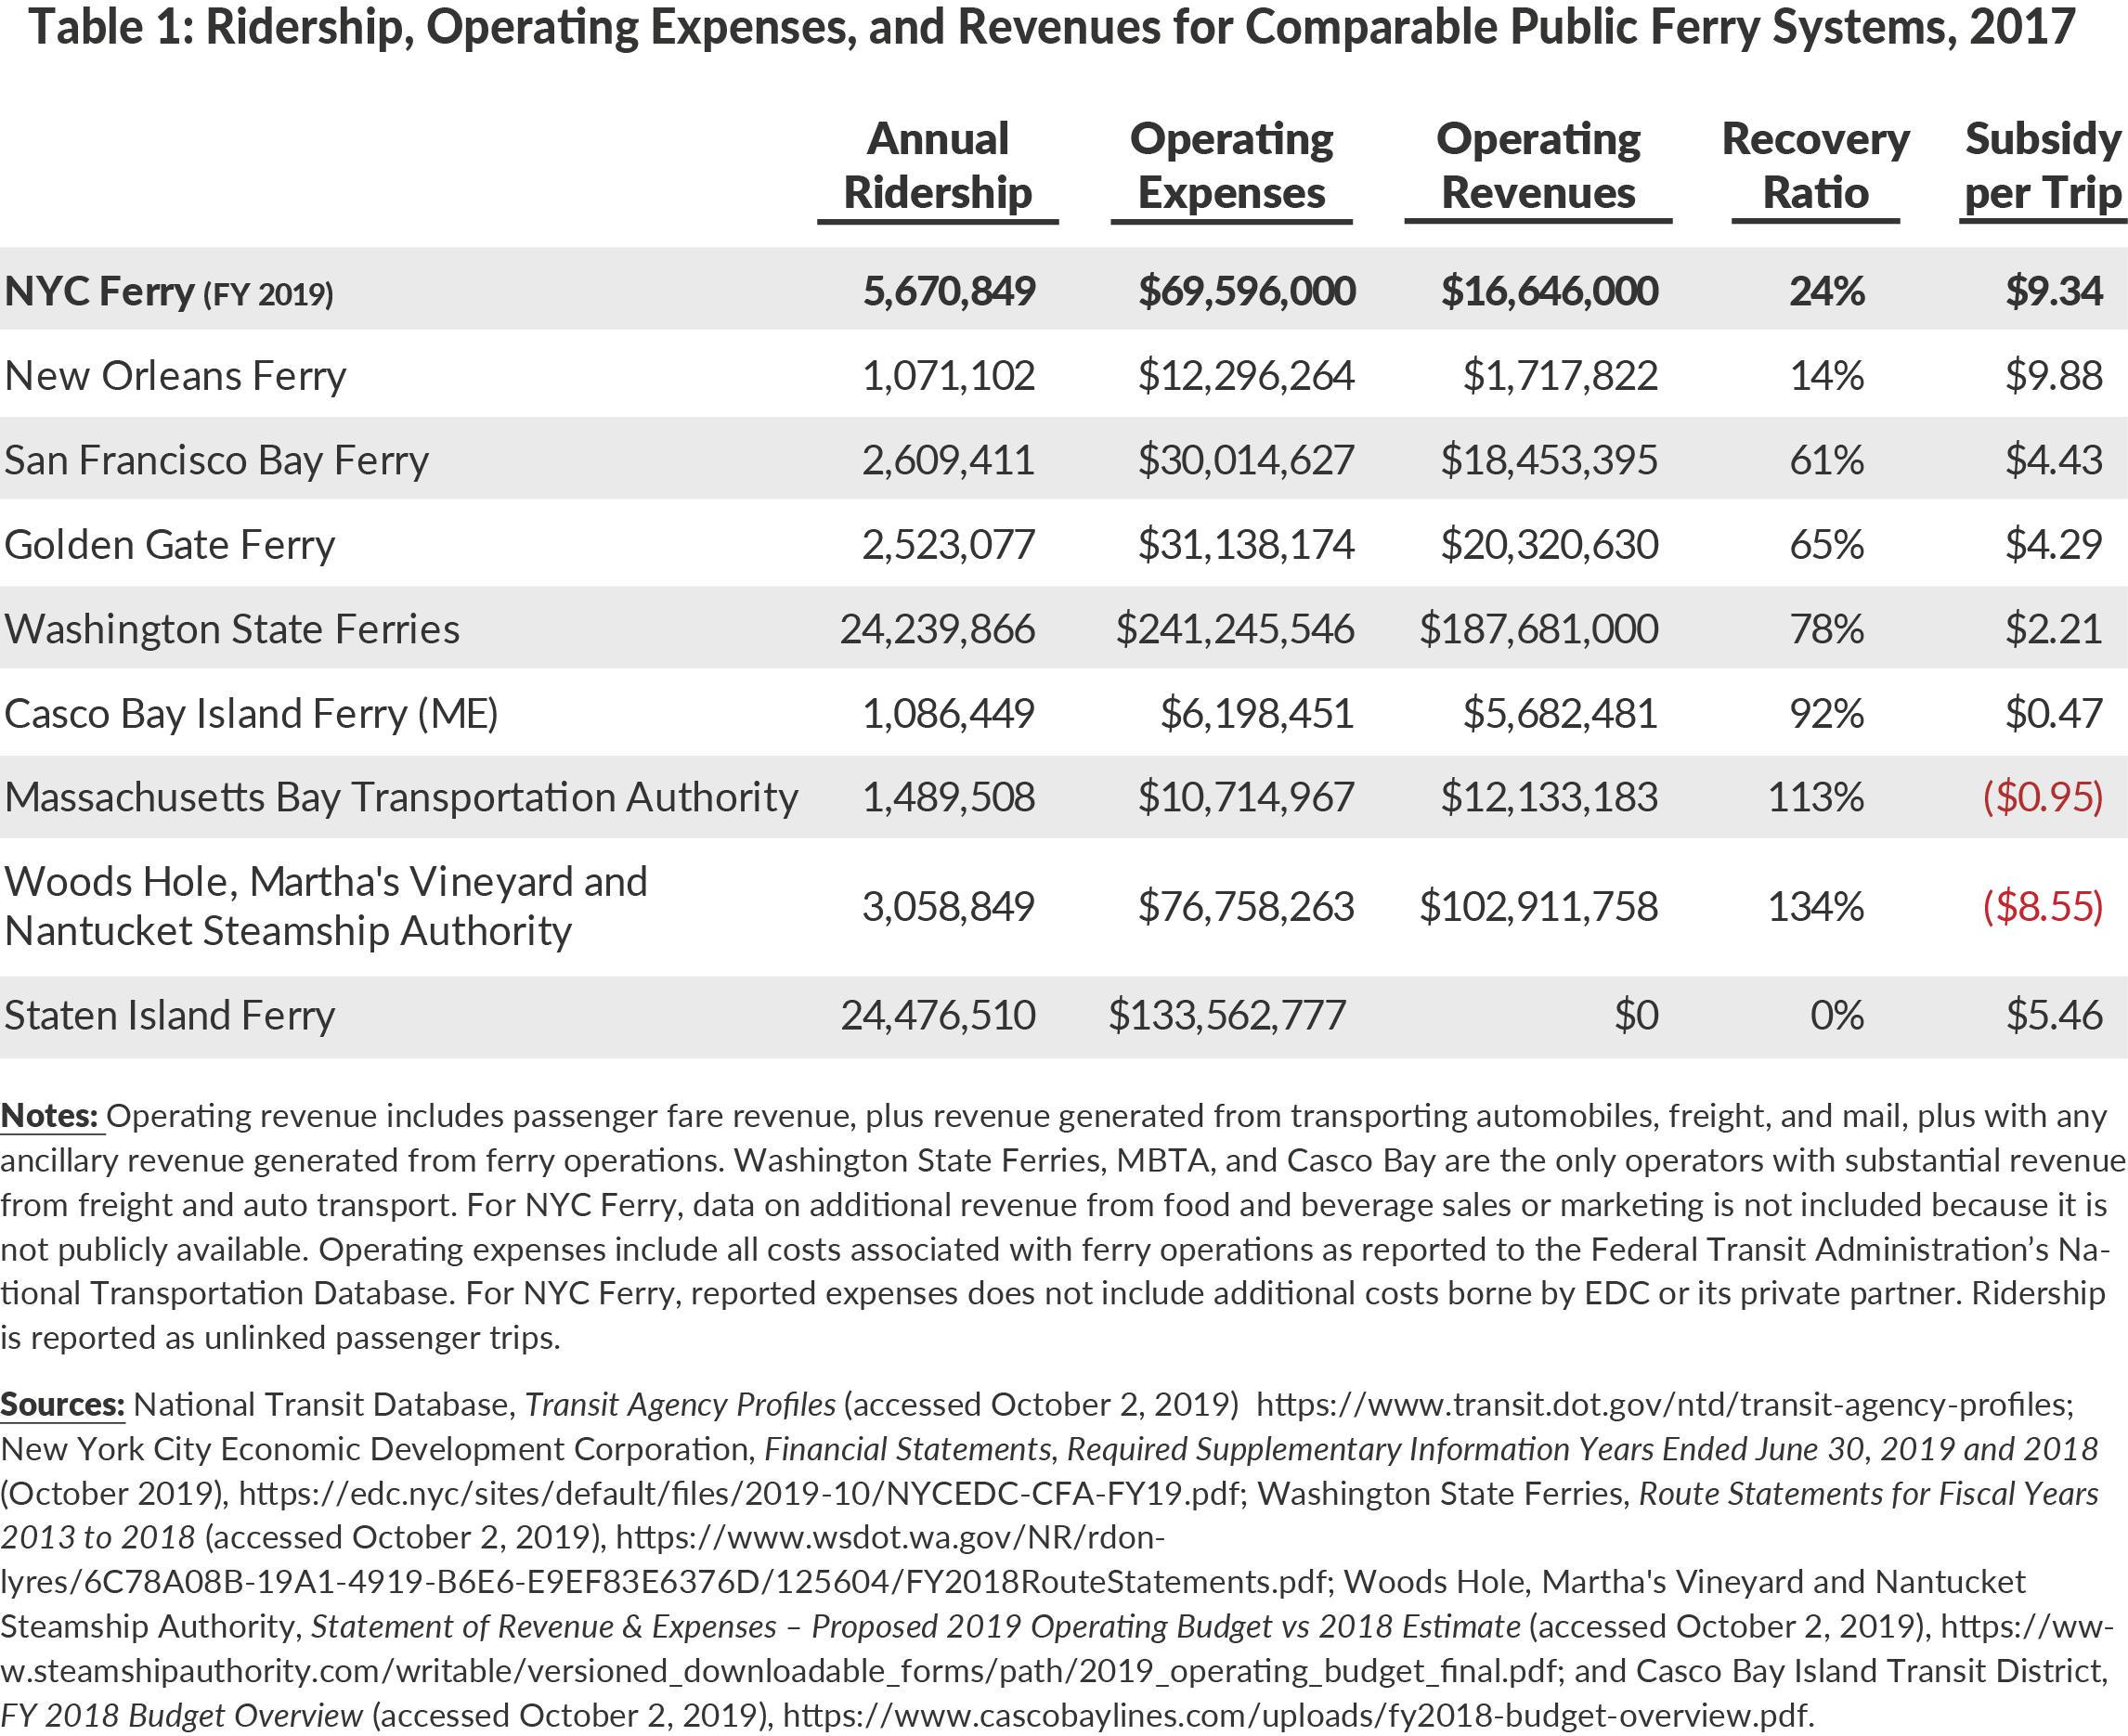
NYC Ferry’s subsidy also compares unfavorably to other large public ferry systems in the United States. Table 1 compares NYC Ferry’s ridership, expenses, and revenue in 2019 to the country’s seven largest public ferry systems, plus the Staten Island Ferry, in 2017, the most recent year for which data are available. The seven systems were selected because they transport at least 1 million riders annually.
NYC Ferry is the third largest ferry system in the country by ridership, behind only the Staten Island Ferry and Washington State Ferries. Among the largest public ferry systems, NYC Ferry’s $9.34 per-trip subsidy is the second highest and its 24 percent recovery ratio is the second lowest. Only the New Orleans Ferry, with a per-trip subsidy of $9.88 and a 14 percent recovery ratio in 2017, is worse. The other five systems required subsidies of less than $5 per trip and recouped at least 61 percent of expenses through operating revenue. The two Massachusetts ferry systems even generated operating surpluses.
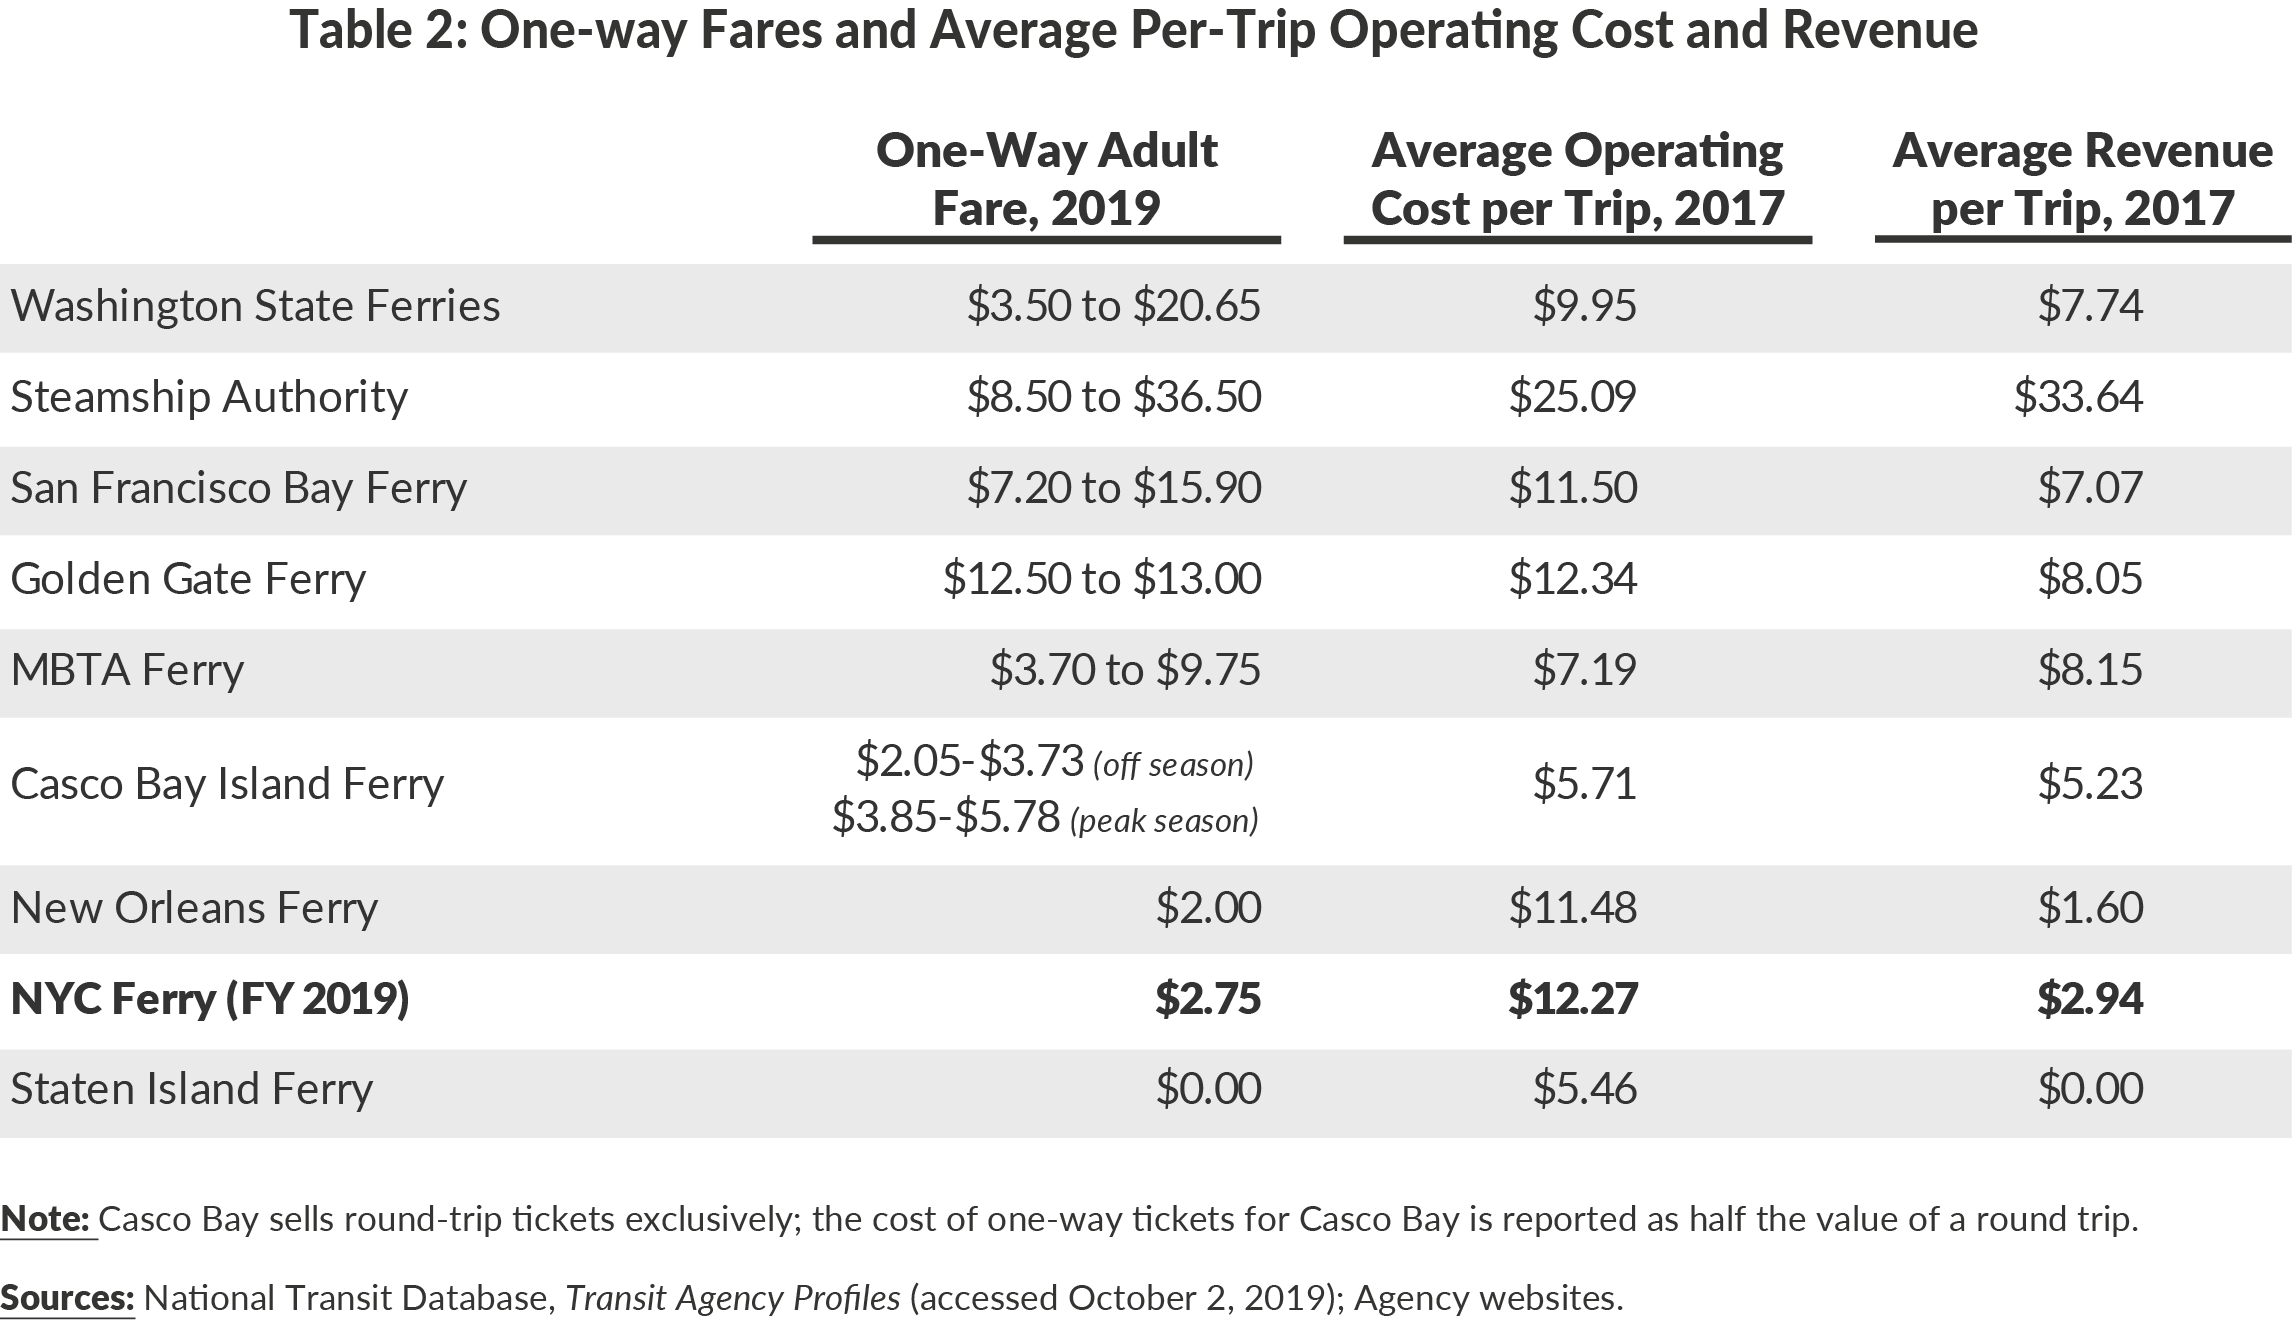
NYC Ferry’s flat $2.75 fare is a primary driver of its comparatively high subsidy. On most public ferry systems, fares vary by route and are more in line with their operating costs.2 (See Table 2.) Long routes and routes with lower ridership typically command higher fares. New Orleans is the sole exception; due to its flat $2 fare, New Orleans Ferry has lower revenue per trip and a lower recovery ratio than NYC Ferry. The other ferry systems earn between $5 and $8 per trip, while the Nantucket/Martha’s Vineyard ferry earns more $33 per trip because it levies additional charges for vehicle transport.
The high cost of NYC Ferry—both in per-trip subsidy and relative to other public ferry systems—should prompt reconsideration of the operating strategy and pricing model.
Download Blog
NYC Ferry Comparative AnalysisFootnotes
- The reduced subsidy reflects changes in both NYC Ferry’s revenues and expenditures. Operating revenue grew 31 percent, in part due to the addition of two routes that opened during the fiscal year. Overall ridership grew 38 percent, from 4.1 million to 5.6 million trips, while vehicle revenue hours increased 48 percent. The overall number of passengers per revenue hour fell from 91 in fiscal year 2018 to 85 in 2019. Operating expenses grew 23 percent, largely driven by costs associated with operating the new routes. These new costs were offset by the elimination of fiscal year 2018 start-up costs that were not incurred in fiscal year 2019. Without a detailed budget, the future impact of any remaining non-recurring start-up costs, which would reduce per-ride subsidies, cannot be estimated. New fiscal year 2019 costs may also have been offset by reduced Vessel Usage Fees paid by EDC to its private partner as the City began to purchase boats for the ferry system. Data on these possible savings and any debt service costs associated with these purchases are not available.
- For example, the Washington State Ferries route with the highest ridership (Seattle-Bainbridge Island) has a regular fare of $8.65, which is sufficient to cover its costs; the route had a farebox recovery ratio of 108 percent in 2017. The two lowest performing routes that year (Seattle-Bremerton and Port Townsend-Coupeville) both achieved recovery ratios of 51 percent with different fares ($8.65 and $3.50, respectively) that matched their underlying cost structures. See: Washington State Ferries, Route Statements for Fiscal Years 2013 to 2018 (accessed October 2, 2019), https://www.wsdot.wa.gov/NR/rdonlyres/6C78A08B-19A1-4919-B6E6-E9EF83E6376D/125604/FY2018RouteStatements.pdf.