Opaque and Duplicative
Local Economic Development in New York State
Municipal governments across New York State are concerned with boosting their local economies, as only 5 of 62 counties have had job growth higher than the national average since 2010, according to the U.S. Bureau of Labor Statistics. Local governments outside of New York City spent $58.8 million on economic development in 2015, according to data from the Office of the New York State Comptroller. However, a much larger amount of locally-controlled money for economic development efforts flows through a system of public benefit corporations and not-for-profit corporations created by local governments to award financial assistance to businesses.
These two types of entities, Industrial Development Agencies (IDAs) and Local Development Corporations (LDCs), are responsible for making $16.2 billion in investments from 2011 through 2015. These entities have proliferated across the state, numbering nearly 350 in 2015. The Citizens Budget Commission (CBC) has three concerns with the current system of IDAs and LDCs:
- Fragmentation of decision-making authority;
- Lack of sufficient accountability; and
- Record of poorly justified investment choices.
This report begins with an overview of IDAs and LDCs and the financial resources they control and then examines these three concerns. It concludes with recommendations for improving the transparency and effectiveness of IDAs and LDCs.1
Overview
IDAs are public benefit corporations created by state law at the request of a municipality. They can buy and sell property, and property owned by an IDA is exempt from property tax and mortgage recording tax. An IDA can pass these exemptions on to a business occupying the property, which then generally makes Payments in Lieu of Taxes (PILOTs) to some or all of the impacted taxing jurisdictions. Exemptions from state and local sales taxes may also be granted for purchases related to IDA projects. IDA operating costs are typically funded by fees paid by the businesses that receive their assistance.1 As of December 2015, there were 107 IDAs statewide.2
LDCs are private not-for-profit corporations. They can be established by anyone, but this report focuses only on those that are under the oversight of the New York State Authorities Budget Office (ABO) because they meet the definition of a local authority in accordance with Section 2 of Public Authorities Law, meaning they are affiliated with, sponsored by, or created by a municipal government.3 LDCs have the power to “construct, purchase, rehabilitate or improve industrial or manufacturing plants, or assist financially in such construction, rehabilitation or improvement. They can either maintain such plants for others, or sell, lease, or mortgage them.”4 Municipalities can sell or lease property they no longer need to LDCs without appraisal, public notice, or bidding. Property owned by an LDC is tax-exempt but LDCs cannot pass this benefit on to others.5 LDCs can also award loans and grants to businesses, nonprofits, or public entities. As of December 2015, there were 241 LDCs statewide, of which 189 had purposes related to economic development.6
Both IDAs and LDCs can buy and sell property, borrow money, and issue debt. (See Table 1.) Both types of entities are subject to oversight by the ABO, but only IDAs are subject to oversight by the Office of the State Comptroller (OSC). Their key differences lie in the types of economic development support they can give; IDAs can offer tax exemptions, while LDCs cannot. LDCs can give grants or loans to businesses or other nonprofits, while IDAs cannot make grants or loans of their own funds.7 LDCs can issue conduit debt for “civic facility” projects, or those owned or operated by not-for-profit corporations; IDAs cannot issue conduit debt for these projects, following the 2008 expiration of a provision of the General Municipal Law.8 Conduit debt is issued in the IDA’s or LDC’s name for the benefit of a recipient company or nonprofit, and is the obligation of the recipient, not the issuing IDA or LDC.

Finances
Total Costs
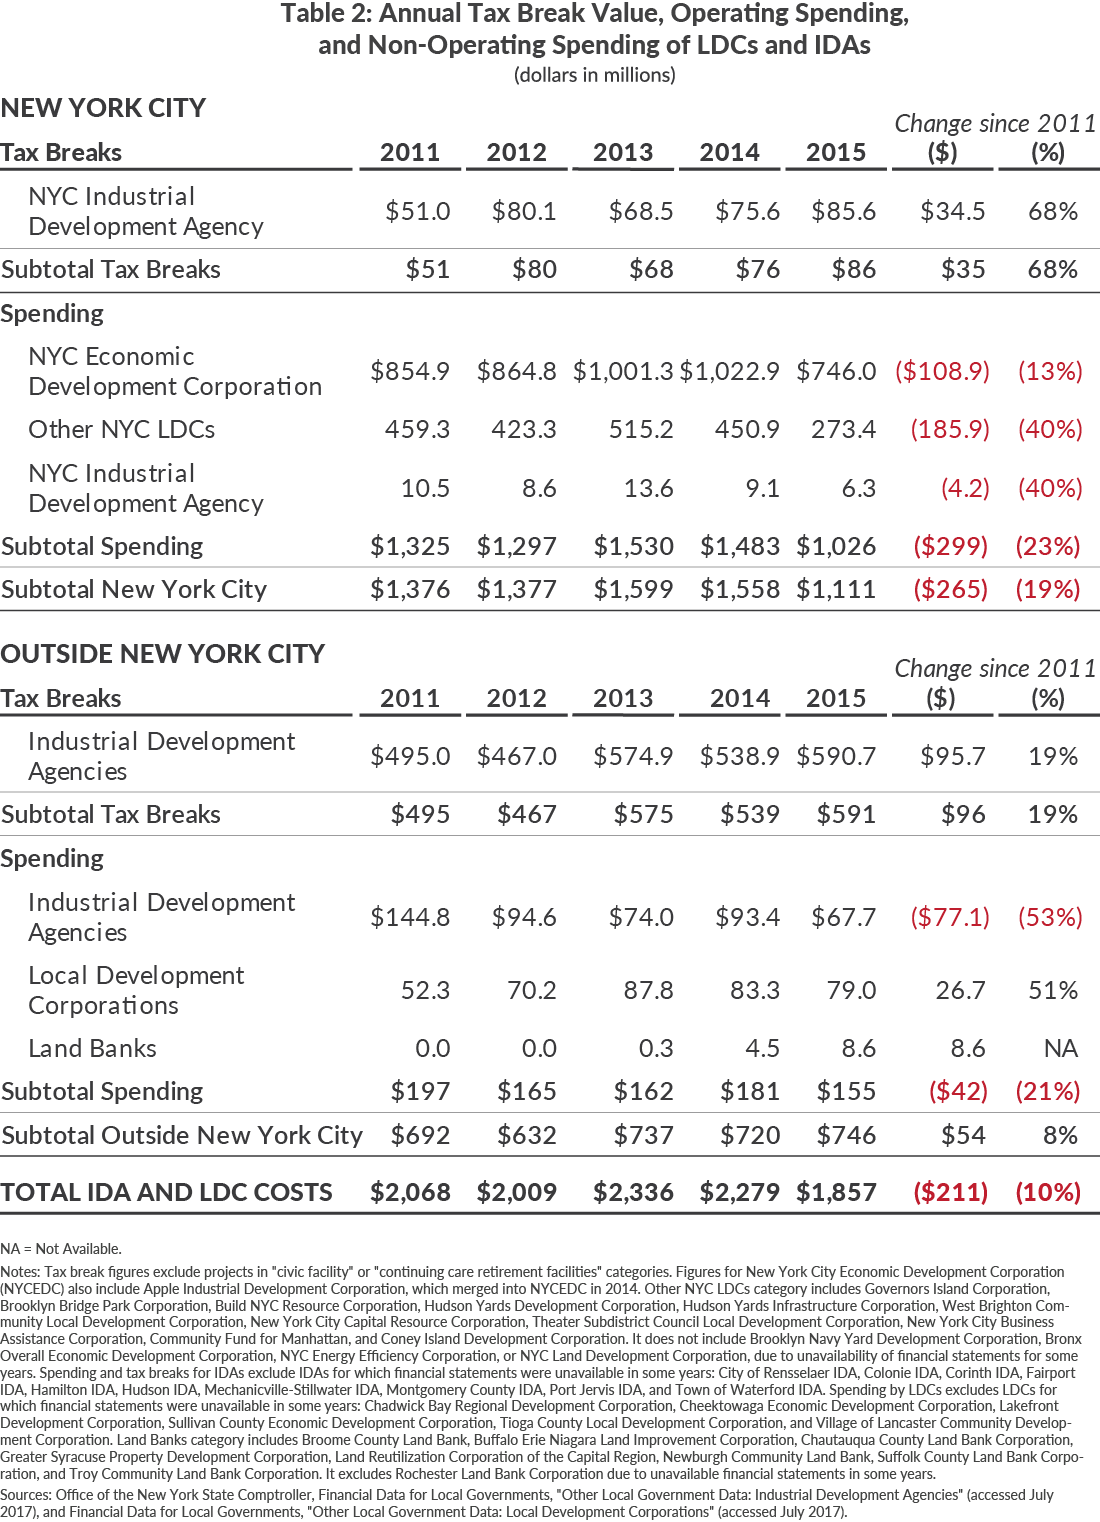
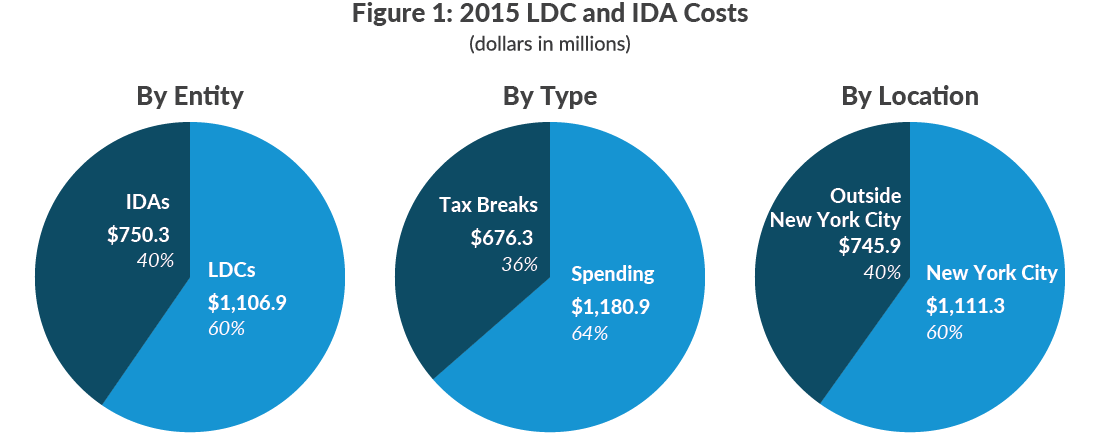
In 2015 spending and tax expenditures by IDAs and LDCs totaled $1.9 billion. Sixty percent of that total was concentrated in New York City. Statewide, tax expenditures totaled $676 million and spending totaled $1.2 billion. (See Table 2).
The total costs of IDAs and LDCs in New York City decreased by one-fifth over the period from 2011 to 2015, with decreases in spending by New York City Industrial Development Agency (NYCIDA), New York City Economic Development Corporation (NYCEDC), and other LDCs, and an increase in NYCIDA tax breaks. Outside New York City, the total costs of IDAs and LDCs increased slightly, led by growth in LDC spending and IDA tax breaks. Over the same period, IDA spending decreased by half.
Expenses and Revenues
In 2015, the most recent year for which data is available, the allocation of operating expenses was similar between IDAs and LDCs, but differed for those located in New York City compared to the rest of the state. (See Table 3). In New York City, professional services contracts dominated expenditures, largely due to a contract between the NYCIDA and NYCEDC in which NYCEDC manages all of the projects of NYCIDA. Outside the City, both IDAs and LDCs spent most of their money on salaries and benefits; professional services contracts, which can include auditors, bond counsel, etc.; and “other operating expenses,” which can include rent, dues and subscriptions, consultant costs, etc.

Revenues for both IDAs and LDCs came largely from charges for services, or fees paid by the projects receiving assistance.9 (See Table 4). LDCs both within and outside of New York City received a significant share of their revenue from other sources, which can include land sales, grant revenues, and contracts with related entities.

Debt Held
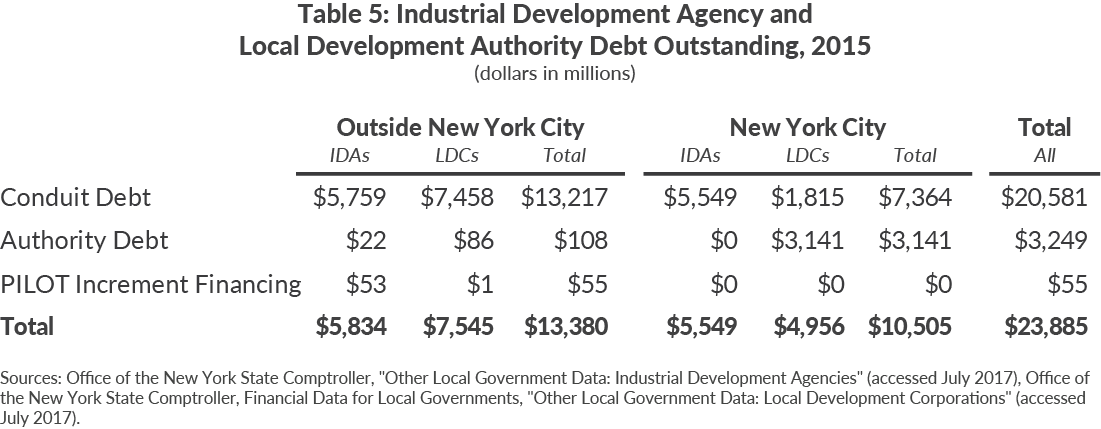
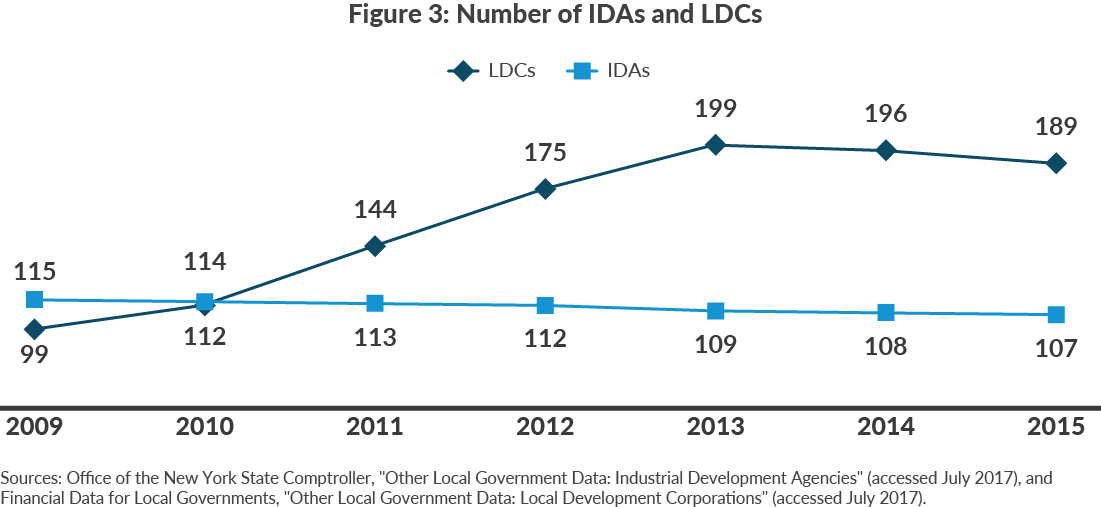
IDAs and LDCs have nearly $24 billion of debt outstanding. The vast majority (86 percent) of this debt is conduit debt, and approximately $10 billion of this debt is held by IDAs. Since 2008, IDAs have been prohibited from issuing conduit debt on behalf of nonprofit projects, sometimes referred to as “civic facilities.”10 Since then, IDAs have decreased in number, while LDCs, which face no such restriction, have proliferated.
In addition to conduit debt, IDAs and LDCs hold some authority debt, mainly revenue debt, but also some general obligation and other debt. Two upstate LDCs have debt in the form of PILOT Increment Financing (PIF).11 Authority debt in New York City is dominated by $3 billion in revenue bonds issued by the Hudson Yards Infrastructure Corporation.
In total, IDAs and LDCs provide a larger commitment of economic development resources than more prominent economic development grantors, such as the Regional Economic Development Councils (REDCs). Since REDCs were established in 2011, $4.7 billion has been awarded through the annual award process, including up to $1.7 billion in industrial development bonds.12 Over the same period, IDAs and LDCs have granted at least $3.1 billion in tax breaks, made at least $254 million in grants, and issued at least $578 million in conduit debt for economic development purposes.13 Despite the significant financial resources controlled by IDAs and LDCs, their operations and organization rarely receive the same level of scrutiny as similarly costly programs run by the state.
A review of financial and other reports points to three major concerns with IDAs and LDCs.
Concern 1: Fragmentation and Overlap
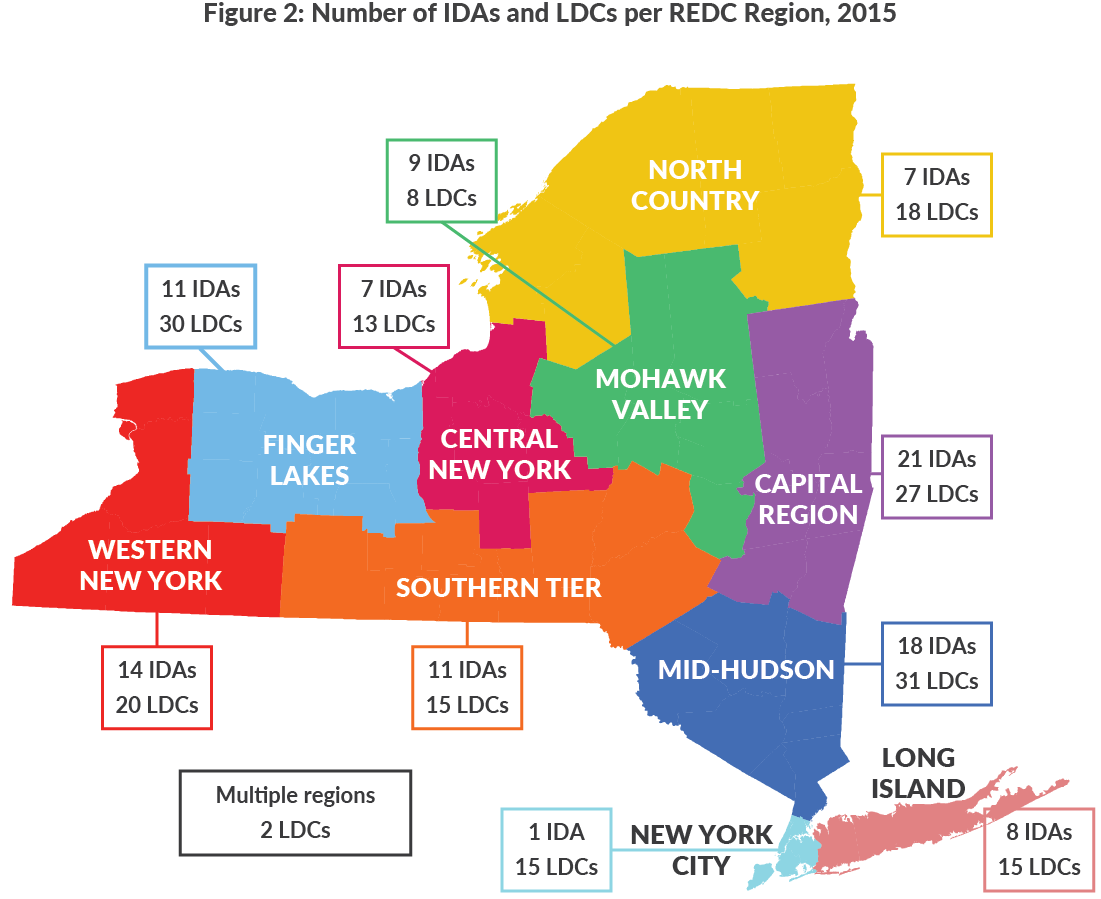
As of December 2015 there were 107 IDAs and 189 LDCs dedicated to economic development in New York State.14 In the nine REDC regions outside New York City, the number of IDAs ranged from 7 to 21 and the number of LDCs ranged from 8 to 31. (See Figure 2.) New York City was home to only one IDA, NYCIDA, along with 15 LDCs, including NYCEDC. Of the state’s 62 counties, six contained more than 10 LDCs and IDAs combined. This preponderance results in a fragmentation of decision-making authority and impedes the coordination of economic development investments according to a consistent strategy.
Although the numbers of both IDAs and LDCs have fallen slightly in recent years and there is informal cooperation between entities in the same geographic area, there is still unnecessary duplication of effort. IDAs and LDCs spent $100 million on wages, salaries, and benefits in 2015, with neighboring entities performing overlapping work. At its worst, competition between entities creates a “lose-lose” situation at the regional level, as businesses lured from one community to another are rewarded with tax incentives. A recent study by a Stanford economist found that spatial concentration of New York’s IDAs increased the tax breaks awarded, but was unlikely to have a significant effect on where firms located.15 In contrast, coordination between individual IDAs and LDCs could take local strengths and weaknesses into account to allocate assistance more efficiently, and consolidation could decrease administrative costs.
Concern 2: Lack of Accountability
IDAs are subject to oversight by both OSC and the ABO, which was established by the Public Authorities Reform Act of 2009 (PARA) to oversee state and local authorities. OSC does not have oversight over LDCs, which are formed as not-for-profit corporations, not authorities, and ABO only has oversight over those that meet the definition of a local authority.16 Reforms in PARA and the Public Authorities Accountability Act of 2005 require all entities overseen by ABO to submit five annual reports in the Public Authority Reporting Information System (PARIS), which is jointly overseen by the ABO and OSC.
The five required reports are an annual report, a budget report, an audit report, an investment report, and a procurement report. The annual report contains information on the entity’s governance; board of directors; staff members and their pay; subsidiaries; financial information; debt schedule; property acquired or disposed of by the authority; and details on projects. For LDCs, project information covers grants, loans, or bonds awarded, and for IDAs, project information covers tax exemptions and bonds. The budget report contains a revenue and expenditure four-year plan, and the audit report is a copy of the authority’s independently audited financial statements. The investment report includes all investments owned by the authority, an audit of the authority’s investments, and confirmation that the authority’s investment guidelines are reviewed and approved annually. The procurement report contains a list of all procurement transactions for the fiscal year.
Despite these seemingly extensive filing requirements, the quality of information provided is questionable and often needs to be corrected. (See sidebar.)17 In addition, about a quarter of authorities fail to submit their required reports each year.18 Between January 2010 and July 2017, 65 IDAs and 240 LDCs missed at least one reporting deadline, and 8 IDAs and 71 LDCs failed to file a report in at least five years since 2010.19 Furthermore, ABO’s three most recent annual reports have all noted that the information submitted in PARIS is frequently inaccurate.20 However, ABO does not confirm the accuracy of all the data submitted and instead does reviews in response to complaints about particular entities.21
ABO has the power to investigate IDAs and LDCs, but its only enforcement powers are warnings and letters of censure, and it has not issued a letter of censure since 2013.22 ABO has consistently proposed that it be granted additional enforcement powers, such as levying fines, but no changes have been made to its powers since it was established in 2009.23 Additionally, while OSC can audit IDAs, it does not have the power to audit LDCs directly. It can only audit LDCs indirectly through their relationships with municipalities.24 Like ABO, OSC has limited sanction power.25
IDAs and LDCs are not subject to the same procurement requirements as municipalities. ABO reports that 55.7% of IDA procurements costs and 16.4% of LDC procurement costs were for non-competitively bid contracts during the 2016 reporting year.26 The lack of scrutiny has resulted in misconduct. Two Monroe County LDCs were involved in a bid-rigging case that ended in four guilty verdicts. One of the men convicted had helped the county to establish its LDCs and then, with help from the three other men, including the county’s former information technology director, won major bids for LDC procurements with companies he controlled.27
Legislation to reform IDAs, requested by OSC, was signed into law in 2015 and took effect in June 2016. The legislation requires IDAs to develop standard application forms for projects seeking financial assistance, including projections of job creation and retention; uniform criteria for evaluating these applications, including a written cost-benefit analysis; a uniform project agreement, including annual certification by the project owner of the number of full-time-equivalent jobs created or retained; and a policy defining the circumstances under which financial assistance must be suspended, terminated, or repaid by the project. These are all strong steps forward for accountability, and data for fiscal year 2015, used in this analysis, do not reflect any impact these policy changes may have had on IDA operations, reporting, and investment decisions.
Data Limitations
In the course of this analysis, several concerns arose with the quality and accuracy of data that IDAs and LDCs report to the ABO.
- The information that IDAs and LDCs are asked for in their PARIS filings has not changed since PARIS was created in 2009, even though their activities have evolved over time.
- LDCs are asked for slightly different information about their projects than IDAs are in their annual reports to PARIS, so data is not comparable.
- The project information entered into PARIS is based on the information provided to IDAs and LDCs on project applications, which are specific to each IDA/LDC, so data definitions are not standardized.
- Through board trainings, ABO has found that some IDA/LDC boards do not understand how to correctly enter the data from project applications into PARIS.
- ABO receives correction requests from authorities that note that information entered in previous years was incorrect, but ABO often does not make these corrections. This is generally because the authorities cannot provide documentation showing the correct data.
Concern 3: Record of Poorly Justified Choices in Making Economic Development Investments
The available data is limited, and ABO has noted inaccuracy in IDA and LDC reporting, but the information that is available suggests IDAs and LDCs do not have a strong record of making sound economic development investments. In order to evaluate the decision-making of the IDAs and LDCs, the following analysis is based on IDAs’ and LDCs’ reports of how many jobs their projects planned to create or retain at the time the incentive was awarded, rather than on how many jobs were actually created. Some projects did not report planned job creation or retention and may have had other economic development goals, such as capital investment. However, no data are available on those goals or their outcomes, so this analysis focuses on jobs. A perfect success rate is not achievable in economic development, but those giving financial assistance should target it to projects they expect to have a high return on investment and a low cost-per-job created or retained.
This analysis computes the average cost in 2015, in either foregone tax revenue or in grant funds, per job that each IDA and LDC project was projected to create or retain. This is an imperfect measure: data is not available on the expected timeline for job creation in each project, so the 2015 cost may be divided among more jobs than should be expected to exist at this point. Also, while grant costs are one-time and tax exemption costs are annual over a period of typically 5 to 30 years, new jobs may persist for longer, although there is no requirement that they exist past the point when IDA or LDC incentives cease.
Of 3,033 IDA projects outside of New York City receiving tax exemptions in 2015, 2,716 had net tax savings; that is, the actual tax that would have been owed is greater than the PILOT paid. (See Table 6.) Of these, 2,350 projects reported planned job creation, with an average tax exemption per planned job of $24,747. Another 161 projects reported planned job retention only, without job creation, with an average tax savings of $23,706 per planned job retained. Lastly, 205 projects reported no planned job creation or retention but received average tax exemptions of more than $240,000, despite no reported commitment to job creation or retention.

Of 1,705 LDC projects outside of New York City, 1,211 projects were loan projects, 343 were bond projects, and 151 were grant projects. Excluding grants to local governments, other LDCs/IDAs, other nonprofits, or for “residential property” or “land preservation” purposes, there were 76 grant projects by LDCs outside New York City in 2015. Twenty-three grant projects reported planned job creation, with an average grant of $12,031 per planned job. Planned job retention is not reported for LDC projects. The remaining 53 grant projects reported no planned job creation, but received average grants of $23,688. Per-job figures for loan and bond projects were higher than for grant projects, but not comparable because the funds are repaid.
Out of 272 IDA projects in New York City receiving tax exemptions, 269 had positive net tax exemptions. (See Table 7.) Of these, 255 projects reported planned job creation, with an average tax exemption per planned job of $17,056. Another seven projects reported planned job retention only, with an average exemption per planned job retained of $2,379. Lastly, seven projects reported no planned job creation or retention. These projects received average tax exemptions of more than $420,000 despite no apparent commitment to job creation or retention.
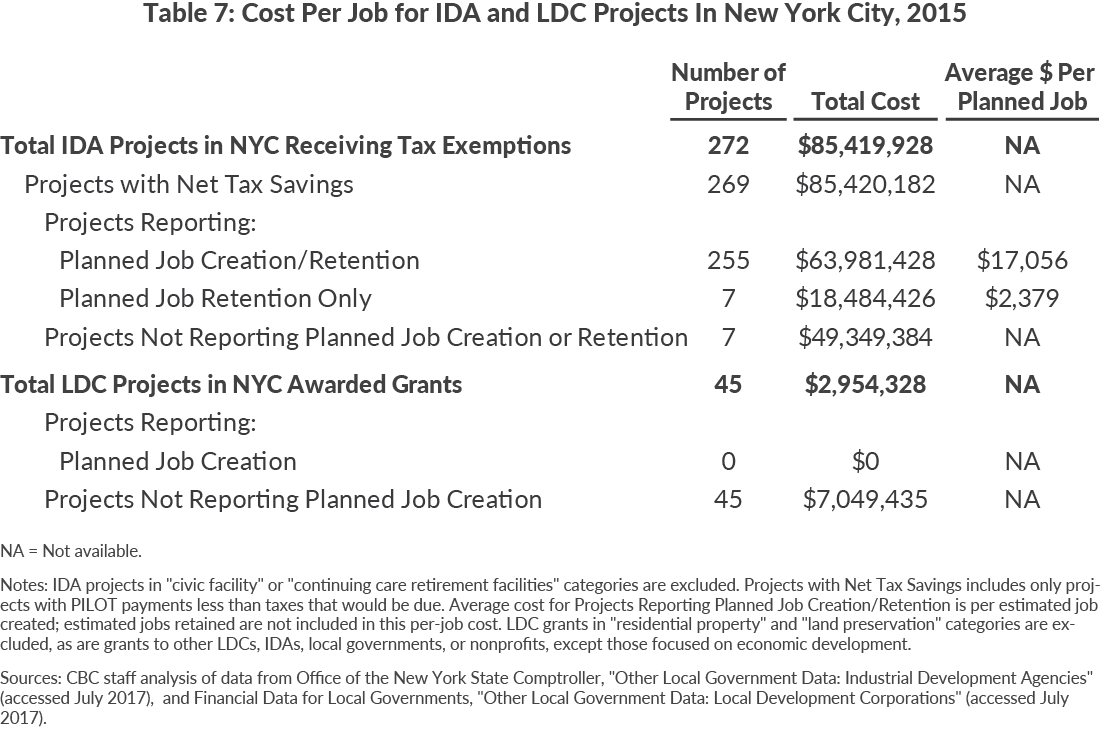
Of 255 LDC projects in New York City, 110 were loan projects, 70 were bond projects, and 75 were grant projects. Excluding grants to local governments, other LDCs/IDAs, other nonprofits, or for “residential property” or “land preservation” purposes, there were 45 grant projects by LDCs in NYC in 2015. None of the grant projects reported planned job creation, so per-job cost is not calculated for these projects.
Together, these lackluster numbers suggest that IDAs and LDCs are awarding assistance to many projects that make no commitment to job creation or retention, and to some projects with high costs relative to the number of jobs affected. If jobs are not the primary goal of these investments, additional data should be collected so their performance can be better evaluated. Although some projects will fail no matter how carefully they are chosen, IDAs and LDCs should not invest public resources in projects where “success” still means a bad deal for taxpayers.
Recommendations
CBC advocates for coordination, performance measurement, and transparency in economic development. The current system of IDAs and LDCs falls short of each of these principles, and CBC has two recommendations to improve the transparency and effectiveness of these entities.
- Consolidate IDAs at the regional level to coordinate with REDCs
REDCs bring together regional leaders in business, academia, government, and labor to establish strategic plans for investment in each region based on local strengths and challenges. This model helps to coordinate awards from numerous state agencies around a single set of priorities. IDAs in each of the state’s 10 REDC regions should be consolidated into a single multicounty IDA per region, which will work to support the REDCs’ strategic plans.28 Existing LDCs should not be allowed to engage in economic development activities and should be limited to specific purposes. The formation of new LDCs within each region should be subject to a veto by the local REDC so that economic development within the region remains coordinated, while retaining flexibility for LDCs created for specific purposes. Additionally, consideration should be given to streamlining the process for dissolving inactive LDCs. - Improve reporting and accountability
- Strengthen ABO’s enforcement powers
Since 2011, ABO’s annual reports have contained similar requests that ABO be granted the ability to “assess fines, suspend directors, or to curtail certain activities of an authority and its board which have been censured but remain out of compliance with state law or deficient in performing their fiduciary duty.”29 These powers should be granted so that ABO can more effectively address the persistent lack of reporting and the other problems uncovered in its reviews of IDAs and LDCs. - Expand oversight over PARIS reporting
Many IDA and LDC projects are worth millions of dollars, yet ABO reports that the data it receives from authorities has been “repeatedly inaccurate and unreliable.”30 Oversight of the data being input into PARIS should be increased. Data for large projects should be verified individually for each project, and data for smaller projects should be subject to spot-checking. If this is not possible at the ABO’s current capacity, the ABO‘s budget should be increased to a level that allows it to accomplish its mission. - Authorize the State Comptroller to audit LDCs
Recent instances of fraud illustrate the risks of insufficient oversight of financial resources for economic development. To prevent future abuse of public resources, OSC’s audit authority should be extended to apply to LDCs directly, not only through their relationships with local governments. - Improve and standardize IDA and LDC reporting
Standardized metrics for measuring economic development outcomes, such as job creation, are essential to evaluating economic development programs and directing public resources effectively. These metrics should include the number of jobs before assistance, planned job creation and retention, actual jobs, planned capital investment, and actual qualified investments reported annually after assistance begins.31 IDAs and LDCs should collect the same information for each of their projects, all of which should be available on the state’s open data website, as it is today. Data on IDA and LDC projects should be part of a comprehensive “database of deals” containing information on all state and local economic development projects.
- Strengthen ABO’s enforcement powers
These five changes can help to address the current fragmentation, unaccountability, and lack of transparency that characterize the current state of IDAs and LDCs. Generating consistently positive results from economic development projects is never guaranteed, but a coordinated approach combined with the data necessary to make informed decisions will go a long way toward achieving this goal.
Footnotes
- Office of the New York State Comptroller, Industrial Development Agencies in New York State: Background, Issues and Recommendations (May 2006), p. 7, www.osc.state.ny.us/localgov/pubs/research/idabackground.pdf.
- Office of the New York State Comptroller, Financial Data for Local Governments, “Other Local Government Data: Local Government Finances” (accessed July 31, 2017), http://www.osc.state.ny.us/localgov/datanstat/findata/index_choice.htm.
- Sec. 2(2) of Public Authorities Law (2005); and New York State Authorities Budget Office, Annual Report on Public Authorities in New York State (July 1, 2017), p. 8, www.abo.ny.gov/reports/annualreports/ABO2017AnnualReport.pdf.
- Office of the New York State Comptroller, Local Authorities in New York State: An Overview (April 2015), p. 4, www.osc.state.ny.us/localgov/pubs/research/localauthorities0415.pdf.
- New York State Authorities Budget Office, email to Citizens Budget Commission staff (August 9, 2017); and Office of the New York State Comptroller, Municipal Use of Local Development Corporations and Other Private Entities: Background, Issues and Recommendations (April 2011), p. 4, www.osc.state.ny.us/localgov/pubs/research/ldcreport.pdf.
- Thirty-six LDCs were created to convert ongoing revenue from a 1998 settlement with four tobacco companies into lump sum payments. These LDCs, along with 16 other non-economic-development-related LDCs, are excluded from the analysis in this report. Other LDCs excluded: Fiscal Year 2005 Securitization Corporation, Golden Hill Local Development Corporation, Maplewood Manor Local Development Corporation, Monroe Newpower Corporation, Monroe Security & Safety System Local Development Corporation, Municipal Electric and Gas Alliance Inc., NYC Technology Development Corporation, Orange Valley View Development Corporation, Orleans County Health Facilities Corporation, Otsego County Health Facilities Corporation, Philipstown Depot Theatre Development Corporation, Rensselaer Municipal Leasing Corporation, Rockland County Health Facilities Corporation, Sales Tax Asset Receivable Corporation, Schuyler County Human Services Development Corporation, and Upstate Telecommunications Corporation. See: Office of the New York State Comptroller, Financial Data for Local Governments, “Other Local Government Data: Local Government Finances” (accessed July 31, 2017), http://www.osc.state.ny.us/localgov/datanstat/findata/index_choice.htm, and Local Authorities in New York State: An Overview (April 2015), p. 11, www.osc.state.ny.us/localgov/pubs/research/localauthorities0415.pdf.
- New York State Authorities Budget Office, Policy Guidance No.15-01 (January 13, 2015), www.abo.ny.gov/policyguidance/15-01%20Restrictions%20on%20Grants%20and%20Loans.pdf.
- The expiration of this provision was met with opposition by IDA leaders, business groups, and nonprofit groups. See: New York City Economic Development Corporation, “Statewide Coalition Calls for Permanent Restoration of Industrial Development Agency Authority to Aid Civic Facilities” (press release, March 4, 2009), www.nycedc.com/press-release/statewide-coalition-calls-permanent-restoration-industrial-development-agency; Office of the New York State Comptroller, Municipal Use of Local Development Corporations and Other Private Entities: Background, Issues and Recommendations (April 2011), p. 3, www.osc.state.ny.us/localgov/pubs/research/ldcreport.pdf; The Business Council of New York State, “State Economy and Social Services Suffer From IDA Impasse” (press release, June 16, 2009), www.bcnys.org/whatsnew/2009/0616IDAcivicfacility.htm; and Testimony of Thomas Reinagel, Executive Director, United Church Home Society, before the New York State Assembly Standing Committee on Local Governments (May 17, 2007), www.leadingageny.org/linkservid/8556182D-D9BE-355F-06EF82B4292E0222/showMeta/0/.
- For example, the Nassau County Industrial Development Agency charges a fee of 0.6 percent of total project costs or bond issues (taxable and tax-exempt) and for straight-lease transactions. It also charges a one-time legal fee, a closing fee, an annual administrative fee, and an application fee. See: Nassau County Industrial Development Agency, Audited Financial Statements and Supplementary Information, Years Ended December 31, 2015 and 2014 (April 1, 2016), pp. 16-17, https://www.abo.ny.gov/annualreports/PARISAuditReports/FYE2015/IDA/NassauCountyIDA2015.pdf. In addition to project-related fees, some LDCs receive fee income related to their specific focuses, such as ferry fares for Governors Island Corporation and electricity distribution income for Griffiss Utility Services Corporation.
- Section 854, subdivision 13 of the General Municipal Law, which authorized IDAs to issue conduit debt for “civic facilities” projects, including most projects owned or operated by nonprofits, expired in 2008. See: Office of the New York State Comptroller, Municipal Use of Local Development Corporations and Other Private Entities: Background, Issues and Recommendations (April 2011), p. 3, www.osc.state.ny.us/localgov/pubs/research/ldcreport.pdf.
- In a PIF project, a project’s developer makes “increment” payments equal to the difference between the value of taxes on the improved property and the original property taxes before improvements. These increment payments are used to pay debt service on bonds issued to cover the improvements. The original tax amount continues to go to the affected tax jurisdictions. Griffiss Local Development Corporation holds $1.5 million, while the Saratoga County Industrial Development Agency holds $53 million of a $70 million PIF bond issued in 2013 to upgrade the infrastructure surrounding the GlobalFoundries plant in Malta. See: Saratoga County Industrial Development Agency, Financial Statements and Supplemental Information (December 31, 2014), www.abo.ny.gov/annualreports/PARISAuditReports/FYE2014/IDA/SaratogaCountyIDA2014.pdf.
- Not all of the funds awarded have necessarily been spent, and some are directed toward non-economic development purposes, such as waterfront redevelopment.
- These totals exclude: IDA tax exemption projects in the “civic facility” or “continuing care retirement facilities” categories; LDC grant projects in the “residential property” or “land preservation” categories, or LDC grants made to other LDCs, IDAs, local governments, or nonprofits, except those focused on economic development; and LDC and IDA conduit debt issued to nonprofits. Including all projects, IDAs and LDCs have granted $3.1 billion in tax breaks, made $644 million in grants, and issued $8.8 billion in conduit debt from 2011 to 2015.
- Thirty-six LDCs were created to convert ongoing revenue from a 1998 settlement with four tobacco companies into lump sum payments. These LDCs, along with 16 other non-economic-development-related LDCs, are excluded from the analysis in this report. Other LDCs excluded: Fiscal Year 2005 Securitization Corporation, Golden Hill Local Development Corporation, Maplewood Manor Local Development Corporation, Monroe Newpower Corporation, Monroe Security & Safety System Local Development Corporation, Municipal Electric and Gas Alliance Inc., NYC Technology Development Corporation, Orange Valley View Development Corporation, Orleans County Health Facilities Corporation, Otsego County Health Facilities Corporation, Philipstown Depot Theatre Development Corporation, Rensselaer Municipal Leasing Corporation, Rockland County Health Facilities Corporation, Sales Tax Asset Receivable Corporation, Schuyler County Human Services Development Corporation, and Upstate Telecommunications Corporation. See: Office of the New York State Comptroller, Financial Data for Local Governments, “Other Local Government Data: Local Government Finances” (accessed July 31, 2017), http://www.osc.state.ny.us/localgov/datanstat/findata/index_choice.htm, and Office of the New York State Comptroller, Local Authorities in New York State: An Overview (April 2015), p. 11, www.osc.state.ny.us/localgov/pubs/research/localauthorities0415.pdf.
- Evan Mast, “Race to the bottom? Local tax break competition and business location” (draft, Stanford University, April 13, 2017), https://sites.google.com/site/evanemast/.
- ABO’s oversight of LDCs is limited to those that meet the definition of a local authority as defined in Section 2 of Public Authorities Law. That is the same subset of LDCs on which this report focuses. See: New York State Authorities Budget Office, Annual Report on Public Authorities in New York State (July 1, 2017), p. 8, www.abo.ny.gov/reports/annualreports/ABO2017AnnualReport.pdf.
- Sources for sidebar: Staff of New York State Authorities Budget Office, personal communication (July 27, 2017); New York State Authorities Budget Office, Annual Report on Public Authorities in New York State (July 1, 2017), p. 58, www.abo.ny.gov/reports/annualreports/ABO2017AnnualReport.pdf, and PARIS Handbook: A Reference Guide for PARIS Users (2011), www.abo.ny.gov/paris/PARISHandbook2011.pdf.
- New York State Authorities Budget Office, Annual Report on Public Authorities in New York State (July 1, 2017), p. 58, www.abo.ny.gov/reports/annualreports/ABO2017AnnualReport.pdf.
- LDC total does not include those unrelated to economic development, such as Tobacco Asset Securitization Corporations, but may include LDCs that no longer exist. See: New York State Authorities Budget Office, Public Authorities That Have Failed to File Required Reports in the Public Authorities Reporting Information System as of June 29, 2017 (June 29, 2017), www.abo.ny.gov/reports/delinquentreports/July2017DelinquentList.pdf, January 2017 edition, www.abo.ny.gov/reports/delinquentreports/January2017DelinquentList.pdf, June 2016 edition, www.abo.ny.gov/reports/delinquentreports/July2016DelinquentList.pdf, January 2016 edition, www.abo.ny.gov/reports/delinquentreports/January2016DelinquentList.pdf, June 2015 edition, www.abo.ny.gov/reports/delinquentreports/June2015DelinquentList.pdf, January 2015 edition, www.abo.ny.gov/reports/delinquentreports/January2015FINALDelinquentList1.pdf, June 2014 edition, www.abo.ny.gov/reports/delinquentreports/July2014DelinquentList.pdf, January 2014 edition, www.abo.ny.gov/reports/delinquentreports/January2014DelinquentList.pdf, June 2013 edition, www.abo.ny.gov/reports/delinquentreports/July2013DelinquentList.pdf, January 2013 edition, www.abo.ny.gov/reports/delinquentreports/January2013DelinquentList.pdf, June 2012 edition, www.abo.ny.gov/reports/delinquentreports/July2012DelinquentList.pdf, January 2012 edition, www.abo.ny.gov/reports/delinquentreports/January2012DelinquentList.pdf, January 2011 edition, www.abo.ny.gov/reports/delinquentreports/January2011DelinquentList.pdf, and January 2010 edition, www.abo.ny.gov/reports/delinquentreports/January2010DelinquentList.pdf.
- New York State Authorities Budget Office, Annual Report on Public Authorities in New York State (July 1, 2017), p. 58, www.abo.ny.gov/reports/annualreports/ABO2017AnnualReport.pdf July 2016 edition, pp. 4-5, www.abo.ny.gov/reports/annualreports/ABO2016AnnualReport.pdf, and July 2015 edition, pp. iii, 6-8, www.abo.ny.gov/reports/annualreports/ABO2015AnnualReport.pdf.
- New York State Authorities Budget Office, Annual Report on Public Authorities in New York State (July 1, 2017), p. 7, www.abo.ny.gov/reports/annualreports/ABO2017AnnualReport.pdf.
- The ABO was led by acting directors from 2014 to 2017, which may have contributed to the lack of censures issued. New York State Authorities Budget Office, Annual Report on Public Authorities in New York State (July 1, 2017), p. 1, www.abo.ny.gov/reports/annualreports/ABO2017AnnualReport.pdf, and “ABO Enforcement Actions” (accessed July 26, 2017), www.abo.ny.gov/enforcement/enforcement.html.
- New York State Authorities Budget Office, Annual Report on Public Authorities in New York State (July 1, 2017), p. 57, www.abo.ny.gov/reports/annualreports/ABO2017AnnualReport.pdf, July 2016 edition, p. 60, www.abo.ny.gov/reports/annualreports/ABO2016AnnualReport.pdf, July 2015 edition, p. 48, www.abo.ny.gov/reports/annualreports/ABO2015AnnualReport.pdf, July 2014 edition, p. 51, www.abo.ny.gov/reports/annualreports/ABO2014AnnualReport.pdf, July 2013 edition, p. 30, www.abo.ny.gov/reports/annualreports/ABO2013AnnualReport.pdf, July 2012 edition, p. 20, www.abo.ny.gov/reports/annualreports/ABO2012AnnualReport.pdf, and July 2011 edition, p. 19, www.abo.ny.gov/reports/annualreports/ABO2011AnnualReport.pdf.
- Office of the New York State Comptroller, Municipal Use of Local Development Corporations and Other Private Entities: Background, Issues and Recommendations (April 2011), p. 1, www.osc.state.ny.us/localgov/pubs/research/ldcreport.pdf.
- Office of the New York State Comptroller, Local Authorities in New York State: An Overview (April 2015), p. 8, www.osc.state.ny.us/localgov/pubs/research/localauthorities0415.pdf.
- New York State Authorities Budget Office, Annual Report on Public Authorities in New York State (July 1, 2017), p. 28, www.abo.ny.gov/reports/annualreports/ABO2017AnnualReport.pdf.
- Gary Craig, “Sentencings close Monroe County bid-rigging case,” Democrat and Chronicle (May 6, 2016), www.democratandchronicle.com/story/news/2016/05/06/ldc-bid-riggers-sentenced-corruption-case/84011344/.
- The state will have to determine how the relevant local governments come together to appoint the governing body, in recognition of the loss of local control from consolidating IDAs. A possible model is the Counties of Warren and Washington IDA, with board members appointed by each county.
- New York State Authorities Budget Office, Annual Report on Public Authorities in New York State (July 1, 2017), p. 57, www.abo.ny.gov/reports/annualreports/ABO2017AnnualReport.pdf.
- New York State Authorities Budget Office, Annual Report on Public Authorities in New York State (July 1, 2017), p. 58, www.abo.ny.gov/reports/annualreports/ABO2017AnnualReport.pdf.
- For additional detail and a complete list of recommended metrics, see: Riley Edwards, A Blueprint for Economic Development Reform (Citizens Budget Commission, March 13, 2017), https://cbcny.org/research/blueprint-economic-development-reform.