The Potential for Office-to-Residential Conversions
Lessons from 421-g
INTRODUCTION
Economic changes brought on by the COVID-19 pandemic have left the future of New York City’s office market as uncertain as at any point in the modern era. Office vacancy rates have doubled since March 2020, exceeding the previous record level set in the early 1990s. Daily occupancy rates remain well below pre-pandemic levels due to the persistence of remote work. Many office buildings require significant investments to attract tenants and to comply with new building emissions requirements—cost pressures that come amidst flagging rents.
When New York City’s office market last faced significant pressures in the early 1990s, policymakers implemented a plan focused on lower Manhattan, which was the epicenter of the vacancy crisis. One of the plan’s components, the 421-g property tax incentive program, encouraged lower Manhattan property owners to convert functionally obsolete office buildings to residential uses. This brief analyzes how the 421-g program was used and offers lessons for designing a cost-effective program to support office-to-residential conversions in today’s market.
CBC’s analyses of 421-g found that:
- The incentive was used to convert nearly 13 million square feet of office space, or roughly 13 percent of the lower Manhattan office market, to residential use between 1995 and 2006;
- Office-to-residential conversions using 421-g created 12,865 units—over 40 percent of the growth in housing units in lower Manhattan between 1990 and 2020;
- Another 17,000 units were converted or built in lower Manhattan without 421-g;
- 421-g cost $1.2 billion, or $92,000 per unit;
- Some of these conversions would likely have occurred without 421-g or without the full value of the 421-g incentives;
- Buildings built before 1945 were more likely than post-war buildings to convert through 421-g;
- Fully 24 percent of lower Manhattan’s pre-war office stock converted to residential through 421-g, compared with just 6 percent of its post-war stock.
- Ninety percent of the buildings that used 421-g, accounting for 61 percent of converted space, were built before 1945.
- Regulatory constraints, in addition to economic and physical factors, made post-war conversions less feasible; and
- Residential conversions in lower Manhattan have continued without incentives after the 421-g program expired, though the pace of conversions has slowed.
This analysis illuminates critical lessons for intervention in today's office market:
- The 421-g program successfully met its goals of sparking residential development in lower Manhattan and offering proof of concept for office-to-residential conversion;
- The current economic context is stronger than in the 1990s, but the City’s office market faces significant risks, including uncertainty about the impact of hybrid and remote work on office use and building valuations;
- A tax incentive may not be necessary for conversions to market rate units; however, an incentive that is more limited than 421-g may catalyze momentum by jump-starting conversions. More lucrative or deeper incentives would be needed to support mixed-income rental conversions;
- Regulatory reform, including lifting the Floor Area Ratio (FAR) cap and other changes to the New York State Multiple Dwelling Law and the City’s zoning and building codes, is essential to convert some buildings that otherwise would be prohibited or would be financially infeasible;
- Allowing conversions as-of-right, rather than through discretionary processes, is needed to maximize the number of conversions and allow the market to determine where conversion is the best option; and
- Any new conversion program should be appropriately targeted and empirically grounded by a feasibility study and policy design that addresses the following questions:
- Is the vacancy crisis dispersed or concentrated?
- What are the goals of the program: producing affordable housing, sparking the creation of mixed-use neighborhoods, and/or stabilizing the office market?
- What incentives are needed to advance these goals, in which circumstances, and at what levels?
- Is this the most cost-effective solution to achieve the program’s goals?
The brief is divided into six sections: first, an overview of the conditions of the 1990s lower Manhattan office market; second, a description of the City and State policy responses, which included the 421-g incentive; third, a summary of the results of the 421-g program; fourth, an analysis of some of the factors that affected which types of building took advantage of the program; fifth, the legacy of 421-g; and finally, lessons from 421-g and the early 1990s that can inform the present policy discussion.
THE LOWER MANHATTAN 1990s OFFICE MARKET
In the early 1990s, New York City was stuck in a deep economic malaise. The city had been hit hard by the recession of 1989-90, which was caused by rising inflation, a gas price shock, and banking and stock market crises. New York City lost 310,000 jobs between 1989 and 1992. Its job losses were far steeper than the nation: 9 percent compared to a 2 percent drop nationally. New York City’s recovery also lagged the nation; employment levels remained persistently below their 1980s levels through the mid-1990s, even as the national economy recovered.1
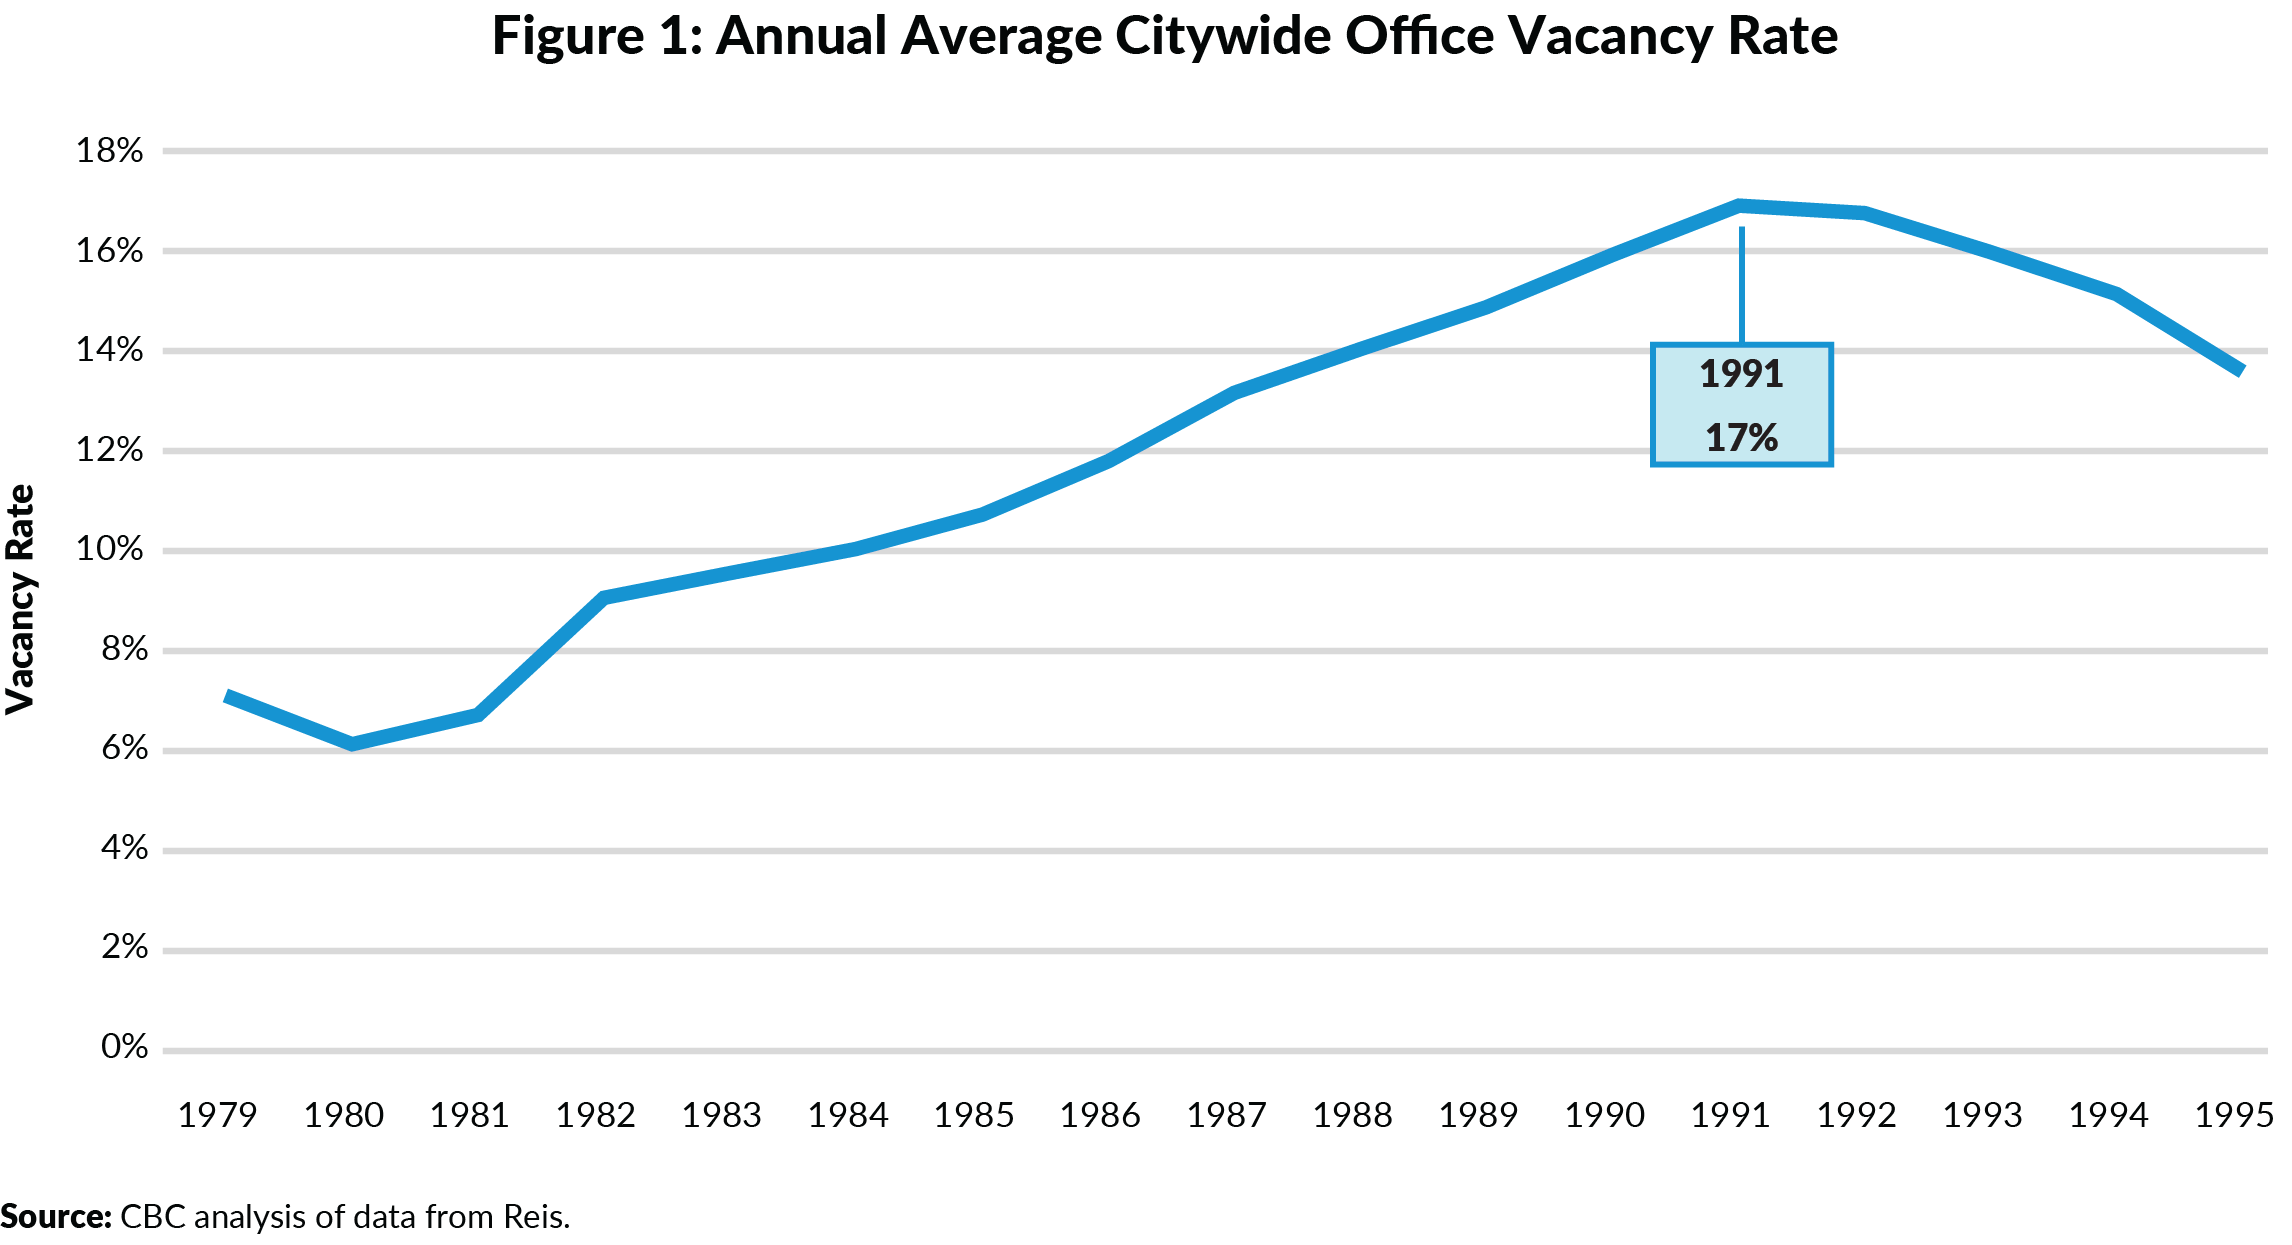
New York City’s office market suffered during this period, hit by both supply-side and demand-side factors. The citywide office vacancy rate reached a high of 17 percent in 1991, while average asking rents fell 20 percent from their mid-80s peak. (See Figure 1.)
An oversupply of office space was one factor causing the record-high vacancy rates. The 1989 recession came at the tail end of a speculative office development boom during the 1980s, in which New York City saw the development of 62 million square feet of office space.2 (For perspective, about 26 million square feet of office space has been built since 2000, excluding the redevelopment of the World Trade Center.) Much of that office space was built speculatively, without tenants in place at the time of construction, and the office market was unable to absorb the newly built space, even during the 1980s boom years. Vacancy rates continued to rise throughout the 1980s, even during periods of economic growth. This wave of speculation ultimately crested and crashed into the deep 1990 recession.
During this period, the office market also experienced multiple demand-side shocks. Job losses during the 1990 recession hurt the office market, as is common during most recessions. However, the office market was also affected by structural changes that further reduced the demand for office space. After rapid expansion in the 1980s, the financial services sector, which directly and indirectly drove much of the demand for New York City office space, entered a period of retrenchment, consolidation, and cost cutting. New technologies were also reshaping the space needs of financial services companies. The rise of computers and the internet allowed companies to reduce headcount and to shift their remaining “back office” functions to lower-cost locations, while retaining a smaller footprint in New York City for headquarters functions.3 Between 1990 and 1993, financial services employment fell by 13 percent to 458,000 jobs, a level it remains at today, despite continued growth in securities industry profits.4
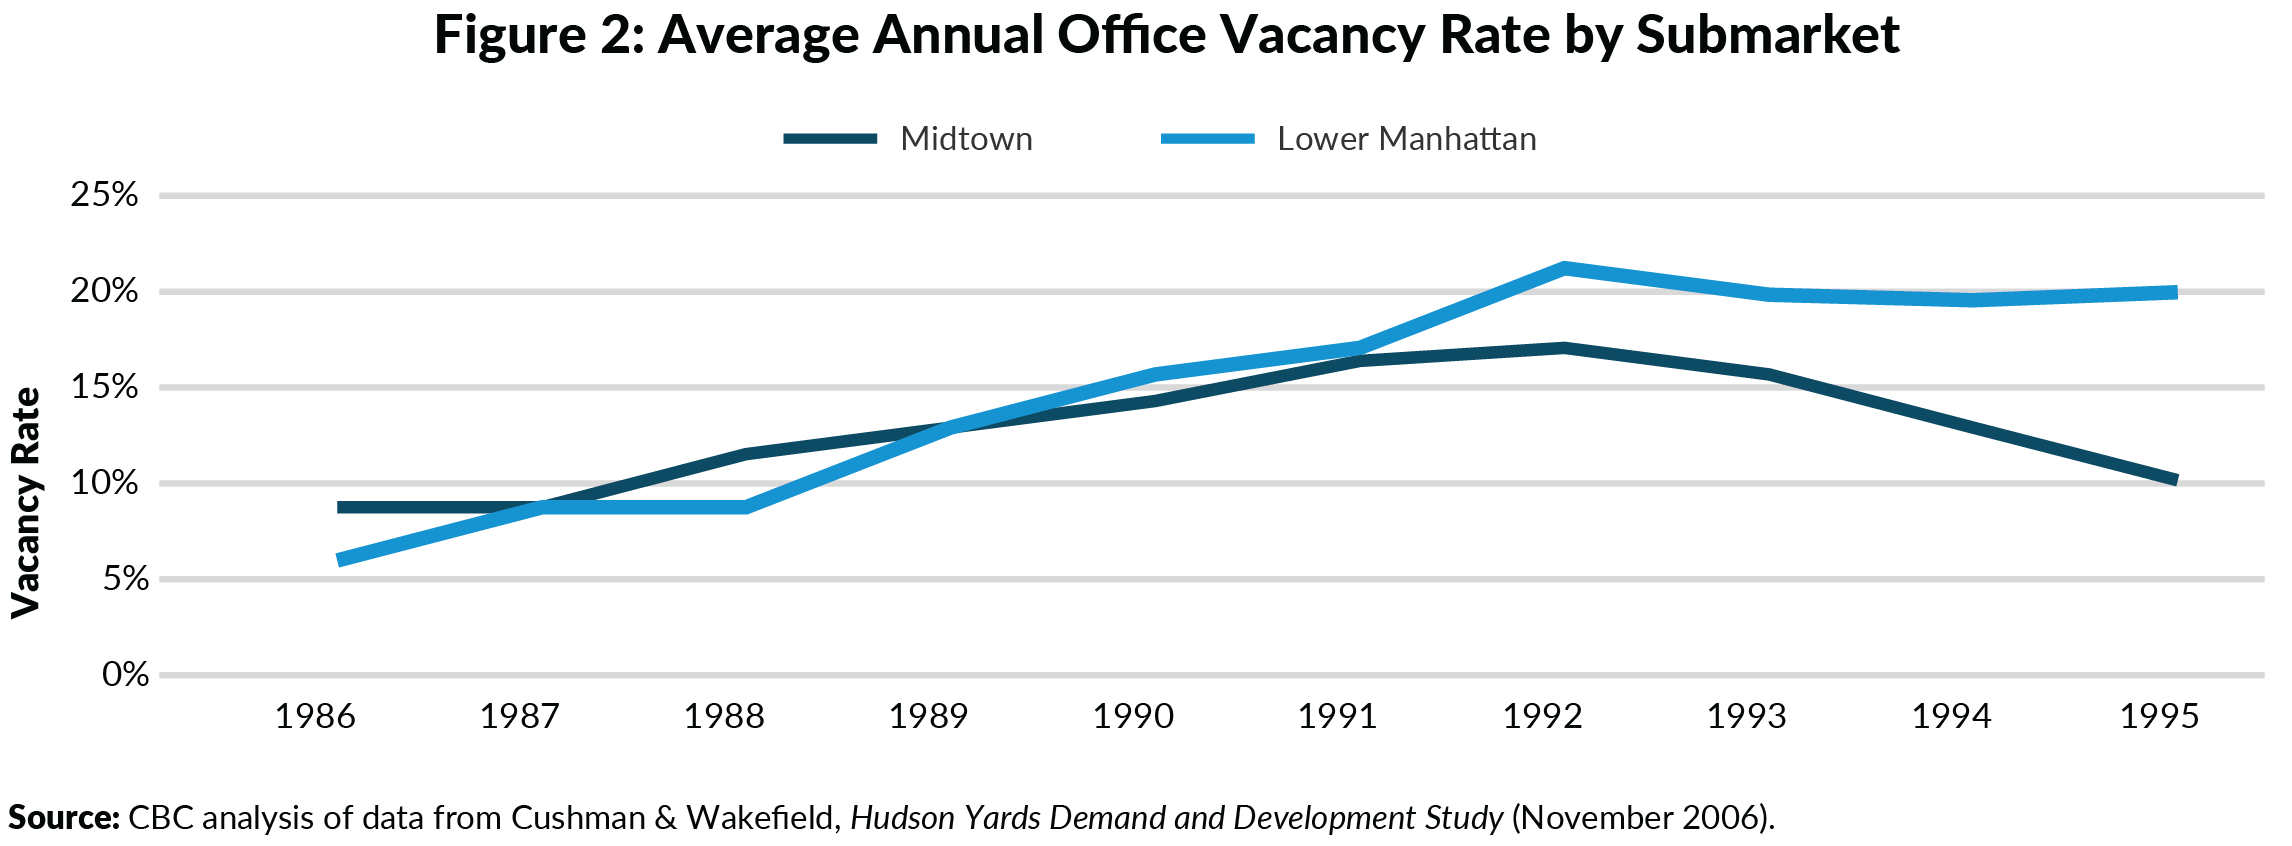
Over time, the vacancy crisis became concentrated in lower Manhattan. Lower Manhattan’s office market continued to struggle even after the city’s overall economy began to improve. From its 1987 peak, employment in lower Manhattan fell more than 20 percent, more than twice the citywide job loss rate. Quickly, vacancy rates rose and rents declined. By 1994, the lower Manhattan vacancy rate had reached 20 to 25 percent, with vacancy rates highest in older and outdated buildings.5 (See Figure 2.) By contrast, vacancy rates in the rest of Manhattan had already improved to 13 percent by 1995.6
Many pre-war lower Manhattan office buildings were functionally obsolete given the needs of modern tenants, while more modern buildings built in the 1950s and 1960s struggled to compete with office buildings built in the 1980s, many of which were in more desirable locations or were willing to offer significant concessions to attract tenants.7
As a result, market values and property tax revenues significantly decreased. Between 1991 and 1994, the aggregate assessed value of lower Manhattan office buildings had fallen 28 percent.8
Despite these economic challenges, by the early 1990s, New York’s fortunes were improving. The crime rate peaked in 1990 and slowly began to fall.9 The population had stabilized after nearly two decades of losses, as new immigrants and longtime residents helped revitalize neighborhoods that had suffered from decline and abandonment in previous decades. Residential growth in nearby neighborhoods of Battery Park City, SoHo, and Tribeca suggested there could be demand for housing elsewhere in lower Manhattan.
CITY AND STATE POLICY RESPONSES TO LOWER MANHATTAN'S CHALLENGES
The concentration of office vacancies in lower Manhattan, coupled with residential growth in nearby neighborhoods, prompted the development of several place-based strategies to stabilize and revitalize the neighborhood.
In October 1993, the Dinkins Administration released a plan that drew on two years of study by City officials and private industry. Its plan called for a combination of tax breaks, zoning changes, investments in open space and transit, and the creation of a business improvement district (BID) to revitalize lower Manhattan.10 Except for the BID proposal, which led to the founding of the Alliance for Downtown New York, the plan lost momentum after Mayor Dinkins lost his reelection campaign later that year.
However, the Giuliani Administration picked up many of the ideas from the Dinkins plan. The Giuliani Administration’s 1994 Lower Manhattan Revitalization Plan proposed various policies to transform downtown Manhattan into a mixed-use neighborhood by stabilizing the office market and attracting new residential, retail, and leisure uses. The plan proposed tax incentives to encourage office-to-residential conversions, which would both reduce the supply of outdated office space while also creating new residential units. Zoning changes would ease restrictions on minimum unit sizes and layouts of deep units, both of which had limited the potential of commercial conversions. The plan also called on the State to provide relief from other restrictions in the Multiple Dwelling Law (MDL) that limited the amount of space that could be converted. It also proposed incentives to attract new commercial tenants.
At that time, public officials and industry experts believed that property tax incentives were necessary to induce conversions at the scale needed to stabilize the office market and transform lower Manhattan into a mixed-use neighborhood. Policymakers cited two justifications for the incentive.
First, given that the residential market in lower Manhattan was still unproven, incentives were needed for developers to be able to rent units at competitive prices. Officials estimated that rents in lower Manhattan would be 10 to 20 percent lower than in nearby Tribeca or SoHo, which themselves were still emerging as residential communities. The development of Battery Park City had largely stalled by the late 1980s and faced an uncertain future. And lower Manhattan lacked the local-serving retail and amenities found in more established residential neighborhoods. Ann Weisbrod, who served as Senior Vice President for Economic Development for the Downtown Alliance in the 1990s, remarked in 1995 that “without the benefits, you couldn’t renovate these buildings and make them come into what the market will bear.”11
Second, most conversion projects would only become financially feasible if buildings could be acquired at significant discounts, in many cases at prices that valued the structures as having negative value. The City would not subsidize acquisitions with upfront capital subsidies, but the tax breaks would increase a developer’s net operating income enough to generate an adequate return on their investment that was commensurate with the risk they were taking.12 The Giuliani Administration hoped that the tax breaks “would pay for themselves through increased economic activity and the revenue it would produce.”13
In 1995, the State legislature approved a package of incentives and legal changes intended to encourage office-to-residential conversions and to attract and retain office tenants to lower Manhattan’s remaining office properties. The first incentive, named 421-g in reference to its section in the New York State Real Property Tax law, provided property tax breaks for converting commercial buildings into residential units. (Similar benefits were available for mixed-use buildings that included both commercial and residential space.)
The package also created the Commercial Revitalization Program, which offered energy subsidies and property tax and commercial rent tax breaks to qualified companies who signed leases in lower Manhattan—incentives that remain in place today.
The City and State also enacted regulatory reforms to eliminate or mitigate several constraints that limited potential conversions that would otherwise be financially and technically feasible. One significant constraint is that the MDL limits residential space in buildings built after 1961 to a floor area ratio (FAR) of 12. The State Legislature amended the MDL to exempt buildings in lower Manhattan that were built between 1961 and 1977 from the MDL’s restrictions on residential FAR exceeding 12.
The City Council also approved zoning changes introduced by City Hall to allow more conversions to happen as-of-right, including reducing the average minimum unit size from 1,800 square feet to 900 square feet, allowing units to include interior home offices and dens that otherwise would not be permitted.14 Changes to the Special Lower Manhattan District would later expand that to areas that did not allow residential uses as-of-right, and to encourage other streetscape and open space improvements intended to increase lower Manhattan’s attractiveness as a mixed-use neighborhood.
HOW THE 421-G PROGRAM WORKED
The 421-g program was available to owners of commercial buildings located in lower Manhattan, outside of Battery Park City, to incentivize the conversion of existing commercial buildings to residential use.15 Applicants were required to secure building alteration permits before June 2006 and complete construction by 2013.
The 421-g program was modelled in part on the existing Industrial and Commercial Incentive Program (ICIP). Like ICIP, 421-g provided both exemptions on the increases in assessments resulting from the conversions and abatements on pre-existing tax liability. The combination of exemptions and abatements meant that most 421-g conversions paid no property taxes in the first year after converting, with tax bills increasing slowly based on the growth in assessed value over time until the incentive’s phase-out was complete.
Buildings with 421-g benefits were exempted from increases in assessed value resulting from the conversion for 8 years followed by a 4-year phase out. Properties also received a 14-year property tax abatement, with 10 years fixed at the amount of the tax due in the first year following the conversion, followed by a 4-year phase out. Owners also received a 1-year exemption during construction. Landmark buildings were eligible for an additional year of both the exemption and the abatement. Tax reductions began in the fiscal year following completion of the conversion, officially marked by the issuance of a temporary certificate of occupancy.
The incentive was available to both rental and condominium conversions, and there were no affordability requirements. Rental units in buildings receiving 421-g benefits were required to be rent stabilized in every year that the property received benefits under the 421-g program. This required property owners to register rental units with the State and to obey all the regulations of the rent stabilization system. Property owners were permitted to deregulate units upon the expiration of the 421-g tax benefits and return them to market rate status. Condominium and co-operative apartments faced no restrictions on buyer incomes or sales prices.
A Case Study of 421-g Benefits
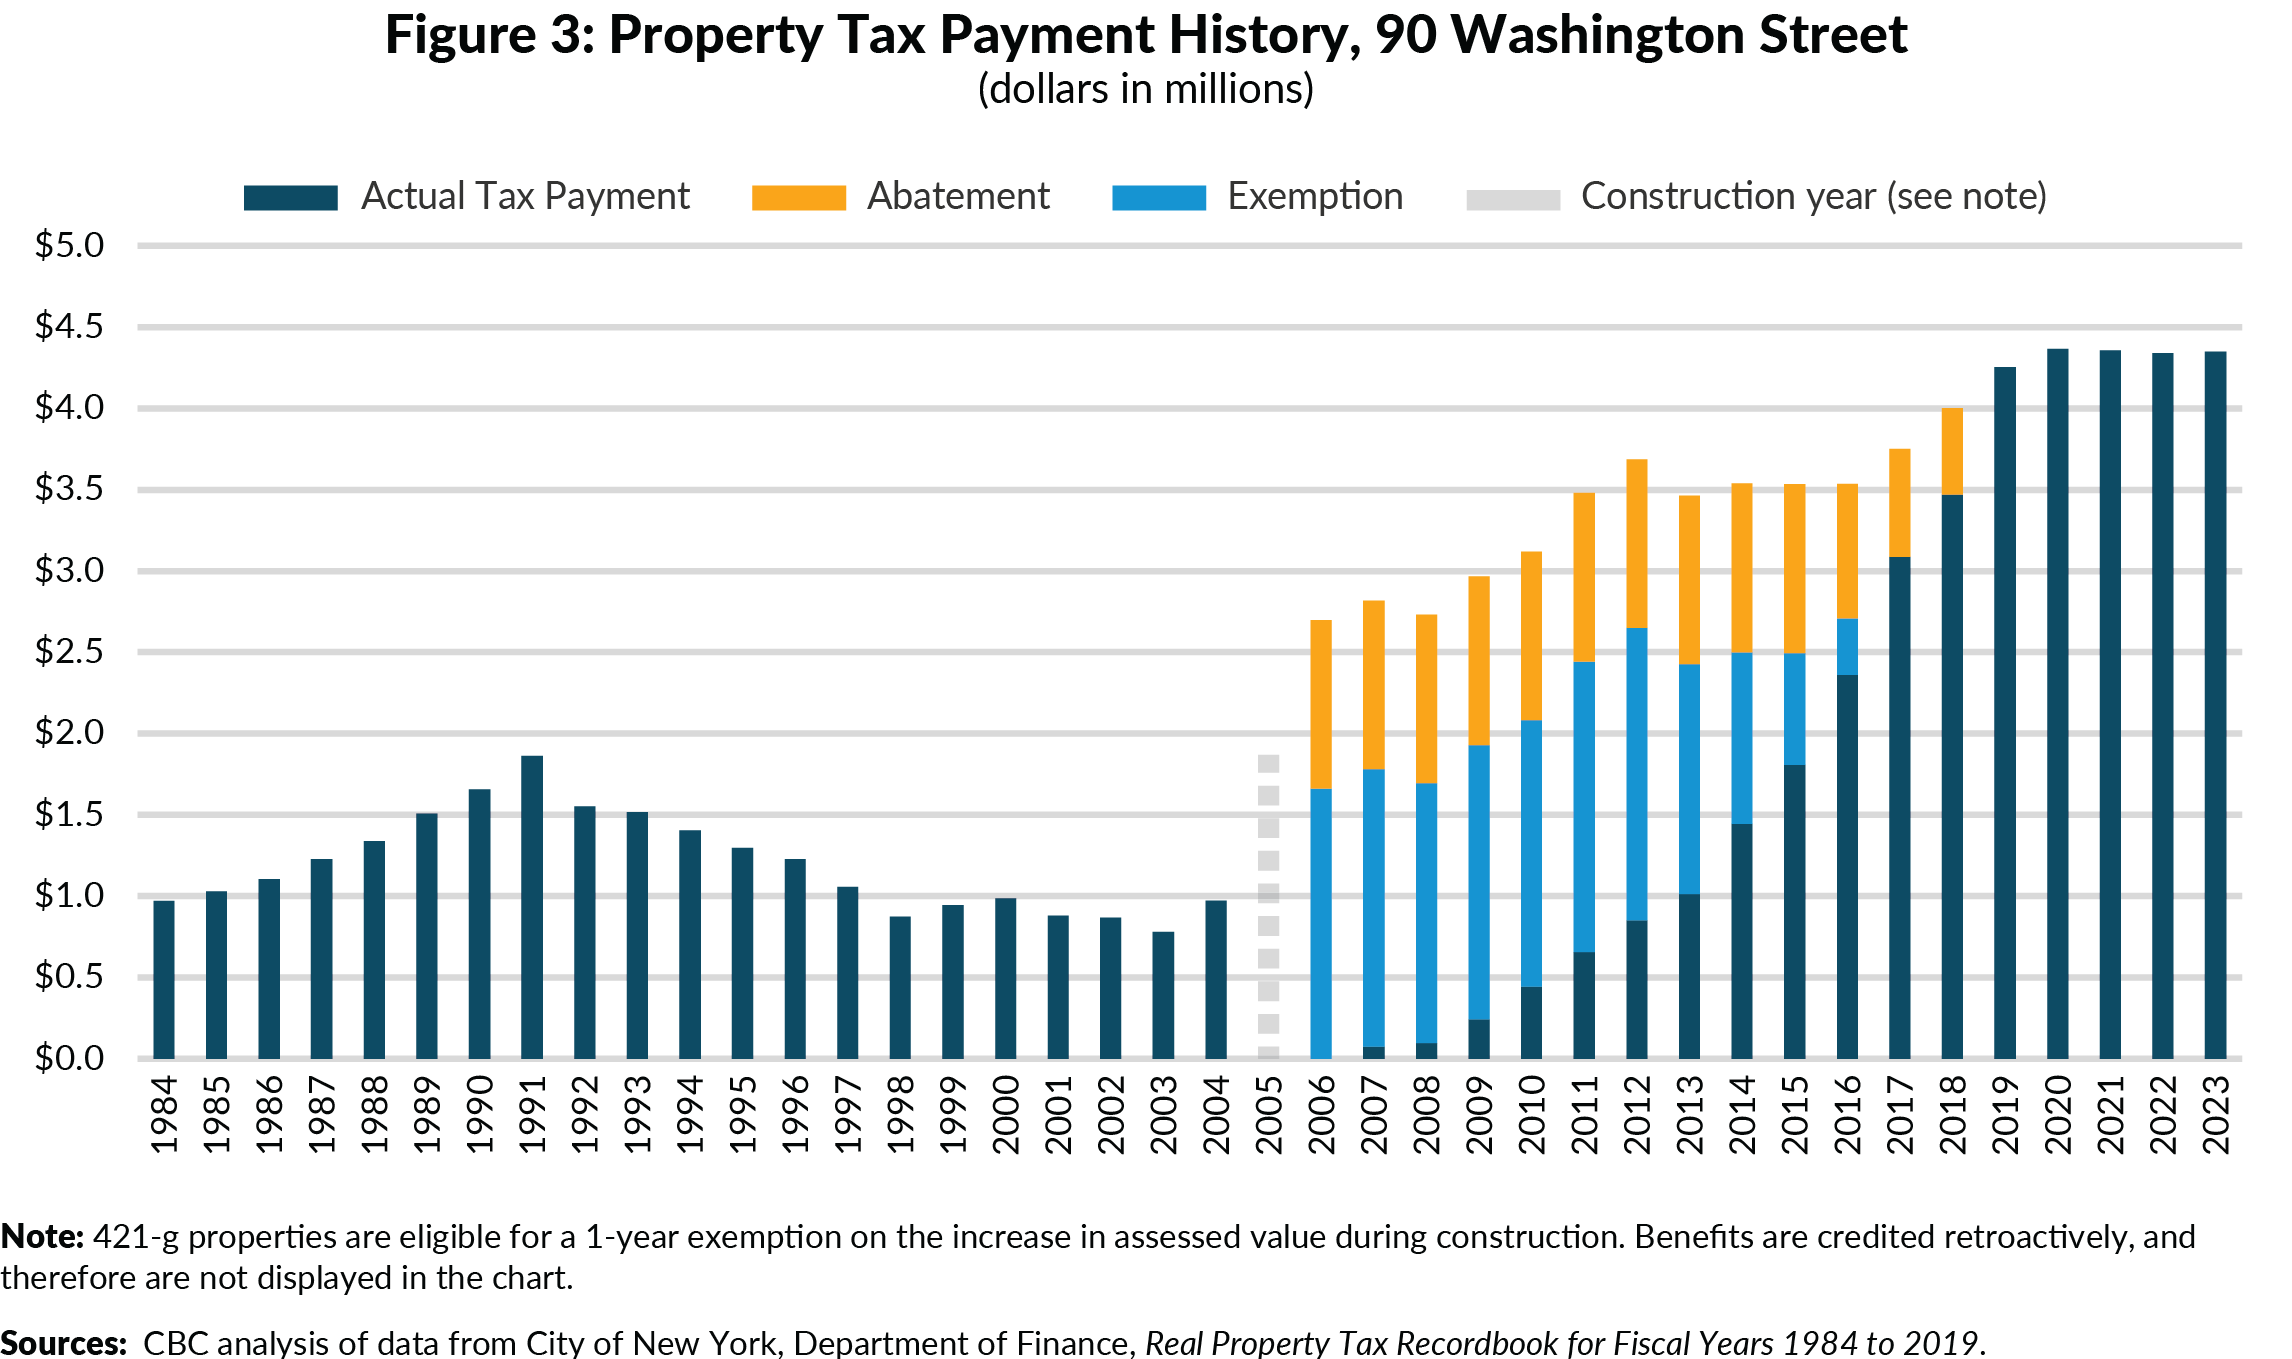
The combination of the property tax exemption and abatement provided significant savings to property owners. The conversion of 90 Washington Street, a 335,000 square foot building originally built in 1969, demonstrates how the exemption worked. (See Figure 3.)
The owners of 90 Washington secured a building permit to convert the building to residential in February 2003 and received a final certificate of occupancy in January 2005. The property first received 421-g tax benefits in fiscal year 2006.
Prior to conversion, the building’s market value had fallen from $48 million in fiscal year 1991 to a low of $17 million in fiscal year 2003.16 After completing construction in 2006, the building’s market value increased to $51 million. Without the 421-g program, the fiscal year 2006 tax bill on the converted property would have been $2.8 million. The exemption on the increase in assessed value lowered the tax liability to $1.09 million, which the property tax abatement wiped out in its first year, eliminating all tax liability. (See Figure 3.)
In the second year, the property began to pay a modest amount of taxes, around $78,000, as the building’s value increased, and the exemption and abatement values remained fixed. By the time both the exemption and abatements phased out, the property was valued at $85 million, four times its pre-conversion value, with an annual tax bill of $4.6 million. The total tax expenditure—or the amount of foregone taxes—was $29.6 million, or $75,000 per unit.
How the 421-g Program Was Used
The 421-g program proved to be more popular than many policymakers, public officials, and industry professionals expected. In 1995, when it was first created, City officials thought that the program would produce 200 to 300 units per year, or 2,000 units in total.17 Carl Weisbrod, then head of the Downtown Alliance, would increase that estimate to 7,000 units after developers filed permits for more than 2,000 units within the first 2 years of the program. Steven Spinola, then the President of the Real Estate Board of New York, thought that removing 3 million to 5 million square feet of office space would stabilize the lower Manhattan office market.18
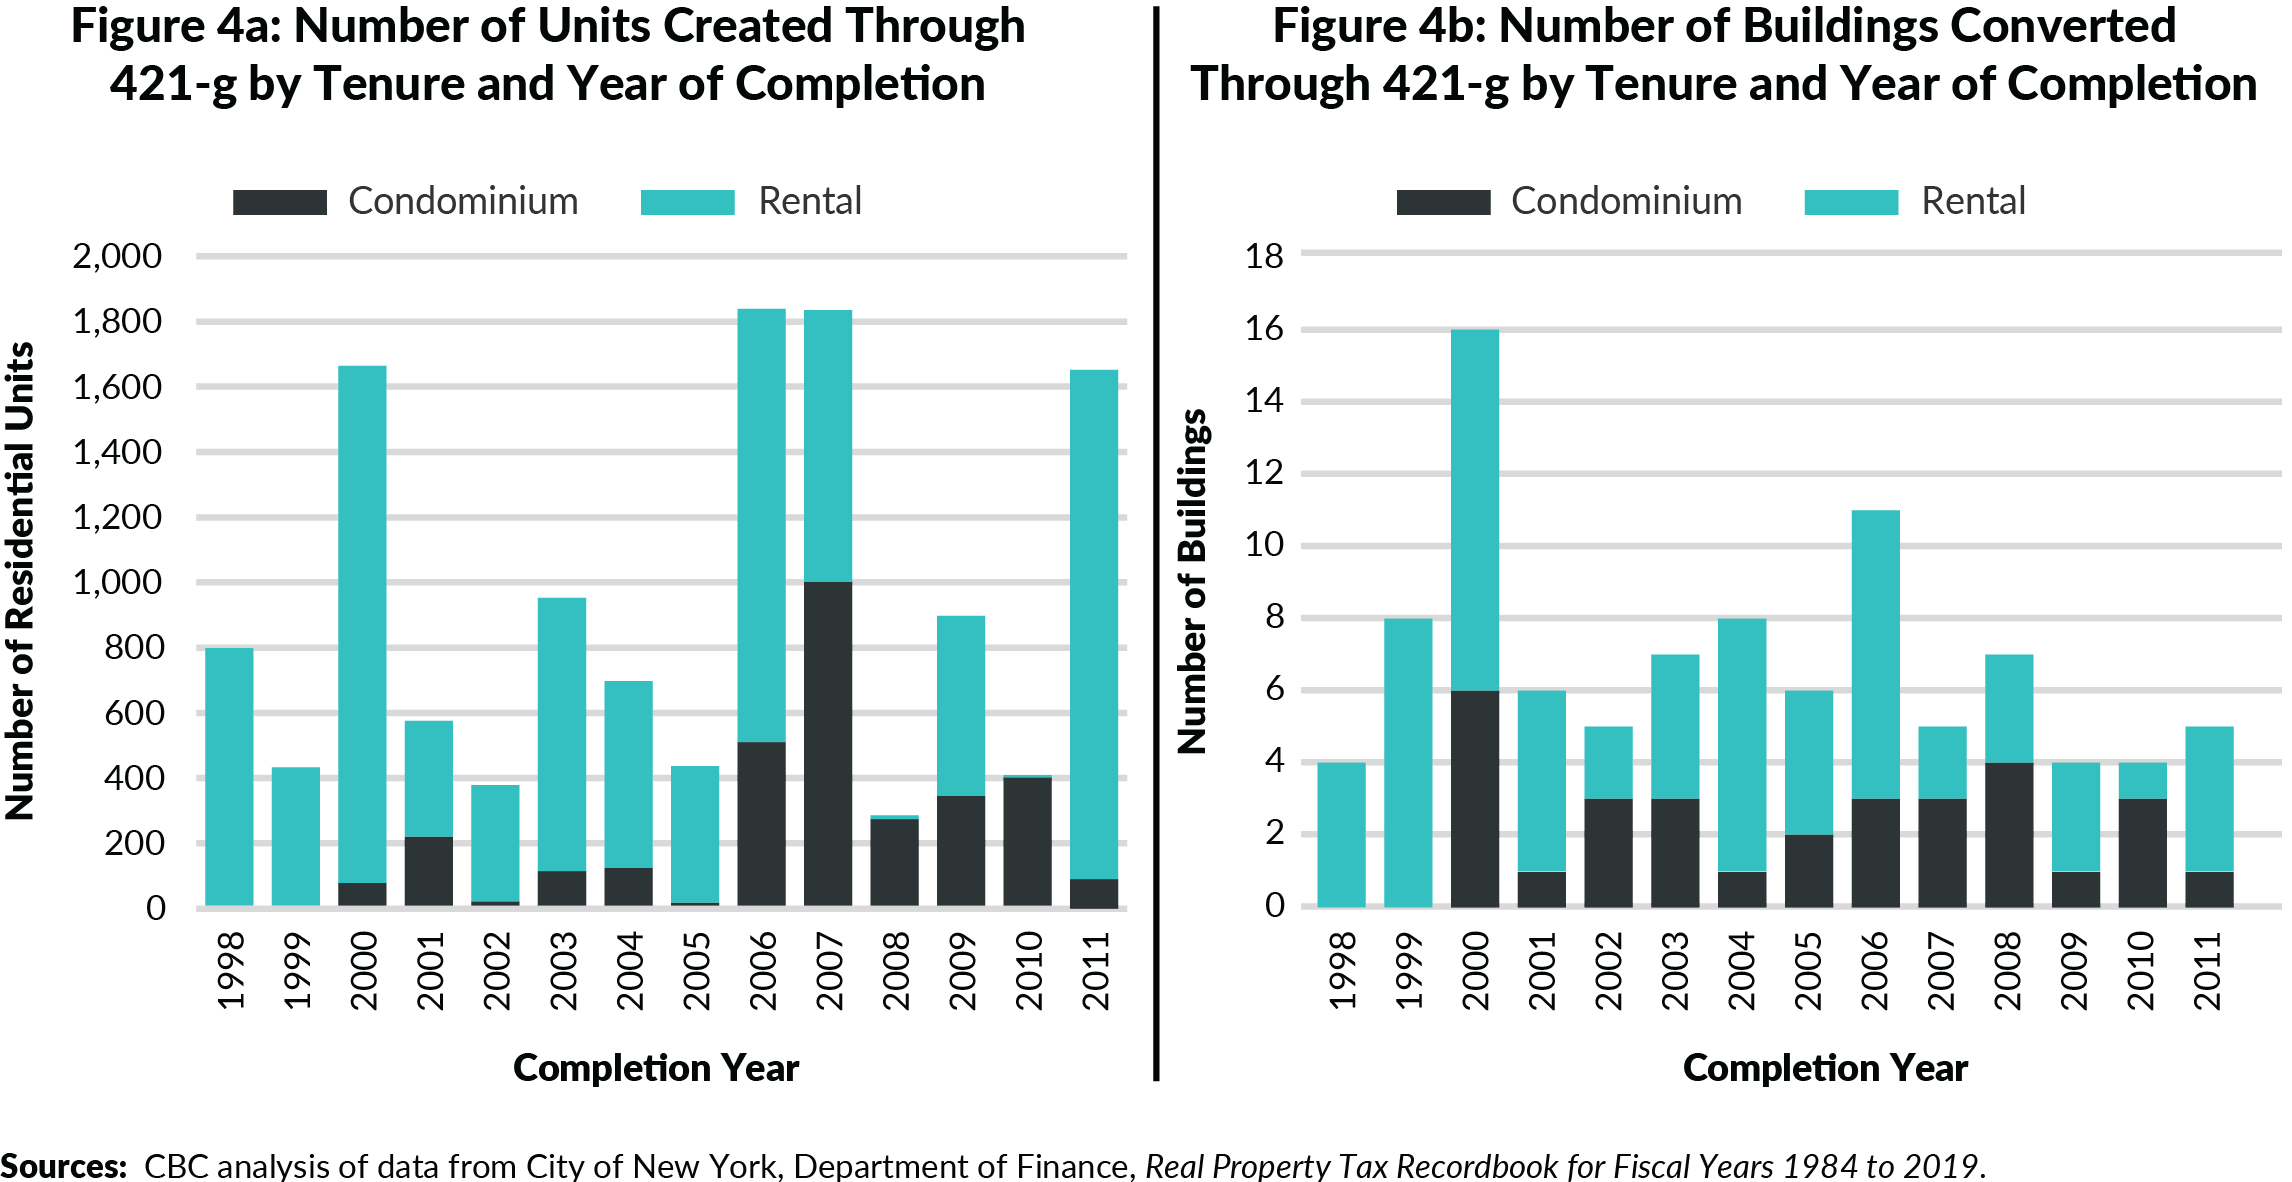
Ultimately, owners converted 98 office buildings with 12.8 million square feet of commercial space through the 421-g program, creating 12,865 new residential units.19 (See Table 1.)
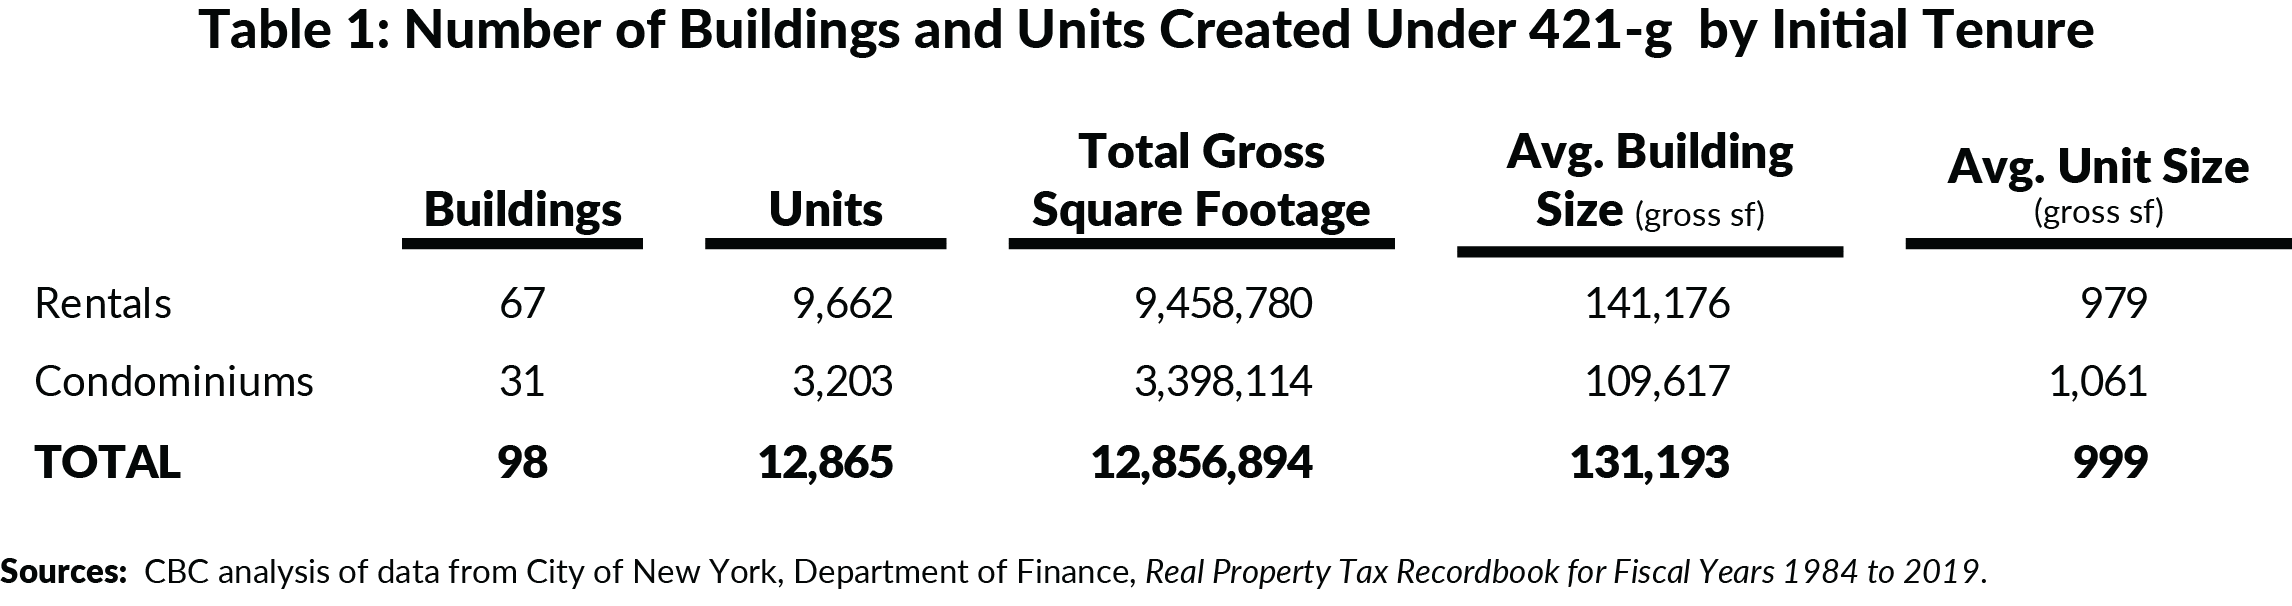
Approximately two-thirds of the buildings, containing 75 percent of units, were converted into rental units, with the remainder condominiums. (See Figures 4A and 4B.) In the early years of the program, nearly all the conversions were to rentals, but that changed over time. By the mid-2000s, when the condominium market improved, many developers began to convert buildings into condominiums instead. Some 421-g rental buildings were also subsequently converted to condominiums, as well, often after the initial tax breaks expired.
In the immediate wake of the program going into effect, there was a wave of 421-g conversions, many of which were in already vacant or nearly vacant buildings at the time of enactment. Within the first three years, the 421-g incentive was used to convert 28 buildings and to create 2,818 units, already exceeding initial expectations. A second wave of conversions started after September 11, 2001, and peaked in the run up to the program’s permit deadline in 2006, when another 4,304 units came online.
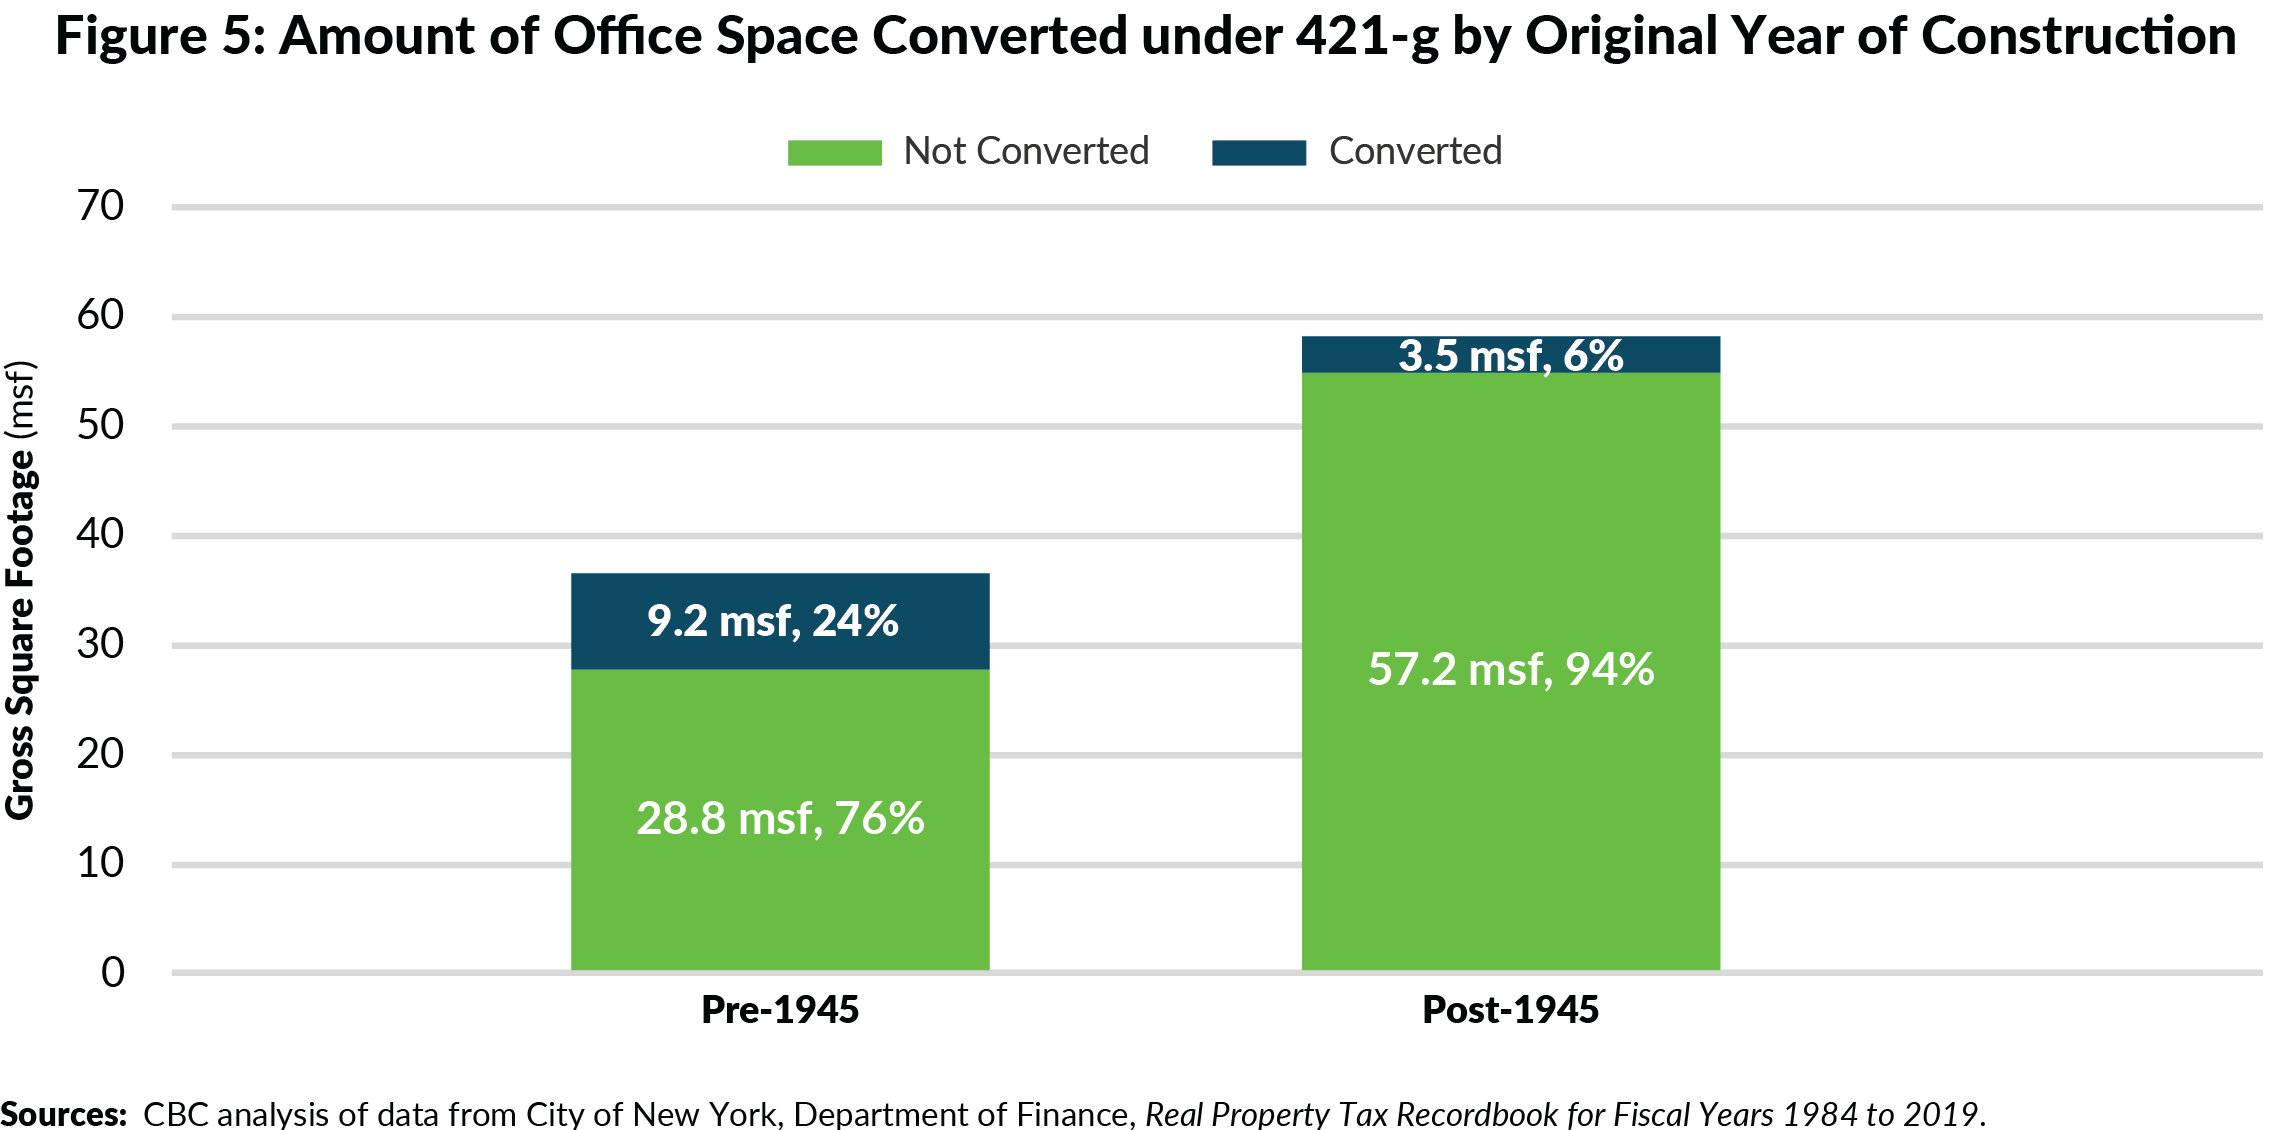
Buildings built prior to 1945 were also significantly more likely to convert under 421-g than more modern buildings. While vacancy rates when 421-g was created were roughly the same for buildings built before 1945 and those built in the 1950s and 1960s, the program was used most frequently for older buildings. Nearly one quarter of lower Manhattan’s pre-war office stock converted under 421-g as compared to just six percent of the postwar office stock. (See Figure 5.) (Overall, because the pre-war stock includes many small buildings, especially in historic districts like the South Street Seaport, prewar buildings represented 90 percent of buildings that converted but 61 percent of converted square footage.)
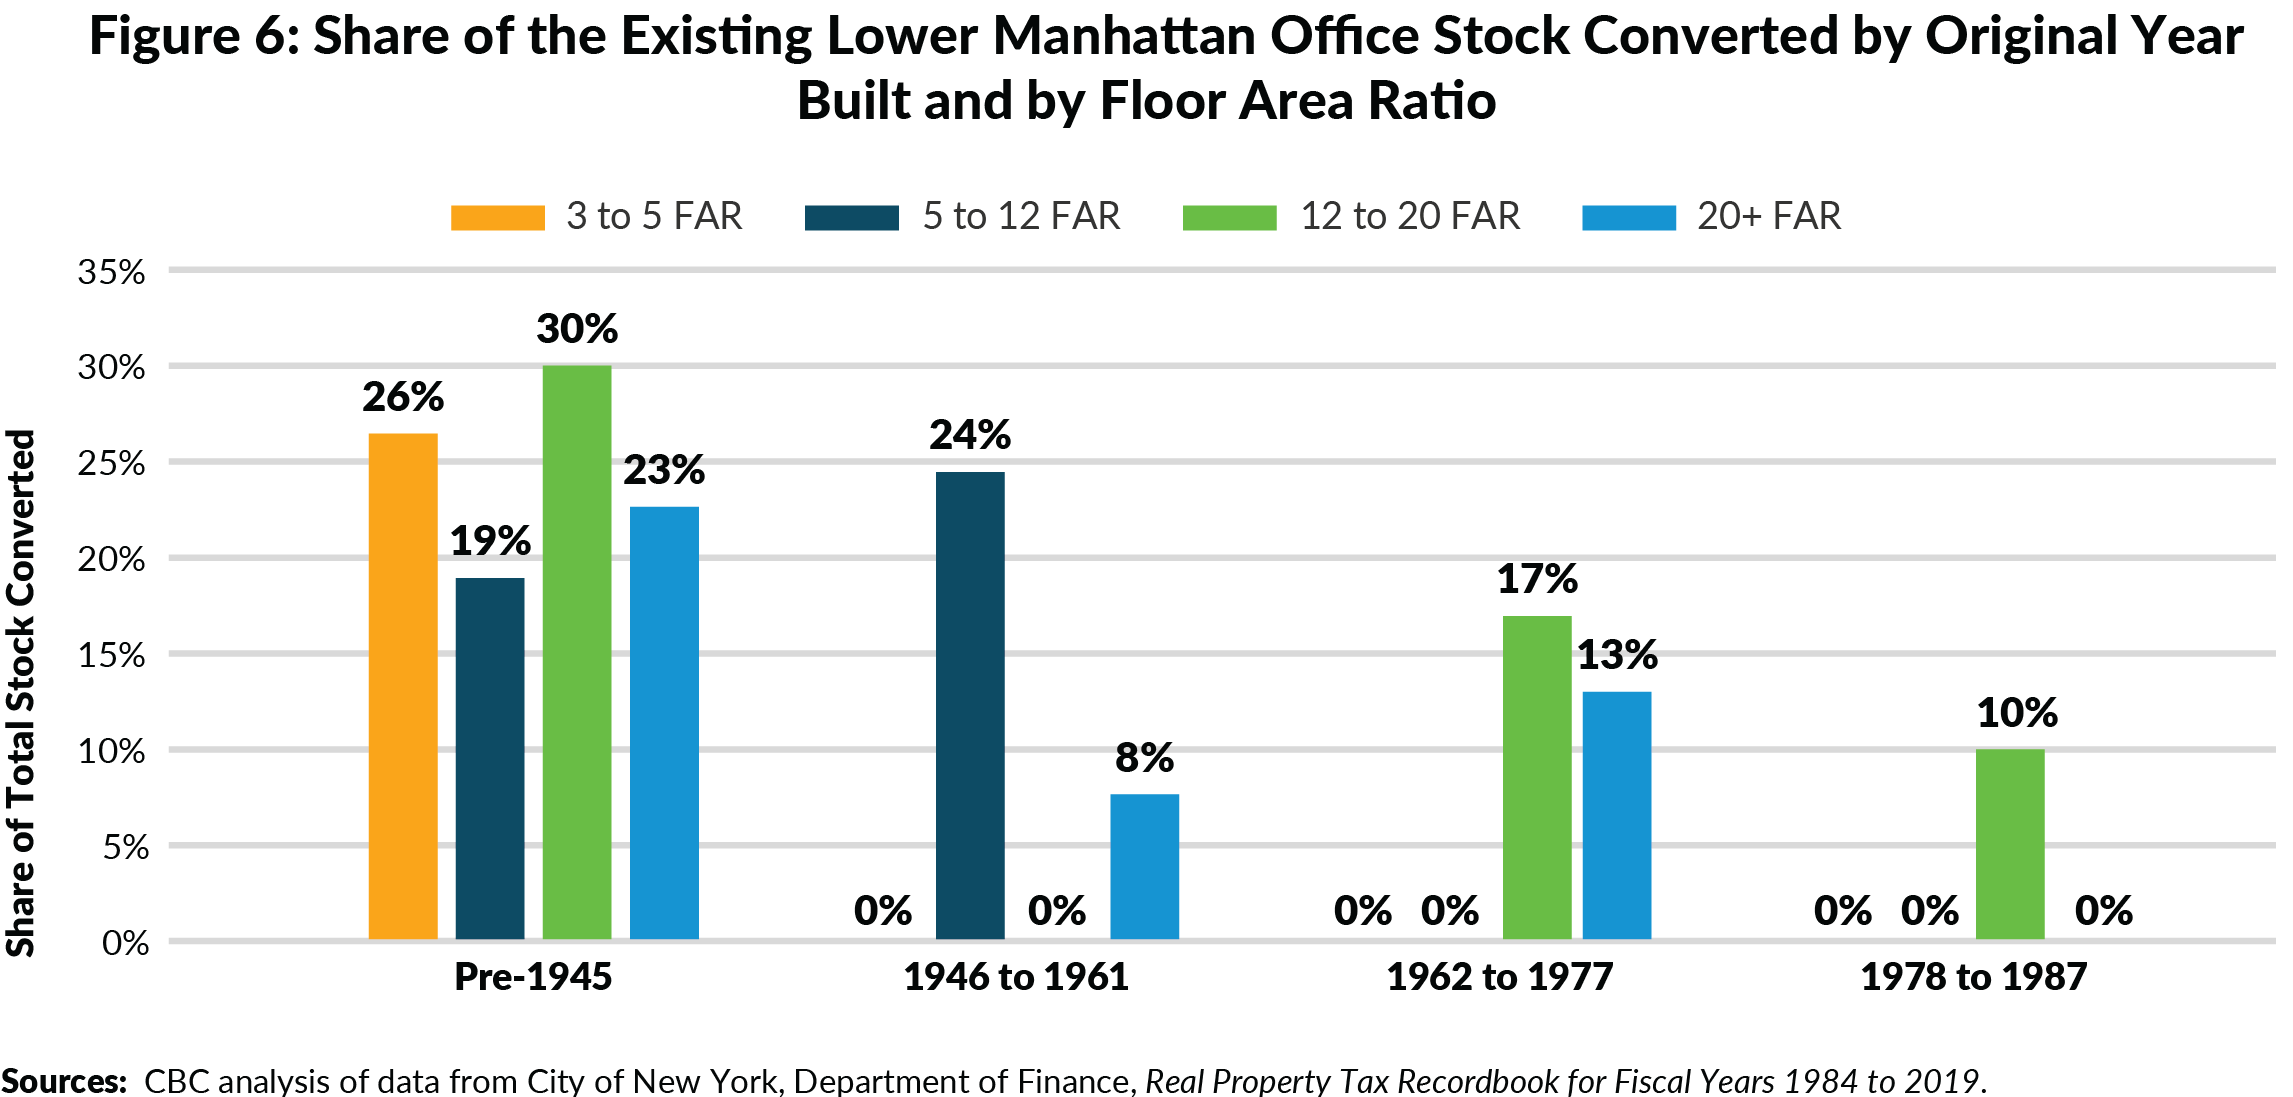
Pre-war buildings were also more likely to convert regardless of size, as measured by FAR. (See Figure 6.) Between 19 percent and 30 percent of the pre-war office stock converted across different FARs. While 24 percent of 1946 to 1961 buildings with FAR between 5 and 12 converted, the number of conversions in post-war buildings at other FARs occurred at lower rates, if at all.
Cost of the 421-g Program
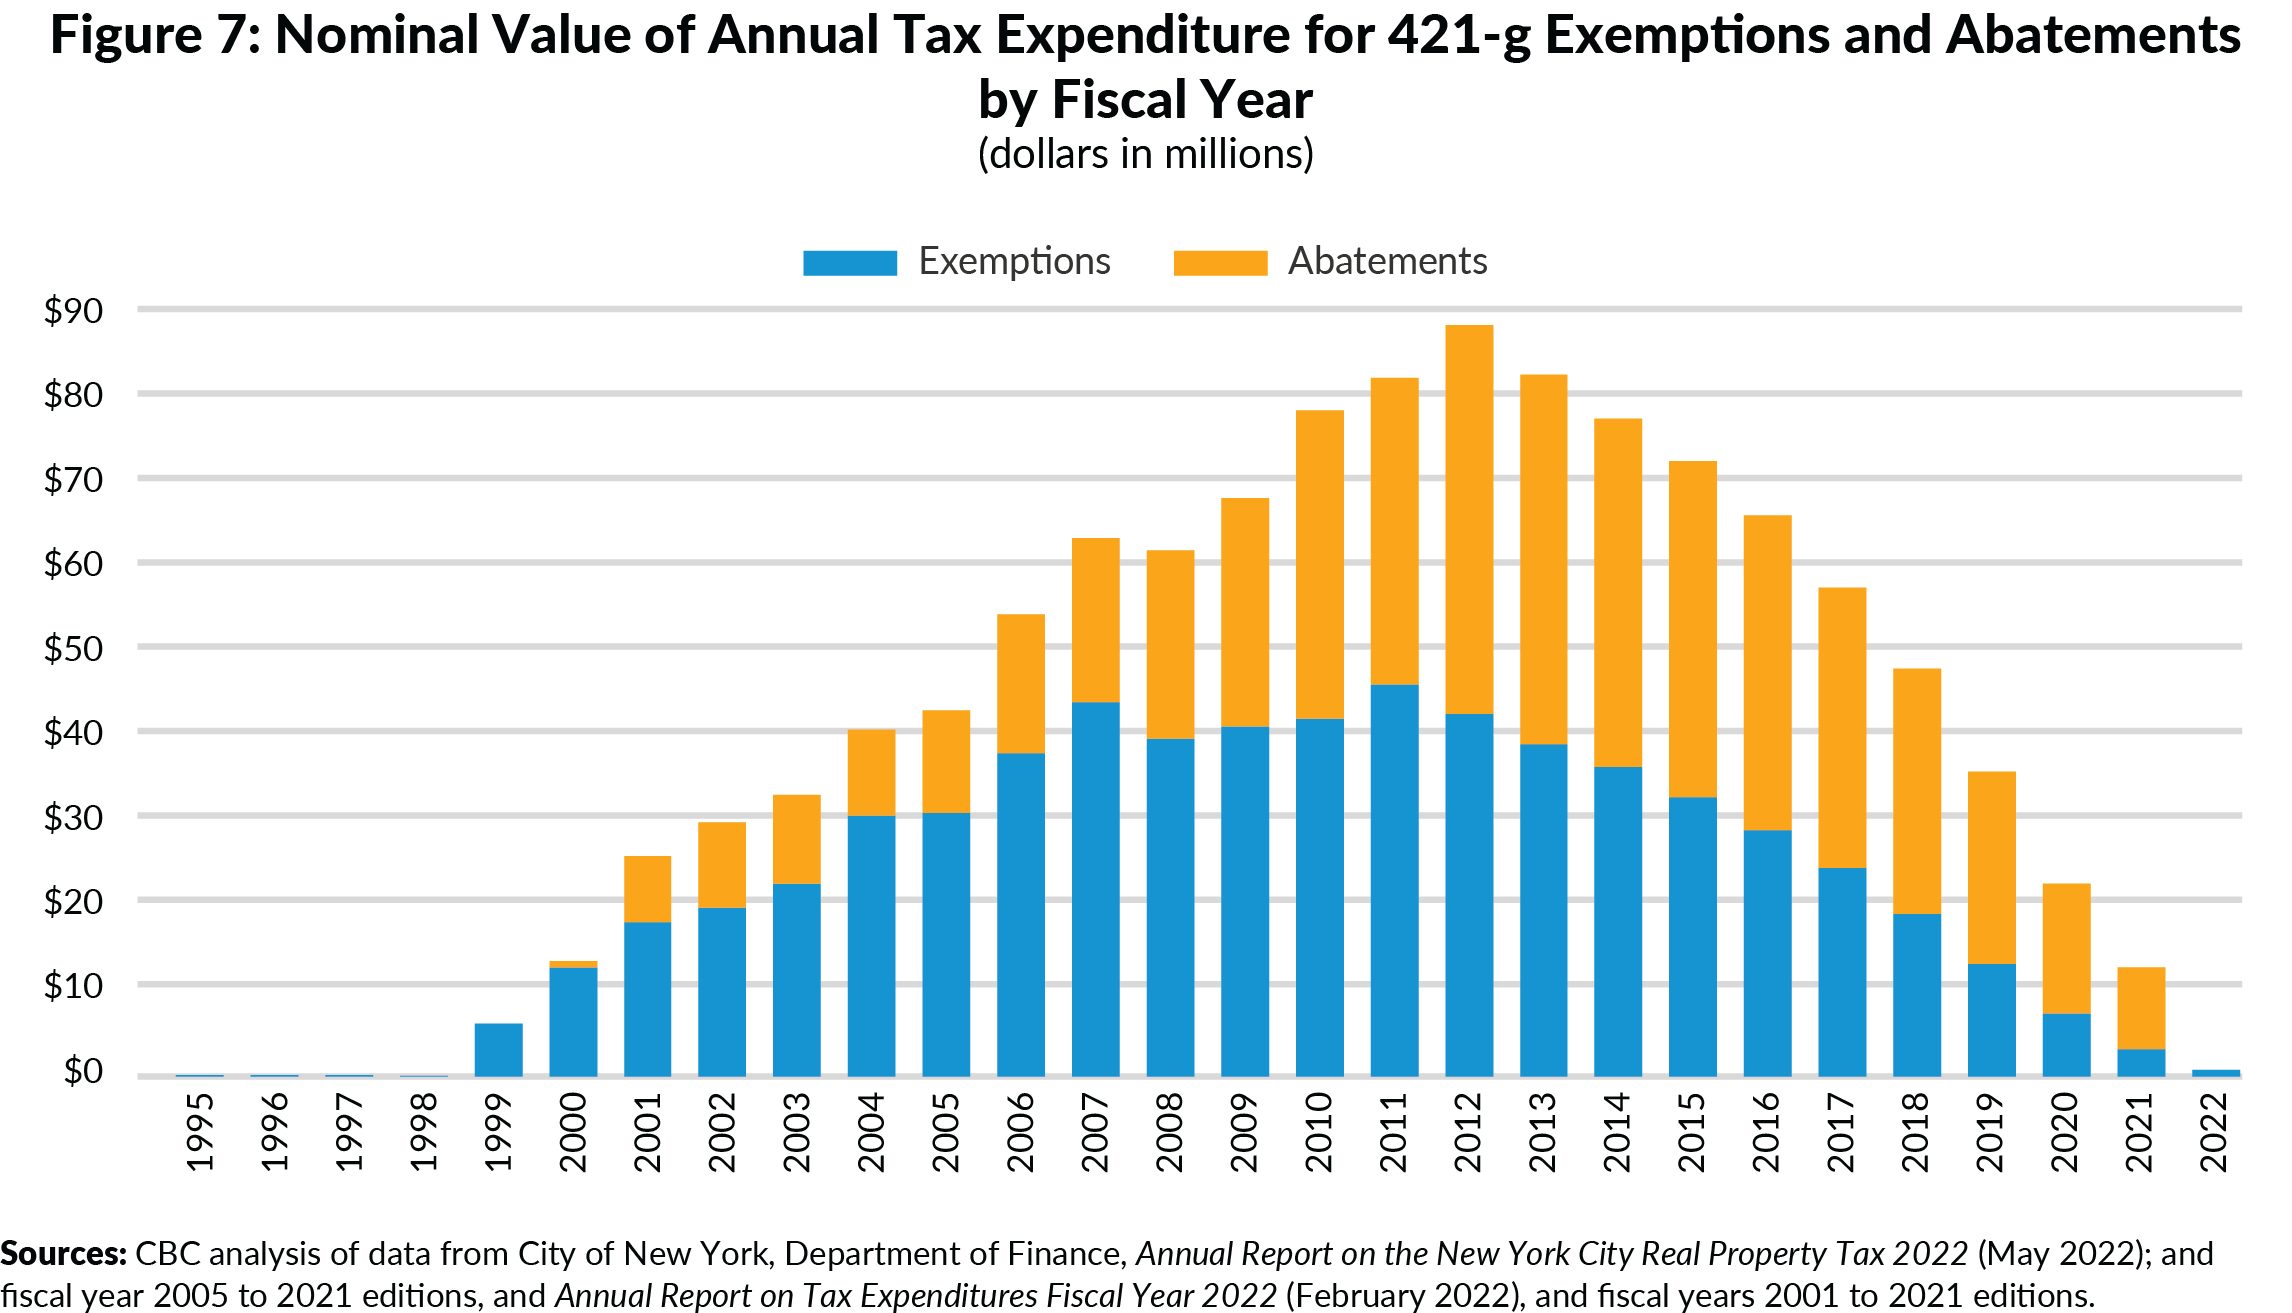
Through the end of fiscal year 2022, the nominal cost of the 421-g property tax incentive had reached at least $1.17 billion, or $92,000 per unit.20 (See Figure 7.) Of that total, $646 million was for the exemption and $529 million was for the abatement. However, the cost in constant 2022 dollars would have been higher given that these expenditures took place over 23 years. Adjusted based on the Consumer Price Index, the total tax expenditure would be $1.7 billion, or $132,000 per unit, in today’s dollars.
To date, neither the City nor the State has evaluated the program’s effectiveness or efficiency. Such analysis requires additional data on the specific income and expenses and acquisition and renovation costs of each building.
It is likely that 421-g provided more benefits than necessary for some projects, particularly later projects that may not have needed the same level or length of benefits provided to the initial projects.21 However, assuming that many conversions would not have happened without the 421-g incentive, a significant share of the $1.2 billion in tax expenditure would not have been created but for the increases in market value spurred by the incentivized residential conversions.
FACTORS THAT AFFECT THE FEASABILITY OF CONVERSIONS
In general, office-to-residential conversions face three types of challenges:
- Economic: Buildings that are candidates for conversion typically share a common set of preconditions: they have experienced a significant decline in value to the point at which they effectively become development sites; they are substantially vacant; they are functionally obsolete, requiring substantial capital investment; and the cost of converting to residential use presents a more profitable path forward than renovating it for other uses, keeping it as office space, or tearing down in favor of new development. Failing to meet any one of these economic preconditions could doom a conversion project.
- Physical: The complexity and cost of commercial conversions increases with building size. Larger buildings typically take longer to vacate and are more costly to renovate. Buildings with large and deep floor plates and glass exteriors also require substantial renovations to create sufficient light and air and to add operable windows. These costs may be uneconomical.
- Regulatory: City and State regulations also limit the potential of conversions that otherwise might be financially and physically feasible. These restrictions include a cap on the amount of residential space in certain buildings, and restrictions intended to allow sufficient light and air into units. Some are warranted; others, like the density limits, are arbitrary and apply only some units.
These factors were all in play and affected which buildings converted through 421-g and which did not.
Economic
Prior to conversion, the assessed value of most buildings that used 421-g decreased by 20 percent to 40 percent, as determined by the City’s Department of Finance (DOF) to calculate property taxes. Actual market values likely fell further even further. Many buildings sold at steep discounts to both replacement cost and to their DOF valuations.
Commercial leases are long in duration, and in a large building, lease expirations often roll at different times. Absent costly buyouts of tenants, vacating a building can take years. But as the economy improved throughout the 1990s, and as the market slowly absorbed the space built in 1980s, renovating post-war office buildings in lower Manhattan became a more viable financial option. Vacancy rates in lower Manhattan fell to below 5 percent by 1999, and outside of the period immediately after 9/11, remained around 10 percent for the next two decades.
Physical
Most post-war office buildings have large and deep floor plates, mechanical heating and cooling, and glass curtain walls without operable windows. This allows for windowless interior workspaces that are permissible under office building and zoning rules but makes many buildings ill-suited for residential conversion.
Some post-war buildings can be conversion candidates despite these physical constraints, but most require substantial renovations, such as adding elevators and plumbing, upgrading utilities, carving out internal space for courtyards, replacing the façade, and adding windows. Even when feasible, these projects are technically complex and costly.22 In many cases, these renovations are too costly to finance.
Regulatory
New York City and New York State have a unique set of laws and regulations that limit the potential of office-to-residential conversions.
The most prominent is the New York State Multiple Dwelling Law’s (MDL) density limit for residential buildings. For buildings built after 1961, residential floor area cannot exceed 12 times its lot area—the FAR cap. The FAR cap also applies to the conversion of commercial buildings built after 1961. For example, on a 1,000 square foot lot, a building cannot have more than 12,000 square feet of residential space. The FAR cap only applies to residential space; there is no limit on commercial uses.
In lower Manhattan, following regulatory changes enacted by the State Legislature along with 421-g, the FAR cap applies to all new buildings built after 1977 and conversions of buildings built after 1977.23 Therefore, while buildings built after 1977 cannot exceed a residential FAR of 12, those built prior to that date face no FAR cap.
Lifting the downtown FAR cap on buildings built between 1961 and 1977 had a modestly positive impact on conversions, but the cap proved still to be a constraint on post-1977 buildings. Ultimately, 12 post-war buildings were converted under 421-g:
- Three built in the 1950s that would have been exempt from the FAR cap anyway;
- Six built between 1961 and 1977 that were exempt only because the year limit was raised for lower Manhattan; and
- Three buildings built after 1977 and subject to the FAR cap.
Of the buildings built between 1961 and 1977, all six were converted to entirely residential buildings and denser than 12 FAR. This would not have been permitted if not for the regulatory change. As a result, the buildings yielded 50 percent more residential units than if they had been capped at 12 FAR.
By contrast, residential space in the three post-1977 conversions was capped at 12 FAR, but the buildings included other uses that allowed expanded floor area. In each case, the remaining space had to be preserved as commercial space such as retail or hotels. The effect of the FAR cap for these projects reduced the potential residential unit count by 33 percent.
Furthermore, given the low rate of conversion among post-1977 buildings, it is unknown how many additional buildings might have been candidates for conversion if not for the FAR cap.
LEGACY OF 421-G
While its efficiency has never been studied, 421-g helped achieve the City and State’s goals of sparking residential growth in lower Manhattan, stabilizing the office market, and proving the viability of office-to-residential conversions.
Between 1990 and 2020, lower Manhattan’s housing stock increased 200 percent, or 30,000 units, through both new development and conversion projects. Of those units, 43 percent were directly created through 421-g, with the remaining 57 percent added outside of the program. That level of housing production likely would not have occurred if not for the proof of concept provided by the early 421-g conversions.
What remains uncertain is the extent to which incentives are necessary to encourage the level and types of conversions desired. Office-to-residential conversions have continued in lower Manhattan since the expiration of 421-g, although at a slower pace. At least 10 lower Manhattan office buildings have been converted to residential use since the 2006 permit deadline, delivering 3,171 units to the market. Conversions have included both rentals and condominiums, and none received tax breaks.
More research is needed to determine why those 10 projects went forward, whether they have been financially successful, and whether regulatory constraints held back potential conversions that might otherwise have been economically or technically feasible.
What Is Different Today
Another consideration is that economic fundamentals today are stronger than they were in the 1990s. The number of jobs in New York City is 28 percent higher in 2022 compared to the 1989 peak, with employers having added one million jobs over that period. However, economic shifts, particularly remote work, present significant risks to the office market.
The office-using sector is also both larger and more diverse than it was in the 1990s. Total office-using employment increased by 200,000 jobs since 1989, even as financial services employment remained below 1990 levels. All the growth has come from non-financial sector tenants in advertising, media, technology, professional services, and other sectors. This economic diversity means that the city’s office market is less vulnerable to downturns or shocks in any one industry. Furthermore, the number of jobs in office-using sectors also remained high throughout the pandemic, even if most of those workers were not physically present in their offices five days per week.
The market for office space also has not seen a speculative development wave since the 1980s. Even though the market added nearly 27 million square feet of new office space between 2000 and 2022, net of the space rebuilt at the World Trade Center, that space has been steadily leased up by tenants. Despite the steady supply of office space being added to the market, vacancy rates remained steady at 8 to 11 percent between the great financial crisis of 2008 and the start of the pandemic in 2020.
However, there are significant risks to the office market on the horizon.
- Remote and hybrid work schedules will likely persist at unknown levels and may well affect tenants’ decision-making as their existing leases come up for renewal. Daily office occupancy rates have stalled at just below 50 percent according to multiple surveys and show little sign of increasing.24
- The demand for office space is unknown in the next recession. Employment levels in the office-using sectors have held steady through the pandemic, even as office vacancy rates rose, and barring any changes, the market will likely enter the next recession with an abnormally high vacancy rate.
- Eventually higher vacancy rates will decrease valuations. Despite an early shock, there have yet to be significant, widespread decreases in assessed values at the level seen in the early 1990s. While some properties are selling on the open market at discounts to pre-pandemic valuations, per square foot prices remain well above the point at which many office-to-residential conversion projects might be financially feasible.
A recent estimate of the breakeven point for conversions found that residential conversions only become financially feasible when building prices fall below $262 per square foot, assuming renovation costs of $100 to $200 per square foot.25 This is a significant discount to the cost of building a new office building, which averages $750 to $1,000 per square foot in New York City before land costs, or a new Manhattan residential building, which range in cost from $550 to $725 per square foot before land.26
In the last year, several well-located office buildings have sold at values of more than $1,000 per square foot.27 By contrast, a lower Manhattan office building that is likely to be converted to residential use is in contract to be sold at a value of $443 per square foot.28 Another recently converted building recently sold for $732 per square foot after finishing the conversion process.29
LESSONS FOR A FUTURE INCENTIVE PROGRAM
The experience of the 421-g program yields some lessons that should inform the current debate over office-to-residential conversions.
Conversions are a viable approach to revitalizing obsolete office buildings, provided there is an efficient regulatory and approval process. Several conditions must be met:
- Regulatory relief of various forms is essential, including lifting the FAR cap. While the lower Manhattan plan included some regulatory changes that helped enable more conversions, more changes are likely needed to unlock the potential of future projects. This includes eliminating the FAR cap for conversions, since at least 40 percent of Manhattan office space by square footage is potentially limited by the cap based on building’s original year of construction. Other forms of regulatory and zoning relief would help increase the feasibility of other projects, particularly those located in manufacturing and commercial districts where residential uses are not allowed as-of-right.
- An as-of-right approvals process is needed. The 421-g program gave significant incentive to building owners to convert outdated office buildings, but the economic and regulatory conditions had to be in place for those conversions to be possible. The pace of conversions was enabled both by significant decreases in value and by the ability to convert buildings as-of-right, meaning that owners were not required to secure any discretionary approvals for building permits, zoning relief, or tax incentives for conversion projects. This was critical to ensuring that the market was able to dictate when and where office-to-residential conversions make sense. By contrast, various efforts by State policymakers to encourage hotel-to-residential conversions have failed to yield any conversions, in part because lawmakers did not pair funding with sufficient regulatory relief.30
- Care is needed to design a cost-effective incentive. Policymakers did not conduct a retroactive analysis of 421-g’s effectiveness or efficiency. The program was costly, and for a subset of projects, most likely provided subsidies that were more than necessary to incentivize conversions. However, it also achieved its stated goals and incentivized many conversions more quickly than they otherwise would have, or that may not have occurred at all.
Questions to be Answered to Design a New Construction Incentive
Regulatory changes and some incentive may be needed if the goal is to catalyze or sustain office-to-residential conversions in some areas, particularly if there is a desire to include affordability requirements.
While market-rate conversions have continued without incentives since the expiration of 421-g, conversions are now happening at a slower pace and none of the projects have included below market rate units. As with new construction, which until recently was eligible for tax breaks under the 421-a program, mixed-income residential rental conversions most likely would require tax breaks to be financially feasible.
Drawing on the history of 421-g, the design of a new conversion incentive should be grounded in the answers to the following four questions:
- Is the vacancy crisis concentrated or widely dispersed? If vacancies are concentrated in certain types of buildings or in certain neighborhoods, the policy response should be place-based, as it was with the 1990s lower Manhattan plan. By contrast, if it is widely spread across the office market, there should be a broad-based or citywide response.
- What are the goals of the conversion program? Depending on how the office market evolves in the coming years, the policies created in response may need to be tailored to changing needs and different goals. Is a plan needed to reduce the supply of office space? Do officials want to transform central business districts into mixed-use neighborhoods? Is the conversion program part of a broader housing strategy? Are incentives needed to make rentals competitive with condos for acquisitions? Are conversions part of a fair housing plan to build more mixed-income rentals in the Manhattan core? Different priorities would be supported by different policies. For example, to encourage mixed-use neighborhoods, City Planning may need to propose neighborhood rezonings to change use restrictions in specific special districts; broader changes likely would require citywide text amendments. Policymakers may also want to design an incentive specifically to catalyze or accelerate the pace of conversions more generally, particularly for neighborhoods or building types that historically have not seen much conversion activity.
- What incentives are needed to advance these goals, in which circumstances, and at what levels? Any conversion program should be based on a detailed financial feasibility analysis that looks at the types of conversions that would be feasible without subsidy, and which would require subsidies. For those that require subsidy, they should also estimate how much is necessary and for how long to incentivize the marginal project, and the amount of subsidy needed for different types of projects at different levels and shares of affordability. Policymakers should also consider different incentive structures to limit the City’s fiscal downside risk. For example, a new incentive could be capped based on square footage rather than time, similar to the model used in Hudson Yards, to reward first movers, phasing out as conversion projects become less risky. Another option could be to offer a short-term exemption on any increase in assessed value for all conversion projects, for example, while reserving abatements on pre-existing taxes for projects that meet certain affordability targets.
- Is it cost-effective? How would the cost of a conversion incentive compare to alternative subsidy options for ground-up development? All 100 percent affordable and even many mixed-income rentals in the Manhattan core require a combination of public subsidies to be viable, including 421-a tax breaks, City capital subsidies, and even bond financing. Conversions may be a more cost-effective tool for generating those units. Similarly, the public cost of subsidizing office-to-residential conversions should be compared to the cost to acquire and renovate existing multifamily buildings.
The current uncertainty about the future of the office market presents an opportunity to convert underutilized or obsolete office buildings into much-needed housing. To make the most of the opportunity, however, careful study and thoughtful policy design are critically important. Policymakers have the chance to remove barriers to otherwise feasible conversion projects. If done well, conversions can enhance the long-term competitiveness of New York, protect its property tax base, and improve the lives of its residents, but this future is only possible if policymakers get the details right.
Footnotes
- Jason Bram, “New York City’s Economy before and after September 11,” Federal Reserve Bank of New York (February 2003), https://www.newyorkfed.org/medialibrary/media/research/current_issues/ci9-2.pdf; Matthew C. Klein “Yes, the early 1990s were really bad,” Financial Times (October 6, 2016), https://www.ft.com/content/2d31897e-d0a3-3708-92a8-76ab857ef98f; and U.S. Bureau of Labor Statistics and Federal Reserve Bank of St. Louis, All Employees: Total Nonfarm in New York City, NY, (accessed November 30, 2022), https://fred.stlouisfed.org/series/SMU36935610000000001.
- Therese E. Byrne and David Shulman, “Manhattan Office Market II: Beyond the Bear Market” Solomon Brothers, (June 1991); and Thomas J. Lueck, “Decline Follows a 2-Decade Boom in Lower Manhattan” New York Times (Sept 12, 1991), https://www.nytimes.com/1991/09/12/nyregion/decline-follows-a-2-decade-boom-in-lower-manhattan.html.
- Therese E. Byrne and David Shulman, “Manhattan Office Market II: Beyond the Bear Market” Solomon Brothers (June 1991).
- U.S. Bureau of Labor Statistics and Federal Reserve Bank of St. Louis, All Employees: Total Nonfarm in New York City, NY, (accessed November 30, 2022) https://fred.stlouisfed.org/series/SMU36935610000000001.
- Vacancy rates in lower Manhattan vary across different market reports. The discrepancy largely depends on whether the analysts include vacant space that was being held off the market in anticipation of redevelopment or renovation.
- Cushman & Wakefield, Hudson Yards Demand and Development Study (November 2006), http://nycbonds.org/HYIC/pdf/HYIC_2007_A_Appendix.pdf.
- John E. Lodge, “An Analysis of the Lower Manhattan Revitalization Plan” Massachusetts Institute of Technology (September 1996), https://dspace.mit.edu/bitstream/handle/1721.1/68320/36161308-MIT.pdf?sequence=2.
- Thomas J. Lueck, “Giuliani Plans Inducements to Revive Wall Street Area” New York Times (Dec 16, 1994), https://www.nytimes.com/1991/09/12/nyregion/decline-follows-a-2-decade-boom-in-lower-manhattan.html.
- Kevin Drum, “Crime in New York City” Mother Jones (February 21, 2020), https://www.motherjones.com/kevin-drum/2020/02/crime-in-new-york-city/.
- Claudia H. Deutsch, “Plan Seeks Improvement Package for Financial District” New York Times (October 20, 1993) https://timesmachine.nytimes.com/timesmachine/1993/10/20/901693.html.
- David W. Dunlap, “Bringing Downtown Back Up” New York Times (October 15, 1995), https://www.nytimes.com/1995/10/15/realestate/bringing-downtown-back-up.html>.
- John E. Lodge, “An Analysis of the Lower Manhattan Revitalization Plan” Massachusetts Institute of Technology (September 1996), https://dspace.mit.edu/bitstream/handle/1721.1/68320/36161308-MIT.pdf?sequence=2.
- Thomas J. Lueck, “Giuliani Plans Inducements to Revive Wall Street Area” New York Times (Dec 16, 1994), https://www.nytimes.com/1991/09/12/nyregion/decline-follows-a-2-decade-boom-in-lower-manhattan.html.
- John E. Lodge, “An Analysis of the Lower Manhattan Revitalization Plan” Massachusetts Institute of Technology (September 1996), https://dspace.mit.edu/bitstream/handle/1721.1/68320/36161308-MIT.pdf?sequence=2.
- Eligibility was open to existing buildings located south of Murray Street and east of West Street that possessed a "certificate of occupancy for commercial, manufacturing or other non-residential use... or other proof of such non-residential use as is acceptable to the department of housing preservation and development." Real Property Tax Law, section 421-g.
- The Department of Finance did not report market values for commercial property until 1991, so only assessed values were available for prior years.
- David W. Dunlap, “Bringing Downtown Back Up” New York Times (October 15, 1995), https://www.nytimes.com/1995/10/15/realestate/bringing-downtown-back-up.html.
- Tom Redburn, “The Soul-Searching Downtown” New York Times (May 15, 1994) ,https://timesmachine.nytimes.com/timesmachine/1994/05/15/087971.html?pageNumber=135.
- All data on individual 421-g recipients comes from CBC staff analysis of historical property tax data maintained by the New York City Independent Budget Office. CBC analysis of data from City of New York, Department of Finance, Real Property Tax Recordbook for Fiscal Years 1984 to 2019.
- City of New York Department of Finance, Annual Report on Tax Expenditures Fiscal Year 2022 (2022 and fiscal years 2001 to 2021 editions); and CBC analysis of data from City of New York, Department of Finance, Annual Report on the New York City Real Property Tax 2022 (May 2022).
- A 2008 analysis of the ICIP economic development incentive, upon which 421-g was modelled, found that the ICIP incentive did induce new construction, but that 77 percent of projects would have occurred anyway. See: Francesco Brindisi and David Ehrenberg, “The New York City Real Property Tax Industrial and Commercial Incentive Program (ICIP): Description and Analysis” New York City Economic Development Corporation (September 16, 2008), https://www.taxadmin.org/assets/docs/Meetings/08rev_est/brindisi2.pdf.
- Yardi Matrix, National Office Report: Conversions a Slow, Niche Trend (July 2022), https://www.yardimatrix.com/publications/download/file/2515-MatrixOfficeNationalReport-July2022.
- While the Legislature intended to extend the cap for buildings built prior to 1997, a bill drafting error appears to have resulted in the FAR cap applying instead to buildings permitted after December 6, 1969.
- The four-week rolling average occupancy rate in the Kastle survey was 47.1 percent as of November 16, 2022, while a survey conducted by the Partnership for New York City found daily occupancy at 49 percent in September 2022. See: New York City Economic Development Corporation, New York City Economic Snapshot (November 2022) https://edc.nyc/sites/default/files/2022-12/NYCEDC-NYC-Economic-Snapshot-November-2022-.pdf.
- Jeffrey Havsy, Xiaodi Li, and Kevin Fagan, “Why Office-to-Apartment Conversions are Likely a Fringe Trend at Best” Moody’s Analytics (April 7, 2022), https://cre.moodysanalytics.com/insights/cre-trends/office-to-apartment-conversions.
- Office hard costs average $650 to $850 per square foot, with soft costs adding another 20 percent. See: Turner & Townsend, International Construction Market Survey 2022, https://publications.turnerandtownsend.com/international-construction-market-survey-2022/north-america. Residential new construction costs range from $550 to $725 per square foot for hard and soft costs for projects in the Manhattan core or along the Brooklyn and Queens waterfronts. See: Sean Campion, “Amend it, Don’t End It” Citizens Budget Commission (March 15, 2022), https://cbcny.org/research/amend-it-dont-end-it.
- For example, SL Green recently acquired 450 Park Avenue for $445 million. This was an 18 percent discount to the previous sale in 2014, when the previous owner paid $545 million, but the transaction still valued the building at over $1,300 per square foot, which is well above price per square foot at which residential conversions are feasible. See: Holden Walter-Warner, “SL Green closes on Park Avenue office tower” The Real Deal (June 30, 2022), https://therealdeal.com/2022/06/30/sl-green-closes-on-park-avenue-office-tower/. In another example, Rockrose acquired a stake in 11 East 26th Street that values the building at $275 million, or $1,262 per square foot. See: Kathryn Brenzel, “Rockrose takes over NoMad office building in $145M deal” The Real Deal (January 6, 2022), https://therealdeal.com/2022/01/06/rockrose-takes-over-nomad-office-building-in-145m-deal/.
- Holden Walter-Warner, “Silverstein, Metro Loft pick up Rudin’s 55 Broad Street for $180M” The Real Deal (May 18, 2022), https://therealdeal.com/2022/05/18/silverstein-metro-loft-pick-up-rudins-55-broad-street-for-180m/.
- Natalie Wong, “Developer Silverstein Buys Downtown NYC Apartment Tower for $248 Million” Bloomberg (December 22, 2021), https://www.bloomberg.com/news/articles/2021-12-22/silverstein-buys-downtown-nyc-apartment-tower-for-248-million.
- Martin Z. Braun, “New York Law to Turn Vacant Hotels into Homeless Housing Is Failing” Bloomberg (March 28, 2022), https://www.bloomberg.com/news/articles/2022-03-28/ny-law-to-turn-hotels-into-affordable-housing-is-failing.