A Rank of 39th for State Financial Health – Is New York Really That Bad?
A recent analysis ranks New York’s fiscal health 39th of the 50 states.[1] The Mercatus Center, a well-respected research center at George Mason University, conducted the analysis utilizing states’ financial reports for fiscal year 2015. It is a helpful tool for exploring a state’s financial health in light of continued fiscal constraints. New York’s low ranking may surprise some readers, given the strength of the State’s retirement fund and recent record of instituting common sense financial reforms, such as a new, more modest tier of pension benefits and the global Medicaid cap. This blog reviews the reasons for New York’s ranking and offers lessons to be learned.
How does NY Rank and why?
The table below shows the State’s ranking in each of five fiscal solvency categories nationally, as well as regionally, and as compared to other large states. For a description of the five measures see the notes at the end of the blog.
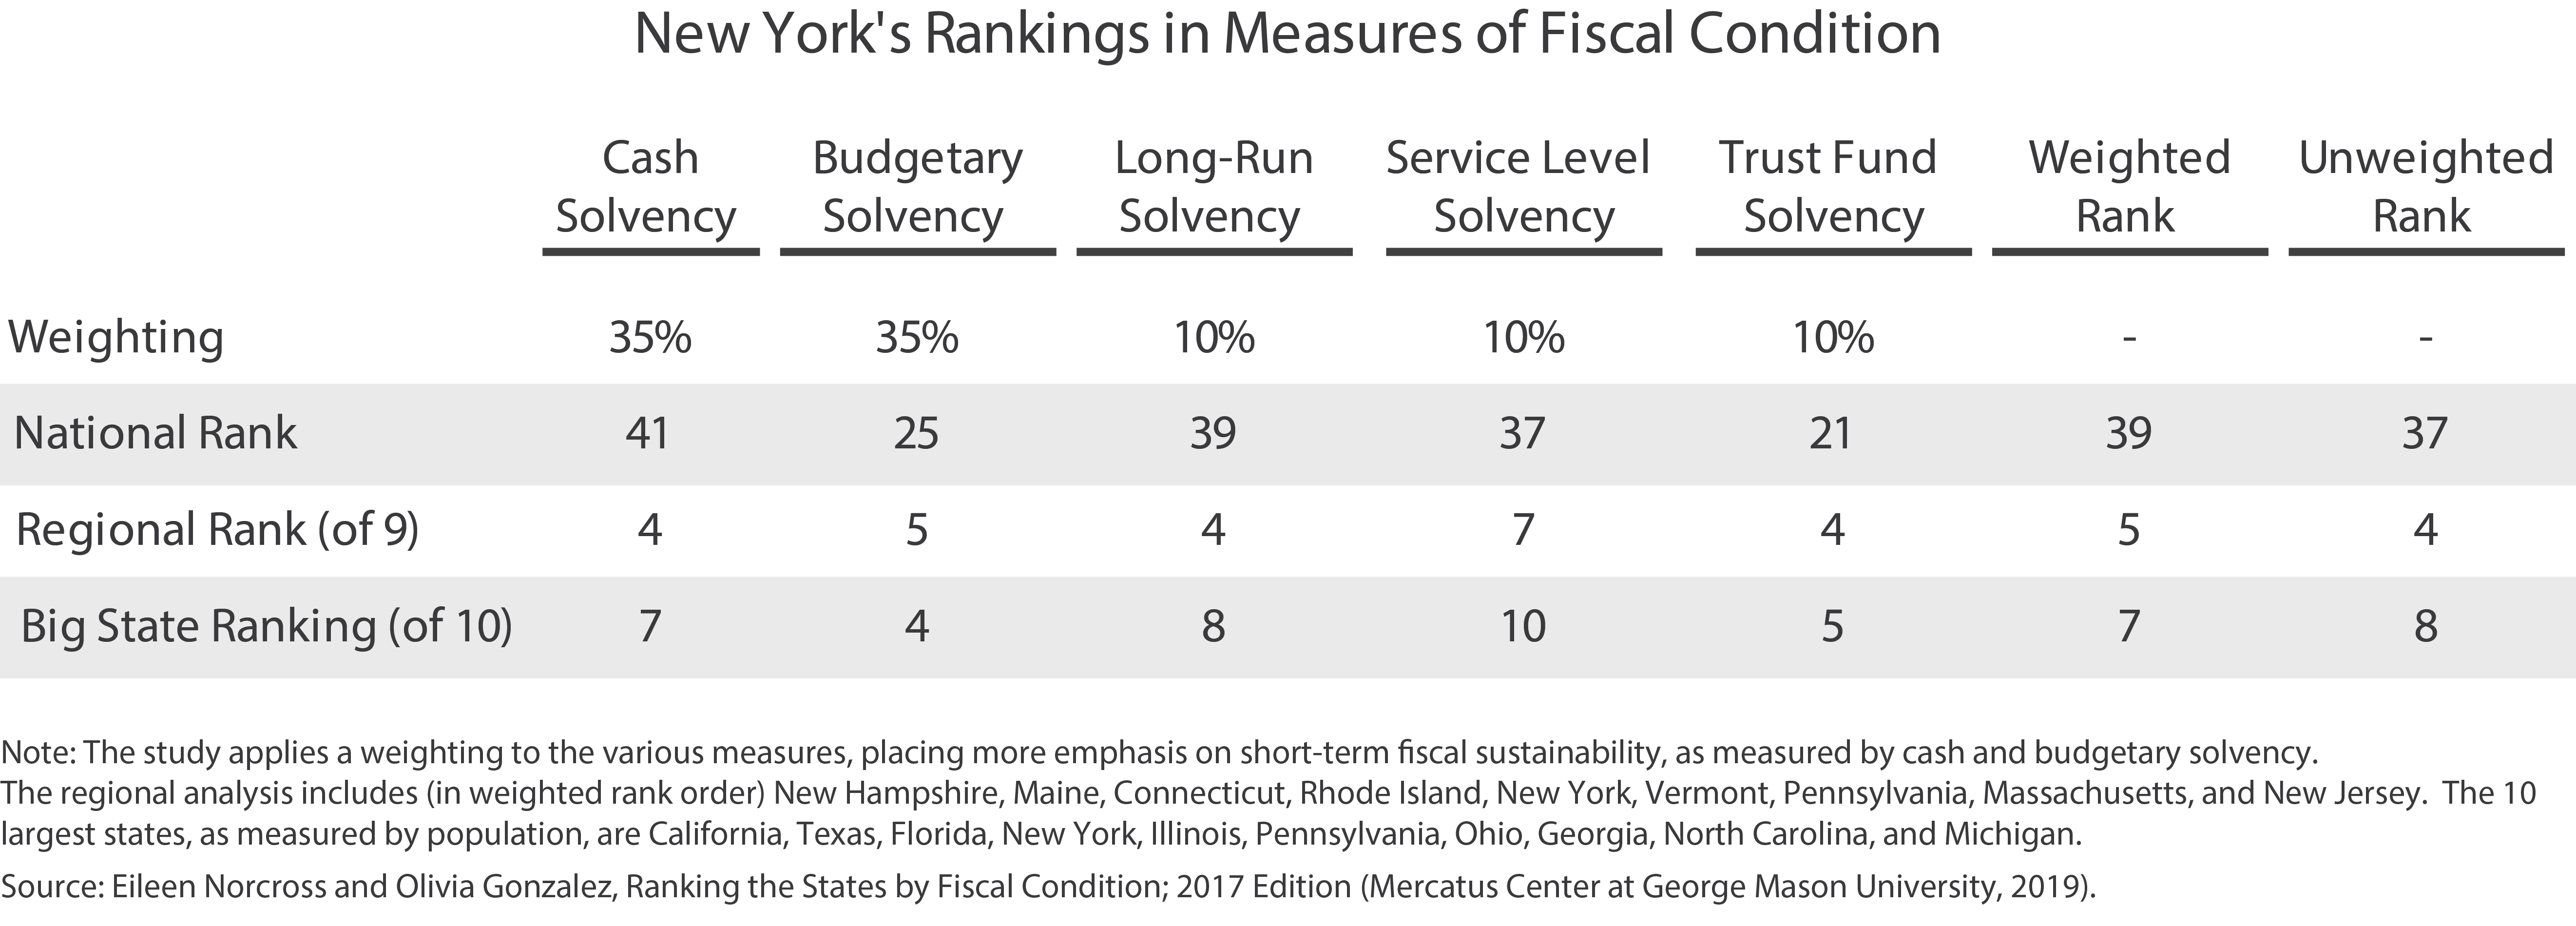
From a national perspective, New York’s rank varies from a high of 21st in trust fund solvency to a low of 41st for cash solvency. New York’s low rank for cash solvency reflects that the State has a comparatively low ratio of cash and unrestricted balances compared to short-term liabilities. However, New York’s measure of cash balance is negatively impacted by the State’s fiscal year ending on March 31, instead of June 30 as in most states.[2]
In fiscal year 2015, the year of the analysis, New York’s All Funds cash balance was $9.4 billion at the end of March 2015, but rose to $14.8 billion at the end of June, when most New York State individual and business income tax returns for the prior year have been filed.[3] Prior years also show a higher cash balance on June 30 compared to March 31.
Also, larger states, including New York, may be better able to manage their daily and monthly cash flow, allowing them to keep less cash on hand as a share of liabilities. For instance, even with the impact of a March 31 fiscal year end date, New York has the sixth most “cash + cash equivalents + investments” with $23.6 billion on hand at the end of fiscal year 2015, but ranks 41st when the amount is measured as a share of liabilities due within a year.
New York ranks 25th for budgetary solvency, buoyed by revenues exceeding expenses in fiscal year 2015. Long-run and service level solvency measures, ranking 39th and 37th respectively, are dragged down by New York’s large long-term debts and high levels of spending as a share of personal income.
New York’s rank of 21st for trust fund solvency might surprise observers who regard New York’s State retirement systems as well funded compared to other public systems.[4] However, the State does not fund other postemployment benefits (OPEB) as workers earn retiree healthcare benefits, instead paying when retirees use those benefits. The Mercatus Center rank of trust fund solvency weighs unfunded pension and OPEB ranks equally. In most states OPEB liabilities are dwarfed by underfunded state pension obligations; the average state ratio of pension liabilities to OPEB liabilities is 10 to 1. Since New York contributes to the pension fund, but not an OPEB fund, New York is relatively disadvantaged on this metric.
New York ranks in the middle of the pack on a regional basis by most measures. It is unsurprising that New York would fare better when compared to states in the Northeast, given the region’s general tendency toward higher spending and taxes. New York fares worse when compared to the 10 largest states in the nation, ranking seventh.
Lessons for New York
If all states were in good financial condition, a low ranking in the Mercatus Center study would not alone be a cause for concern. However, many states, including New York, are experiencing financial pressures; the report does a good job highlighting weaknesses in New York’s fiscal situation, despite certain indicators on which the State is disadvantaged.
Based on a preliminary analysis of New York’s 2016 comprehensive annual financial report (CAFR), it does not appear that the state’s ranking will meaningfully improve, absent significant deterioration in the financial standing of other states. To improve the State’s financial health, New York’s leaders should focus on decreasing long-term debt and reducing the State’s OPEB liabilities.
- Long-Term Debt - Long-term debt liabilities to fund capital projects are too high as a share of income and as measured on a per capita basis. While the infrastructure needs of the state are pressing, New York must do a better job of funding its capital expenses on a pay-as-you-go basis and look to innovative development tools, such as public-private partnerships, to expand capital investment more efficiently without increasing the State’s debt burden.
- OPEB Liability – New York ranks 45th for outstanding OPEB liability per thousand dollars of income. The State created a new postemployment benefit trust fund in the Enacted Budget for Fiscal Year 2018 and should go further to adopt proposals to reform post-retirement health benefits rejected by the Legislature and begin contributing toward the new trust fund.[5]
Overall, the Mercatus report does an admirable job of analyzing financial measures across all 50 states, despite certain measures that underestimate New York’s fiscal condition. Things may not be as bad as 39th out of 50 states, but New York has much room for improvement.
Notes on Mercatus Center Report
The study uses available data to provide a snapshot of each state’s financial health. Most data are pulled from states’ CAFRs, except pension system information, which comes from states’ pension fund reports. OPEB data come from CAFRs and/or actuarial statements of OPEB plans where available.
The study measures five types of fiscal solvency:
- Cash solvency/liquidity, ability to pay immediate bills over a period of 30 to 60 days;
- Budget solvency, annual revenues compared to annual expenses;
- Long-run solvency, measured by long-term assets and liabilities;
- Service level solvency, ability to raise revenues to continue services in the event of an economic downturn; and
- Trust fund solvency, outstanding pension and OPEB liabilities.
While the CAFR contains the most reliable data across the states, certain issues should be noted. The CAFR reflects fiscal year ending financial information. As noted above, different states have different fiscal years, and seasonality of collections, expenses, and balances may harm or advantage certain states.
Another weakness of CAFRs is that they do not include public authority spending and liabilities. Many States, including New York, utilize public authorities to conduct a great deal of business that would otherwise be included within the CAFR.
Footnotes
- Eileen Norcross and Olivia Gonzalez, Ranking the States by Fiscal Condition: 2017 Edition (Mercatus Center at George Mason University, 2017), p. 23, www.mercatus.org/system/files/norcross- fiscalrankings -2017- mercatus -v1.pdf.
- Forty-six states have a fiscal year that ends on June 30, but New York (March 31), Alabama (September 30), Michigan (September 30), and Texas (August 31) have different state fiscal years.
- New York State Division of the Budget, FY 2016 Enacted Budget Financial Plan Report, T-64, www.budget.ny.gov/pubs/archive/fy1516archive/enacted1516/FY16FinPlan.pdf, and Fiscal Year 2015 edition, T-64, www.budget.ny.gov/pubs/archive/fy1415archive/enacted1415/FY2015EnactedBudget.pdf.
- The report uses a lower discount rate for all plans (2.59 percent, equal to the 15-year Treasury note). It has the impact of making New York’s liabilities look much larger because of State’s generous pension benefits.A state with a lower funding share under normal calculations (7 percent), but a less generous benefit could look better than NY on a per capita liability.
- Patrick Orecki, “Budget Proposals with a Big Long-Term Payoff,” Citizens Budget Commission Blog (March 16, 2017), www.cbcny.org/research/budget-proposals-big-long-term-payoff.