Rent and Ride
Affordability is About Both
Discussions of an area’s affordability often focus on housing costs. While housing is the largest share of spending for most households, a more robust picture of affordability also should include transportation costs, since they generally are the second largest share and represent a significant portion of household spending.[1] A location’s affordability is best understood as the portion of a family’s income devoted to housing and transportation. This location affordability measure can be used to compare different cities’ affordability for various households.
The Citizens Budget Commission (CBC) compared data of housing and transportation costs as a percentage of income collected by the Department of Housing and Urban Development (HUD) for different types of households in 20 peer cities with the largest economies in 2016, and found that:[2]
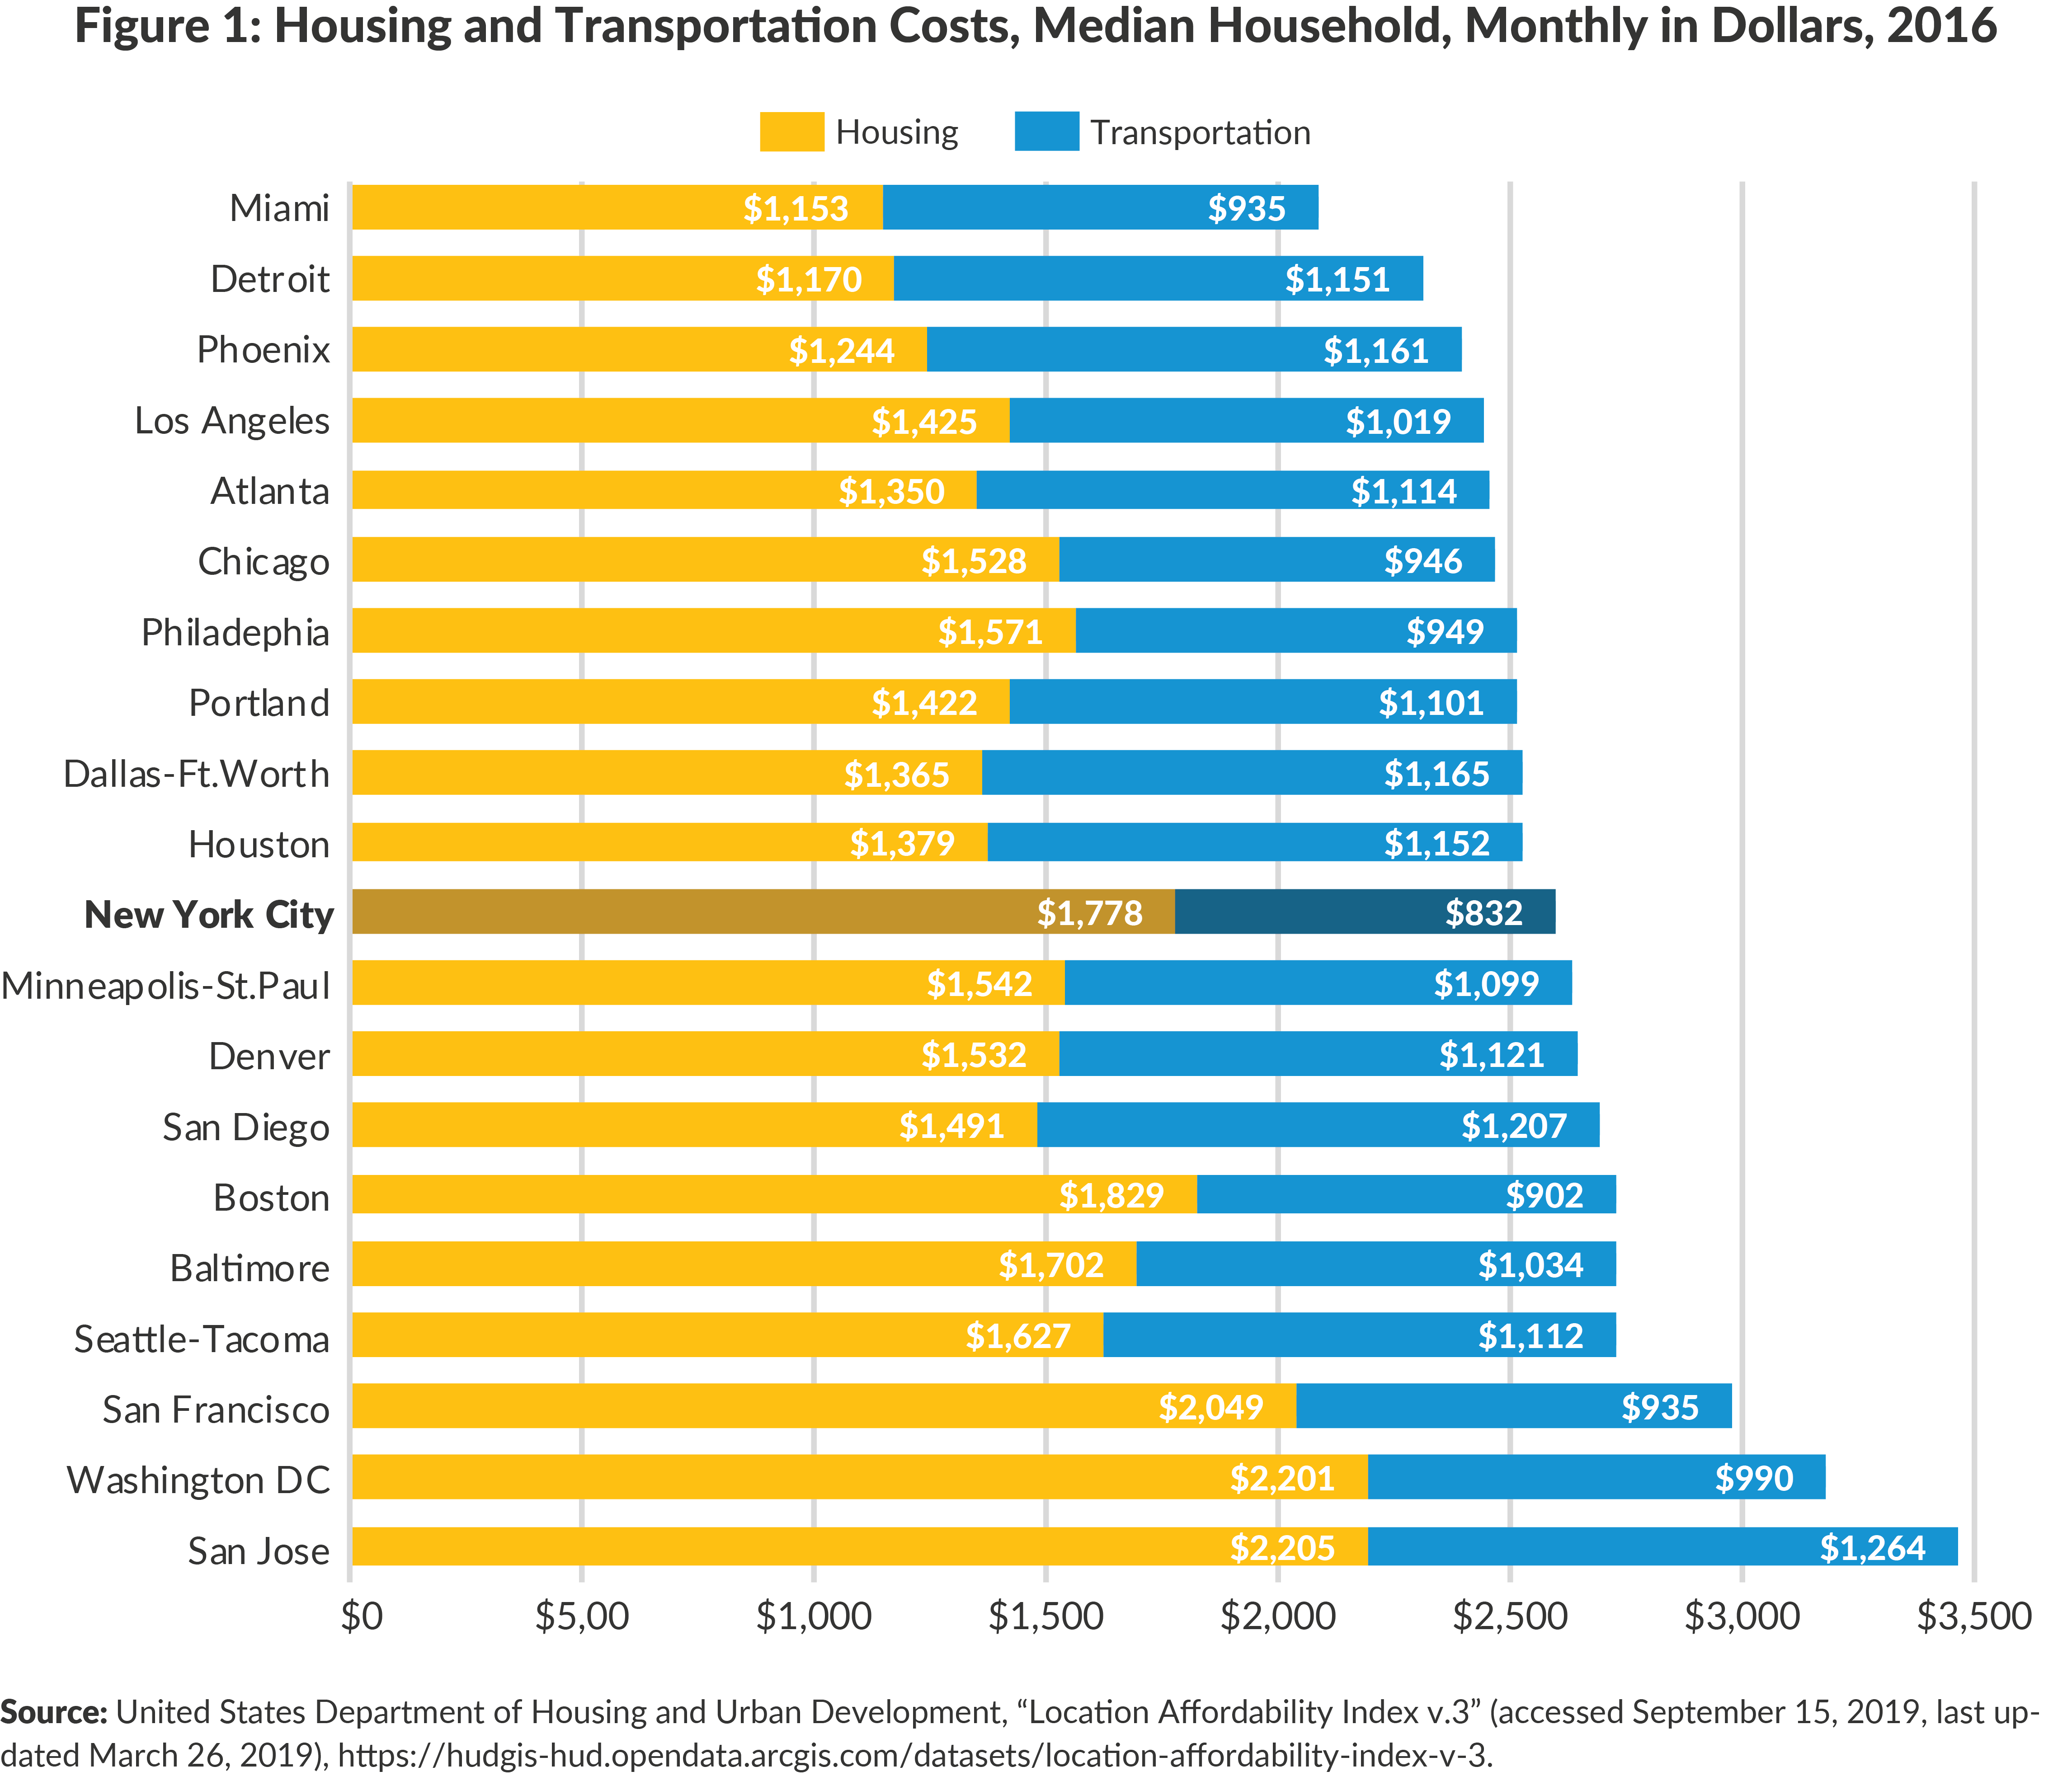
- Housing costs in New York City rank 5th most expensive of 20 competitor cities, with the “median household” spending $1,778 a month, or 30.8 percent of its income, on housing;[3]
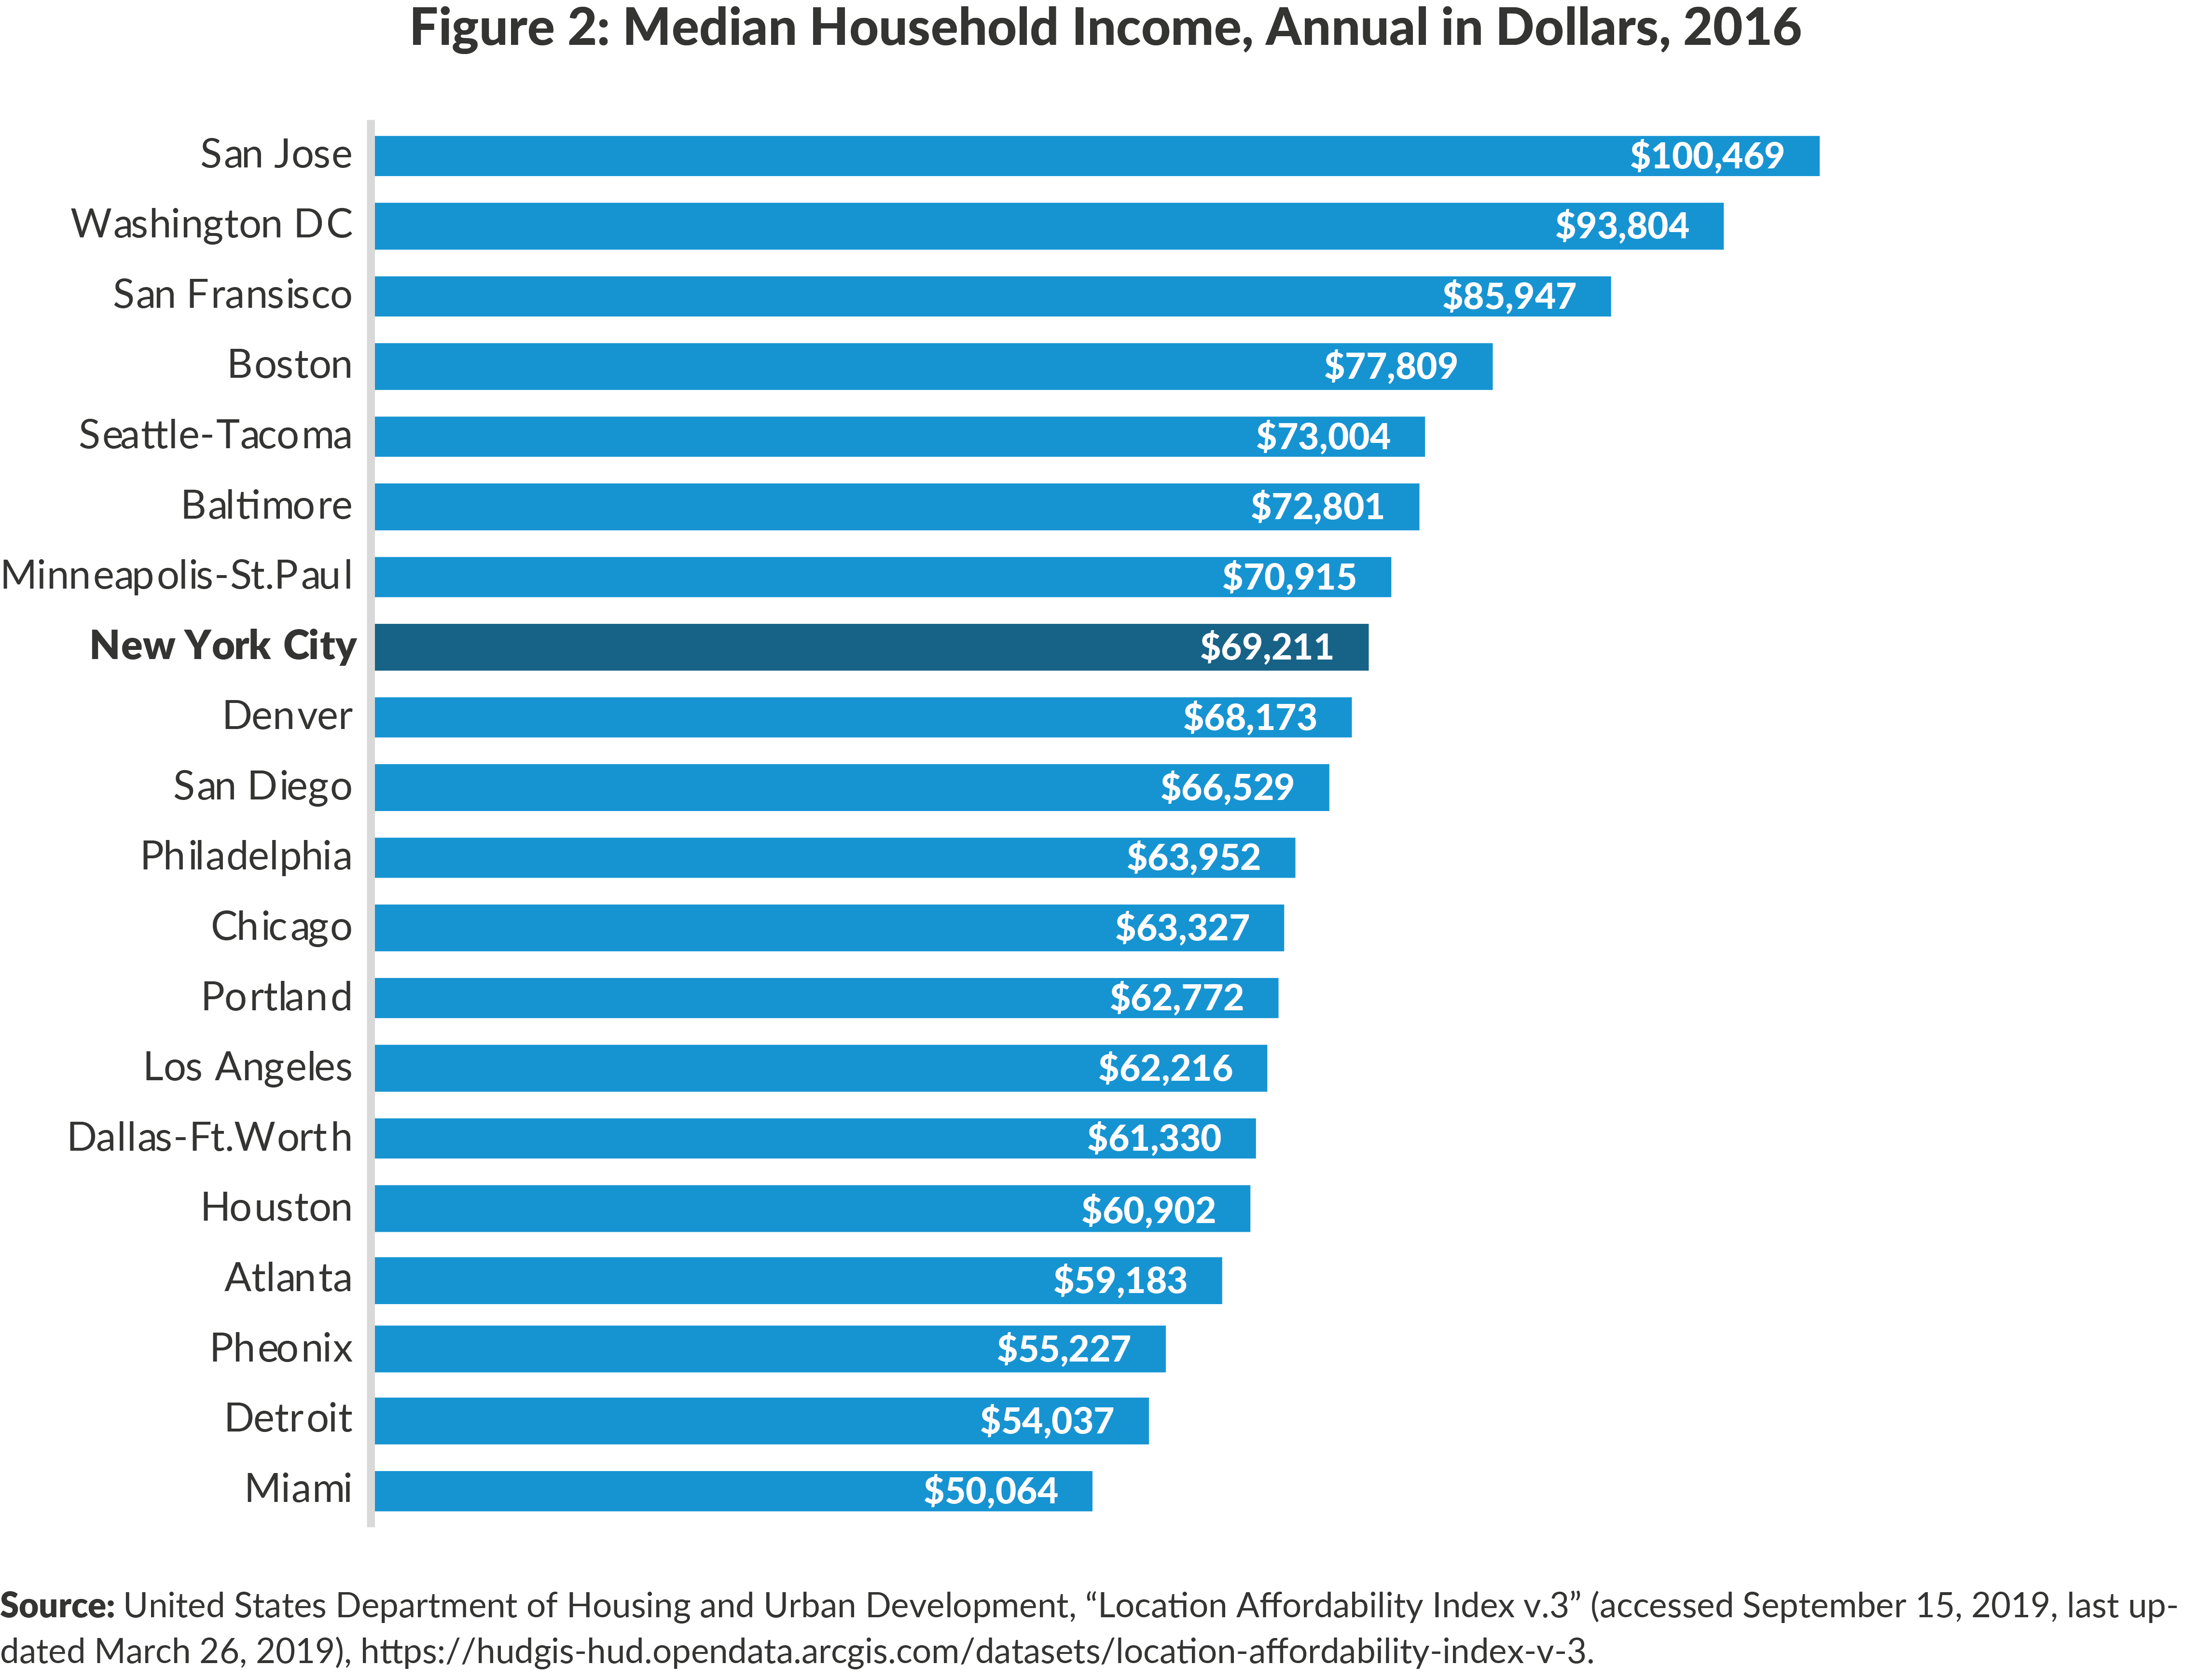
- Median annual household income in New York City is $69,211—the 8th highest household income of the 20 cities;
- Combining housing costs, transportation costs, and income, New York City is the 8th most affordable city of 20, with the “median household” spending 45.3 percent of its income on housing and transportation;
- Fifteen of the cities are considered unaffordable for the “median household,” which spends more than 45 percent of its pre-tax and pre-transfer income on housing and transportation;[4] and
- New York City is relatively more affordable for lower income households among peer cities, but costs for these households are still unaffordable.
New York City currently ranks reasonably well among peer cities, with low transportation costs offsetting high housing costs. However, New York City’s competitiveness may be at risk. High housing demand in relation to slow housing production and the Metropolitan Transit Authority’s (MTA) fiscal and operational woes may increase costs and negatively affect New York City’s location affordability competitiveness.
What is Location Affordability?
A city’s location affordability depends on three factors: the cost of housing, the cost of transportation, and income. Analyzing housing and transportation costs as a share of income facilitates comparisons across cities, which is beneficial both for families and policymakers. For example, it can help a family that is considering moving to a different city with lower housing costs better account for the total cost of living by reflecting both transportation costs and income. Policymakers concerned with housing affordability, for example, can use this more holistic concept to formulate policy responses, as well as to better understand the magnitude of the challenge for different households and how that compares with peer cities.
The Location Affordability Index (LAI) dataset provides metrics on location affordability of neighborhoods, cities, and regions across the United States. For each census tract, HUD calculates location affordability by predicting housing and transportation costs for eight different types of households based on their characteristics, compared to the pre-tax income of those households.5 The LAI dataset does not account for other transfer income that may be available to support low-income households. LAI households are statistical constructs created to represent common types of households in the United States, rather than actual averages for any given city. For example, HUD defines a “median household” as one with two earners and two children making the area’s median family household income. This analysis uses the HUD-defined “median household” as the standard unit of analysis to compare peer cities. While data on common household types in the United States are useful for comparisons across cities, knowing how representative those households are of actual households living in a city is useful, especially when evaluating affordability within a city. CBC analyzed six of the eight household types created by HUD to understand affordability at different income brackets and household compositions. The most recent LAI data used in this report was based on the 2016 census.
This analysis also makes use of the Center for Neighborhood Technology (CNT) location affordability benchmark set at 45 percent of income for combined housing and transportation costs. Households spending more than 30 percent of their incomes on housing and more than 15 percent of their incomes on transportation are considered to be cost-burdened.
Location Affordability for the Median Household
CBC compared the location affordability for the median household in the 20 largest US cities ranked by the size of their economies.
New York City’s median household spends $2,610 monthly on housing and transportation, making it the 10th most expensive city of the 20 examined. Monthly housing costs of $1,778 are the 5th most expensive of the 20 peers, while the $832 spent on transportation is the least expensive.6 (See Figure 1.)
Affordability is determined based on these costs relative to income; New York City’s median household income of $69,211 ranks 8th highest among peer cities.7 (See Figure 2.) Comparing combined housing and transportation costs to income, New York City’s median household spends 45.3 percent of its income on housing and transportation, ranking 8th most affordable of 20. (See Figure 3.) New York’s relatively high housing costs are offset by its lower transportation costs. New York City’s location affordability for the median household is more competitive than it would be if only housing costs were considered.
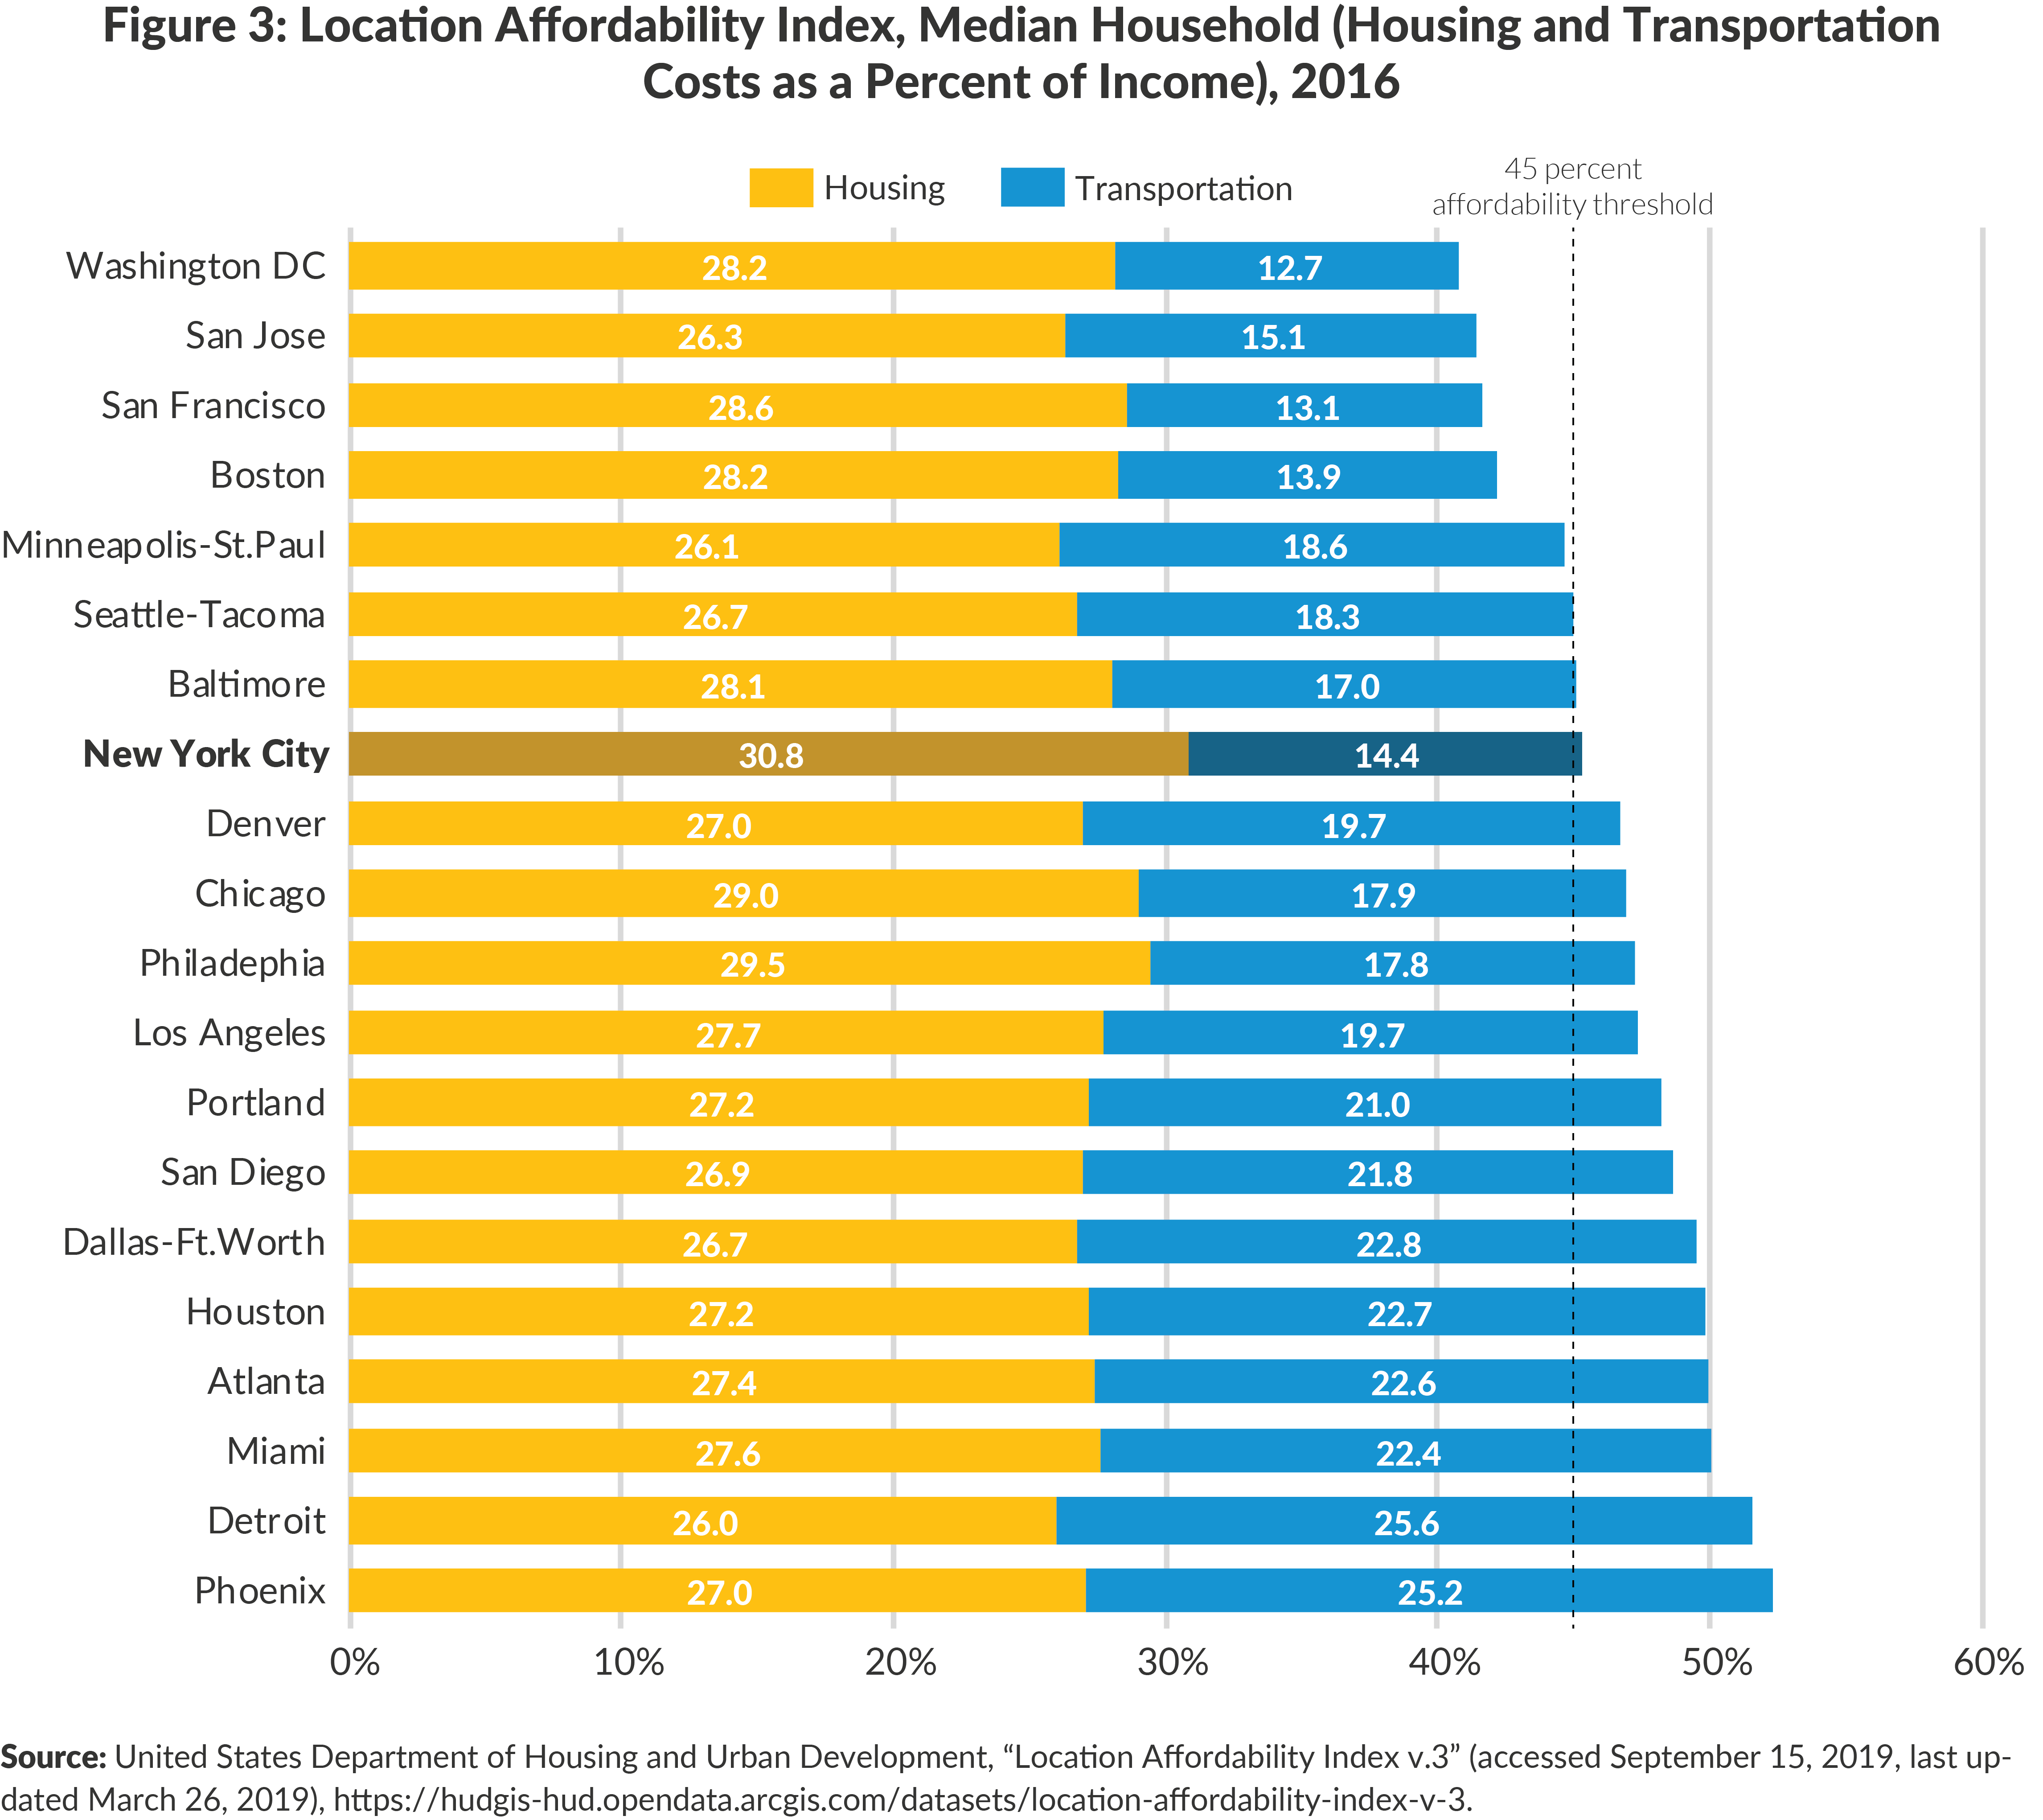
Nevertheless, New York City is considered unaffordable for the median household, based on the CNT standard. Due to high median household incomes, only five peer cities are below the 45 percent affordability threshold: Washington DC, San Jose, San Francisco, Boston, and Minneapolis-St. Paul. While these cities have some of the highest combined housing and transportation costs, even higher median incomes place them below the affordability threshold.
The 20 cities vary on whether component housing and transportation costs are affordable. For transportation, only four cities are affordable—falling below the 15 percent affordability threshold: New York City, Washington DC, San Francisco, and Boston. These four cities are also the top four for highest public transportation usage.8
For housing, every city except New York City is below the 30 percent threshold, with New York City just above. While New York City does not have the highest housing costs, its median household income is not as high as similarly expensive peer cities; as a result, housing costs exceed the 30 percent affordability threshold for the median household.
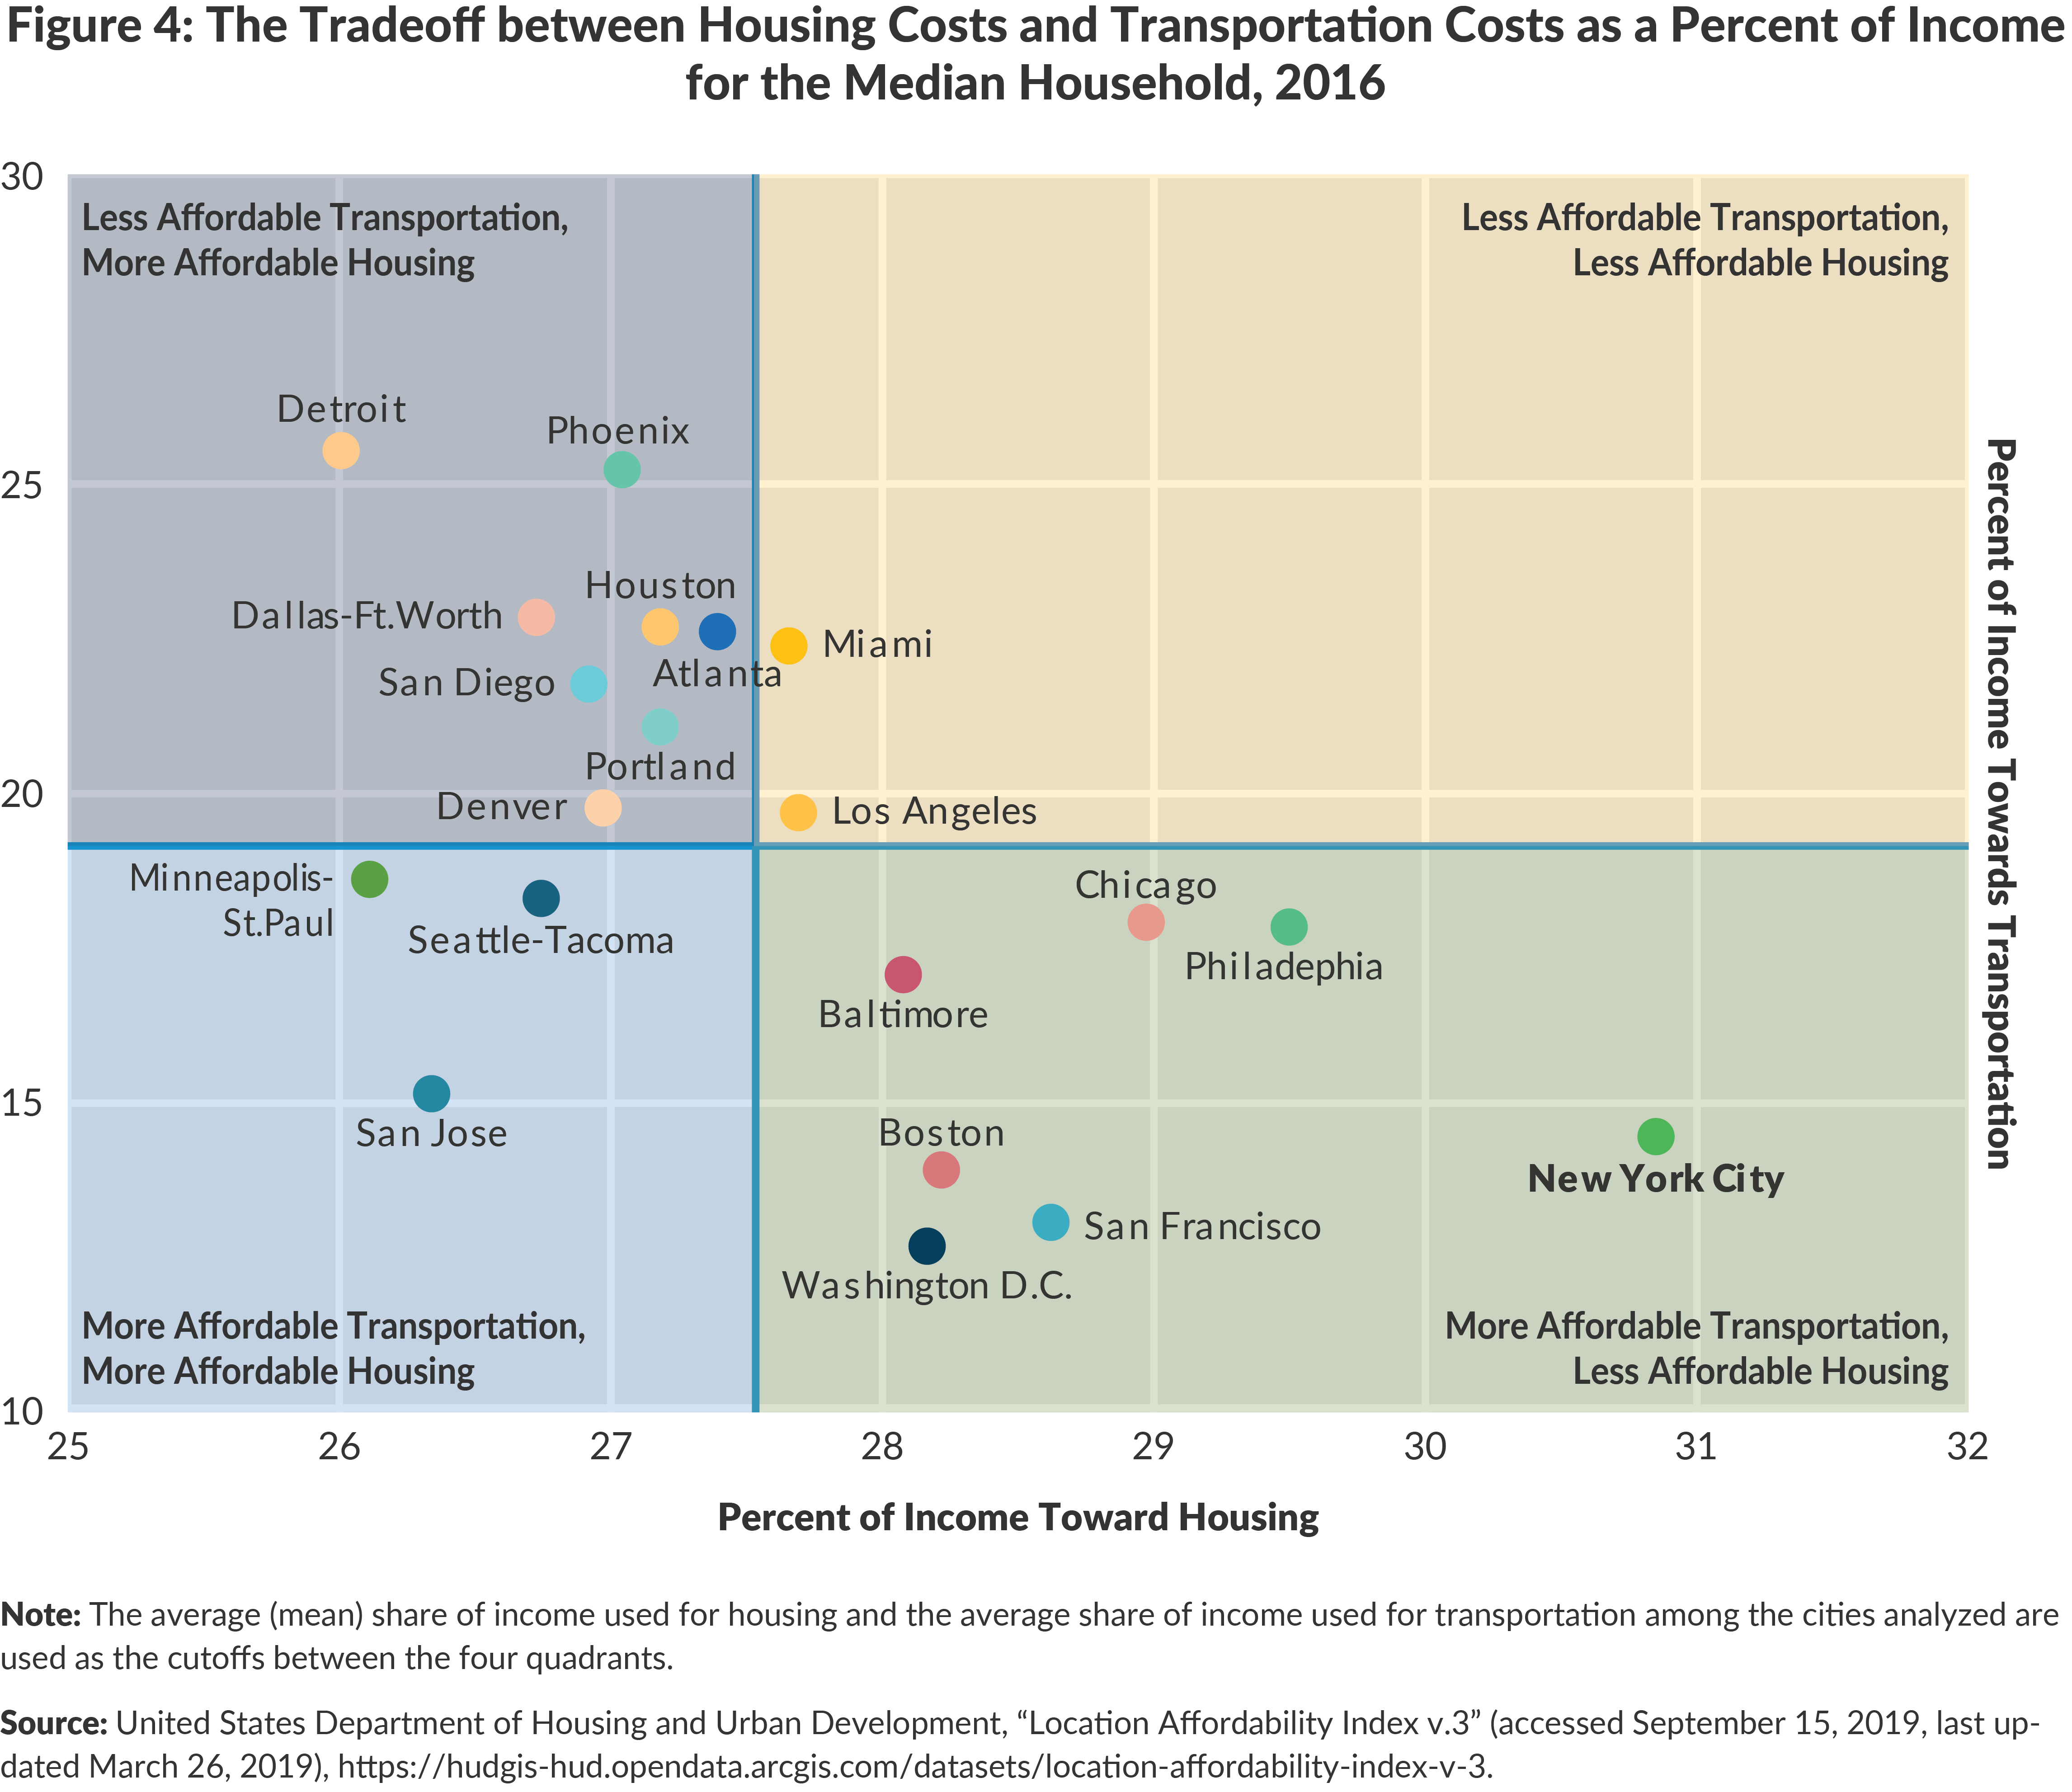
New York City is not alone in the relation of housing and transportation costs. Figure 4 reveals that cities with higher housing costs tend to have relatively lower transportation costs, and vice versa. This tradeoff underpins New York City’s overall affordability competitiveness, with lower transportation costs offsetting higher housing costs relative to other cities.
How Representative are these Households of New York City?
The household types created by HUD are illustrative of common types of households in the United States, not necessarily New York City. For example, only 8.6 percent of New York City households fit HUD’s “median household” defined as two working adults and two children, regardless of income.[9]
In 2016 there were 3,128,246 households in New York City representing 8.3 million New Yorkers. The following are a few non-mutually exclusive categories of households:
- 8.6 percent (268,722) had four people with two employed;
- 7.7 percent (239,482) had four people with one employed;
- 17.6 percent (550,090) were households with one employed person;
- 19.2 percent (600,180) live below the poverty line, regardless of household size;
- 8.4 percent (262,483) were single mothers with their own children;
- 9.0 percent (282,296) are single and below the poverty line; and
- 12.1 percent (377,574) are households living on retirement income.[10]
Location Affordability for Different Households
Affordability in New York City
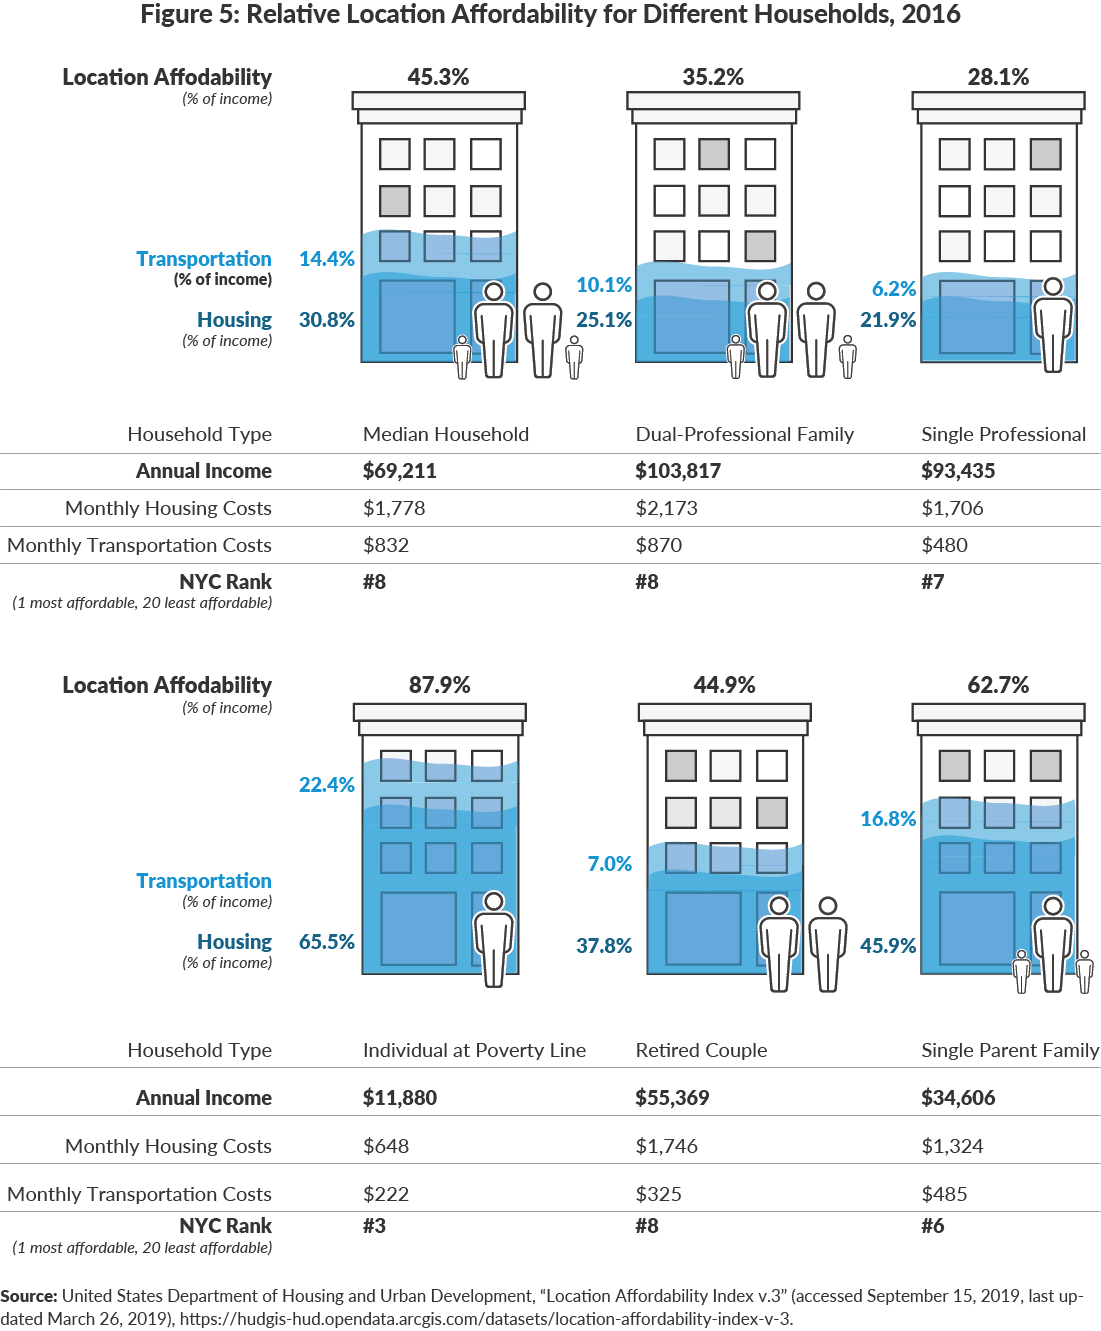
While understanding the relative affordability for a median household is helpful, a more representative picture of location affordability is provided by examining five other types of households: a dual professional family, a single professional, an individual living at the poverty line, a retired couple, and a single parent family.11
Individuals at the poverty line are defined as having an income at the federal poverty line of $11,800. A single parent household has one income-earning adult, making 80 percent of area median income, and two children. A professional family has two income-earning adults and two children, and earns 150 percent of area median income. A retired couple is defined as a having two non-income-earning adults and no children, and earns 80 percent of the area median income. A single professional is one income-earning adult earning 135 percent of the area median income.
In New York City, affordability varies widely across different incomes and household compositions. (See Figure 5.) On one end, a single professional earning $93,435 annually spends a relatively low 28.1 percent of her income on housing and transportation. On the other end, an individual living at the federal poverty line spends 87.9 percent of his pre-tax and pre-transfer income on housing and transportation. New York City is only affordable to the two highest earning household types.
Relative Location Affordability for Different Households
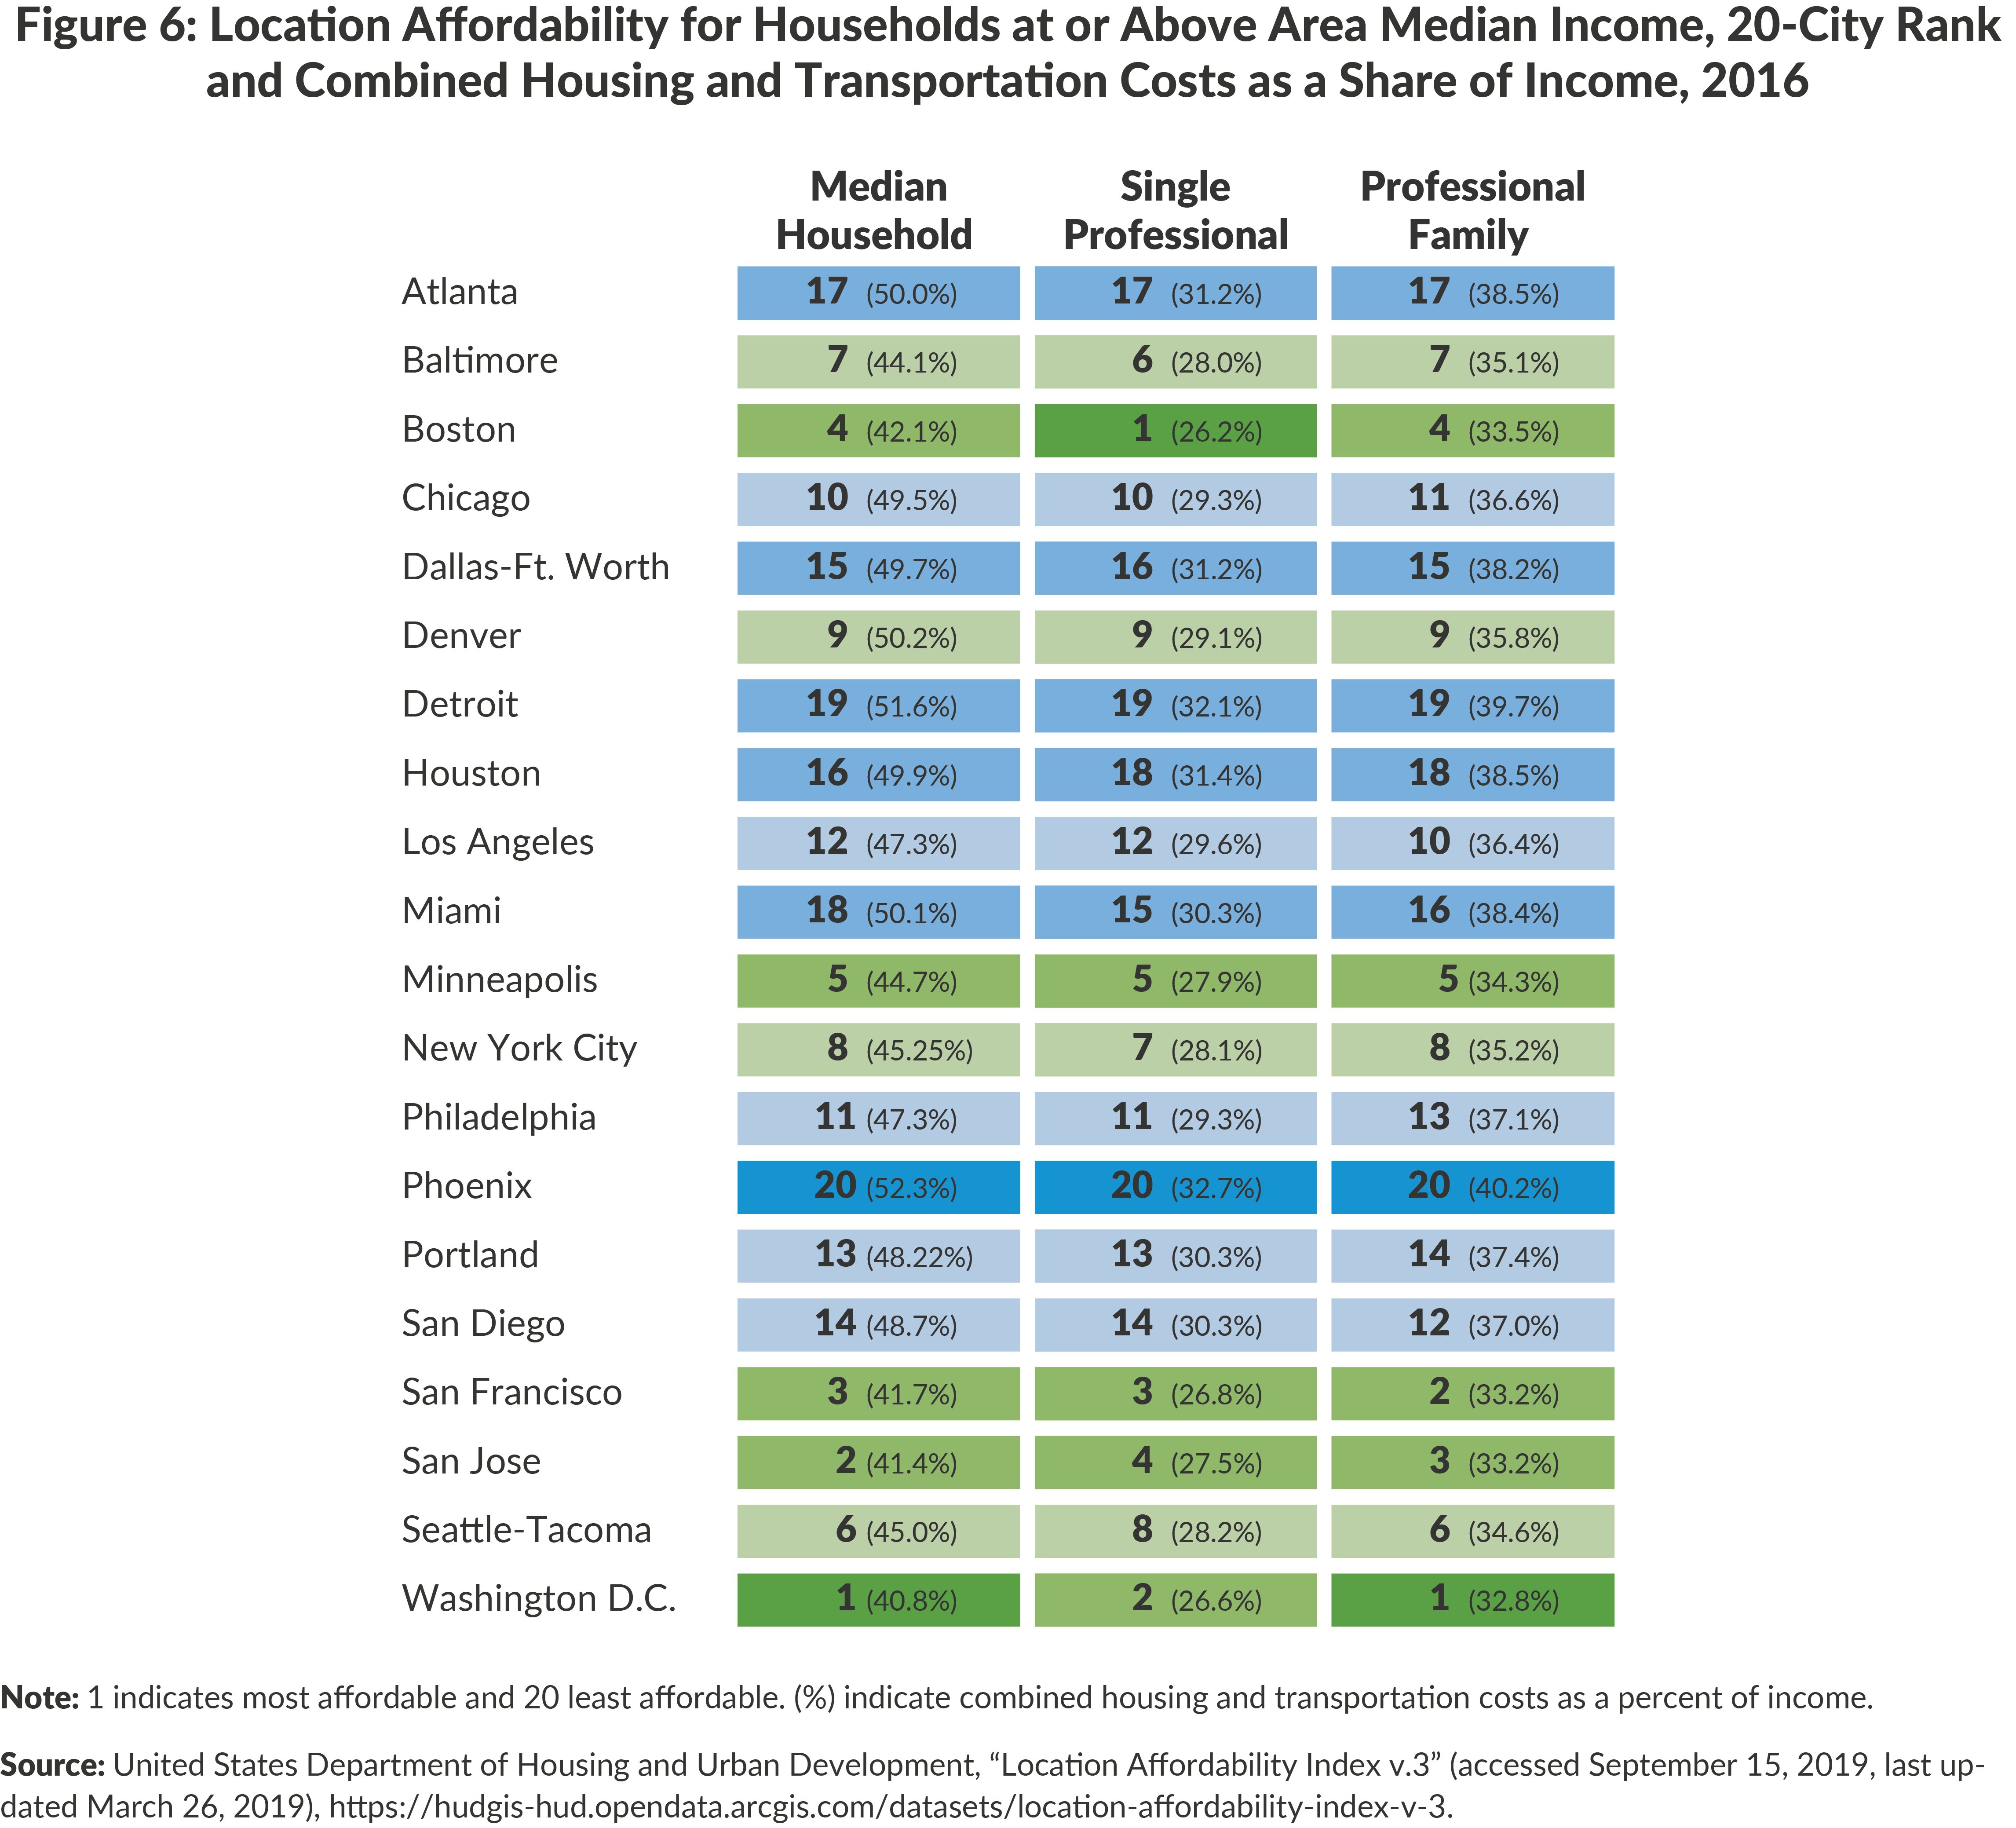
While HUD’s household types are not perfectly representative of any given city, they are useful to compare across cities, and offer additional information not fully captured by the “median household” alone. Figure 6 demonstrates location affordability for households living at or above a city’s median household income. New York City ranks 7th and 8th most affordable for single professionals and professional families, respectively. For these two household types, higher incomes allow for affordable location costs in every city examined.
New York City ranks as relatively more affordable for lower income households. (See Figure 7.) For an individual living at the poverty line of $11,880, New York City ranks third most affordable of twenty. For a single parent family, New York City ranks sixth most affordable. New York City’s relatively more affordable rankings for these household types may be due to better public transportation access for lower-income families.12 Automobile ownership is expensive, and in general, cities with more robust public transportation systems generally rank better for lower-income households.13
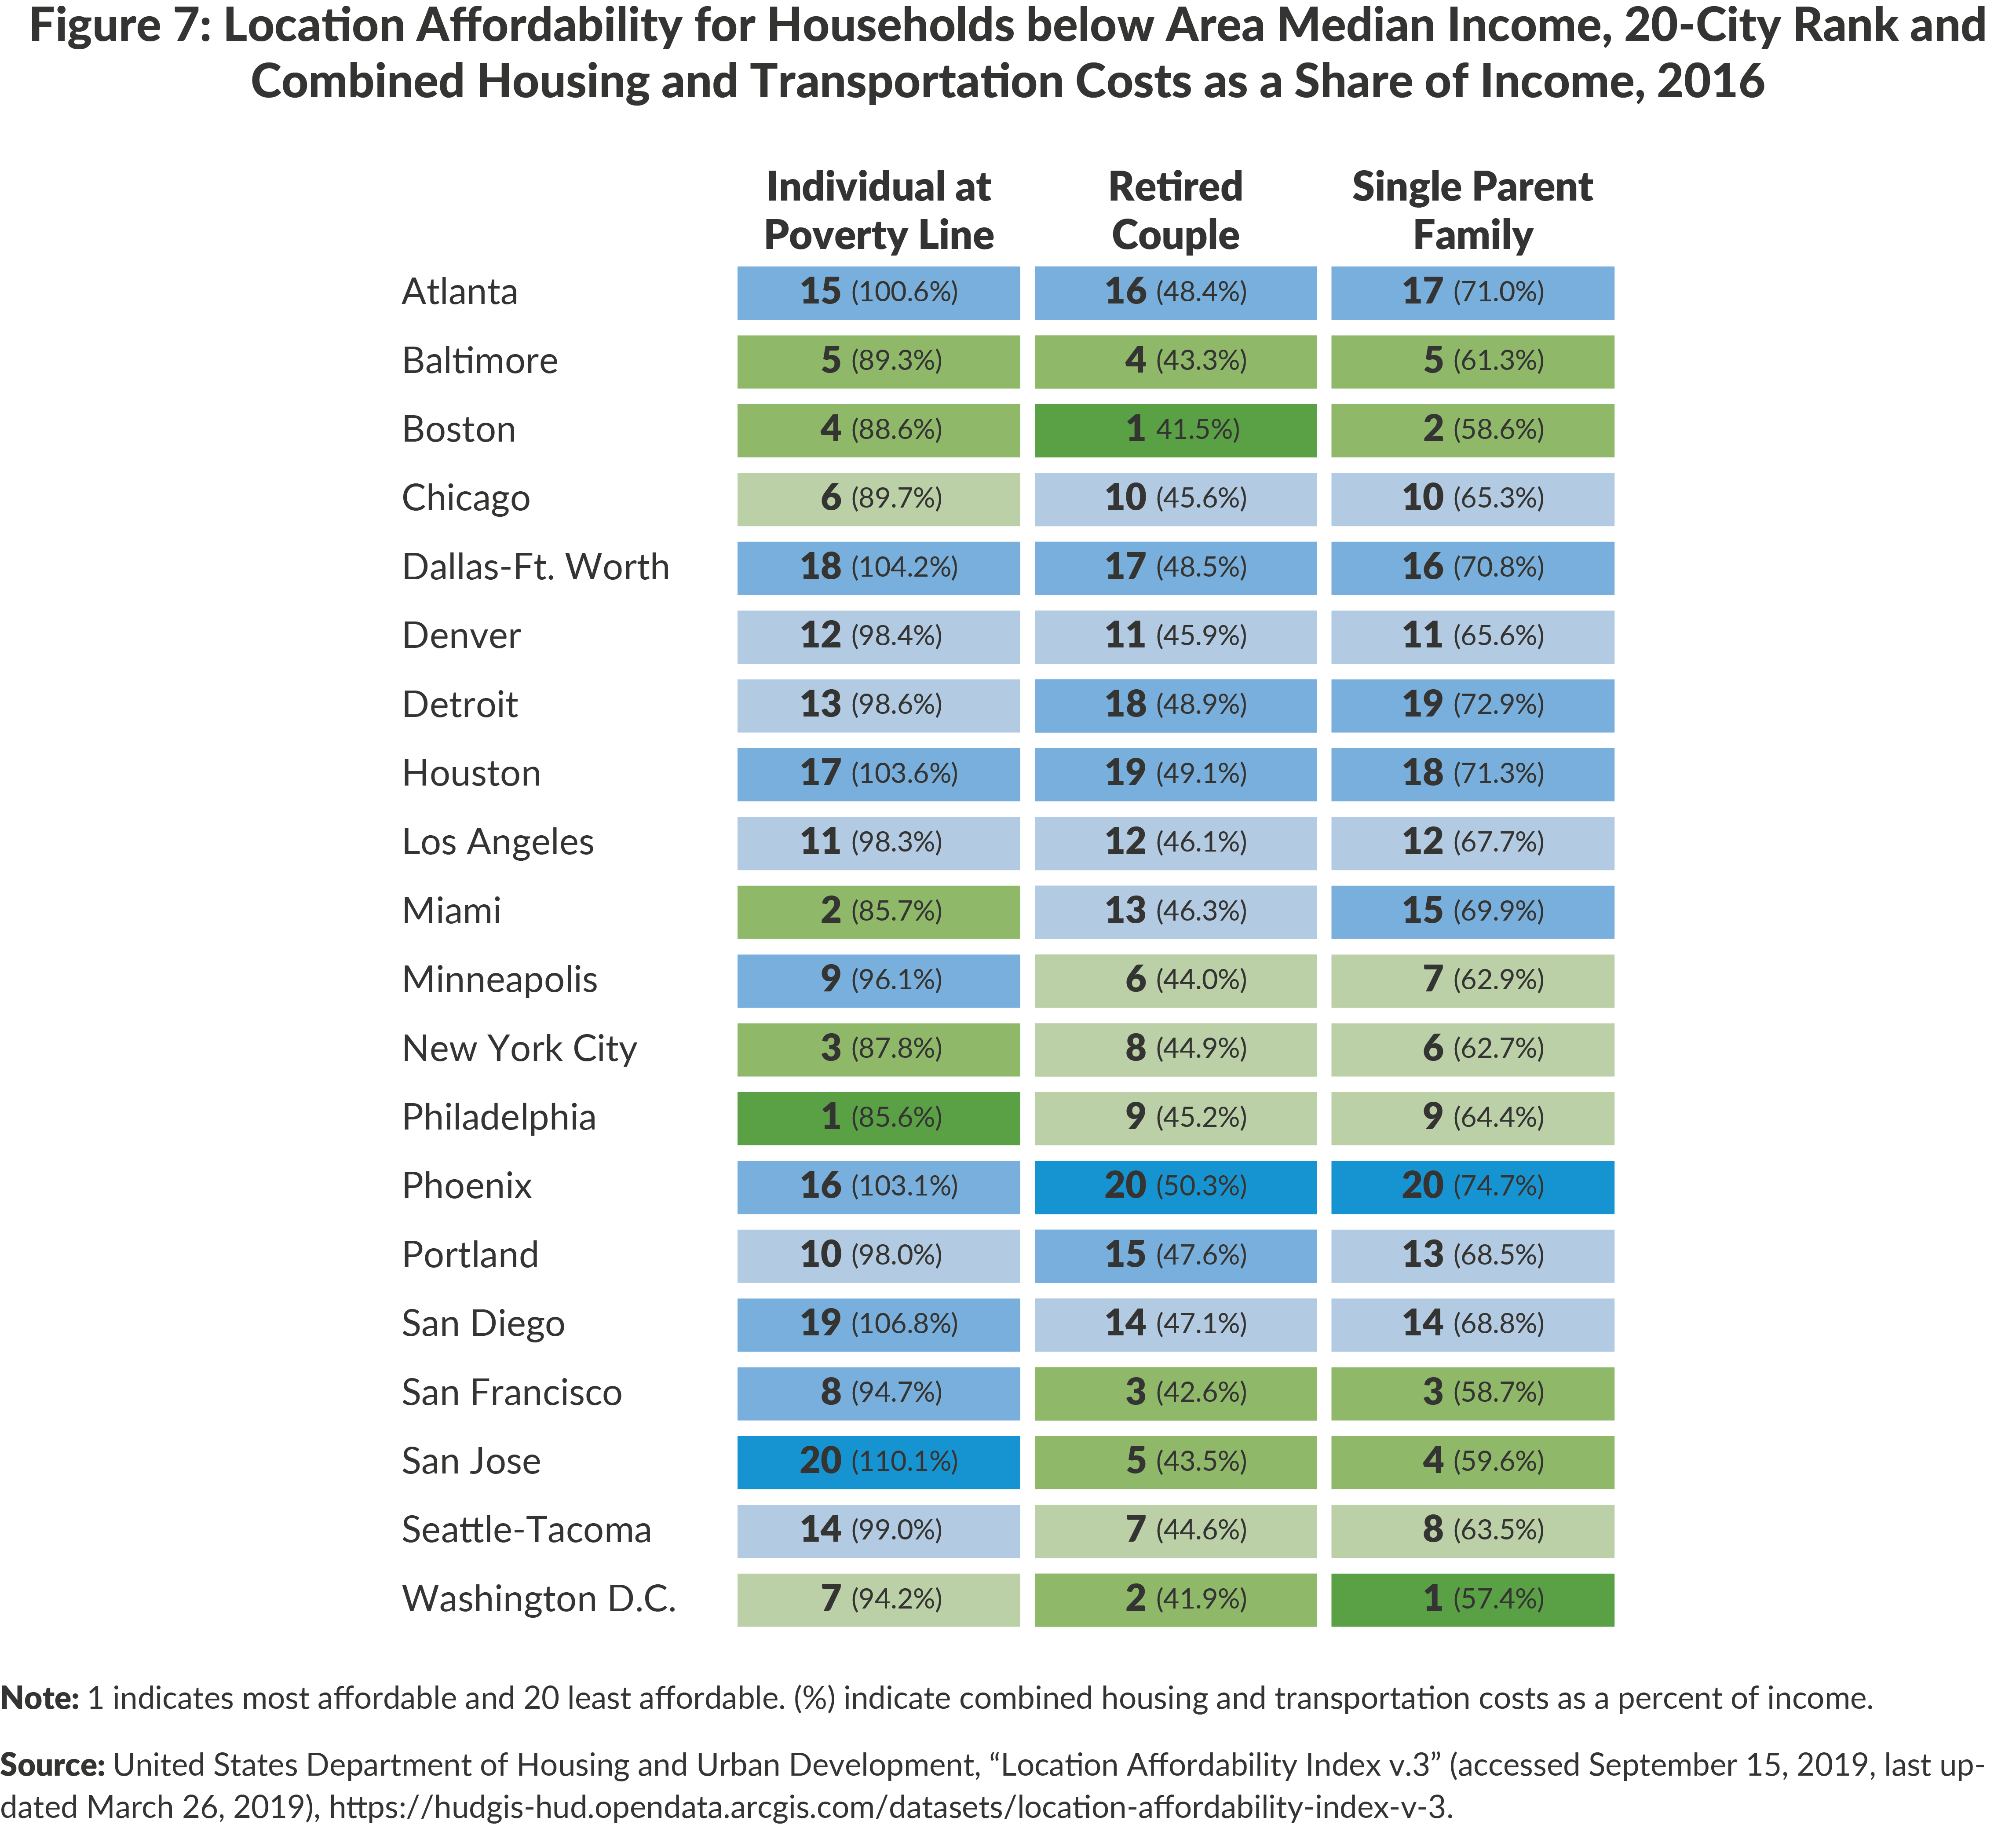
However, transportation and housing costs for representative lower-income households are unaffordable across the board. For an individual living at the poverty line or a single parent family, no city has costs are below the 45 percent affordability threshold. For an individual living at the poverty level, 6 of the 20 cities have housing and transportation costs that exceed 100 percent of pre-tax and pre-transfer income, indicating that these households likely rely on substantial public support services to support their expenses (something not accounted for in the LAI dataset). For a retired couple, eight cities fall below the affordability threshold, New York City included. Despite lower incomes, lower commuting-related transportation spending maintains the retired couple household’s affordability.
Conclusion
New York City’s competitive future in part rests on its affordability. A location’s affordability is determined by more than just the cost of housing. Including both transportation and housing costs relative to income, New York City ranks reasonably well in location affordability relative to its peer cities. For many New Yorkers, the City’s high housing costs are offset by its lower transportation costs and higher household incomes. Still, for low-income New Yorkers, high housing costs, even when combined with relatively affordable transportation costs, often break the bank.
Together, pressures in transportation and housing affordability highlights a two-pronged risk to New York City’s competitiveness. One risk is potential for increased transportation costs. Solving the MTA’s fiscal and operational deficits is a significant challenge. If the MTA can bring its system closer to a state of good repair and improve service without significantly increasing the cost of transportation to households, it will help New York City maintain its competitive advantage. This is especially important for affordability among lower income households, who rely on well-functioning and affordable public transportation – a fact which further emphasizes how programs like Fair Fares, if successfully implemented, can buoy transportation affordability.14
Another risk for some households is housing affordability. Housing costs have continued to increase, with inflation-adjusted rents in New York City growing by 6.2 percent between 2014 and 2017.15 In order to maintain competitiveness, New York City should consider strategies and policies to address housing supply and alleviate housing cost pressures.
Footnotes
- See: United States Bureau of Labor Statistics, “Consumer Expenditures in 2017” (April 2019), www.bls.gov/opub/reports/consumer-expenditures/2017/pdf/home.pdf.
- Cities were chosen based on the size of their Metropolitan Statistical Area (MSA) real gross domestic product (GDP), using 2017 data and 2017 dollars reported by the U.S. Bureau of Economic Analysis. A city is defined by its official political boundaries as indicated by the U.S. Census Bureau’s “place” designation. This is a change from CBC’s 2014 location affordability analysis, which defined competitor cities based on population of both the political boundaries of a city and the combined metropolitan statistical area (CMSA). This change leads to the exclusion of: Indianapolis, Indiana; Riverside, California; Columbus, Ohio; San Antonio, Texas; Austin, Texas; and Jacksonville, Florida. The unit of this analysis is the central city in the 20 selected MSAs. See: Bureau of Economic Analysis, “Gross Domestic Product by Metropolitan Area 2017,” (September 18, 2018), www.bea.gov/news/2018/gross-domestic-product-metropolitan-area-2017.
- A “median household” refers to the Department of Housing and Urban Development’s definition, which is a household with two commuters and two children earning the area median household income for the MSA.
- See: Center for Neighborhood Technology, “Housing and Transportation Index” (accessed September 15, 2019), www.cnt.org/tools/housing-and-transportation-affordability-index.
- Location affordability of a census tract is calculated using the area median income of the MSA or CMSA. For each city figures presented represent the average of the tract averages within the city. HUD estimates housing and transportation costs using a variety of statistical modeling techniques, predicted based on variables that include rent, automobile ownership, household size, the number of commuters per household, employment access, median income, and other variables. These independent variables represent actual data from primarily the 2012-2016 American Community Survey (ACS) Five-Year Estimates, and are supplemented with a few other datasets. It should be noted that this dataset has some limitations. While median rent or housing costs factor in costs such as property taxes or homeowner association fees, median area income figures are calculated using pre-tax and pre-transfer income (such as the Earned Income Tax Credit or public assistance) and may not accurately represent real net income. For example, the LAI may overstate net out of pocket costs for low-income households. For a full description of HUD’s methodology, see: United States Department of Housing and Urban Development, “Location Affordability Index Version 3 Data and Methodology” (March 2019), https://files.hudexchange.info/resources/documents/Location-Affordability-Index-Version-3-Data-and-Methodology.pdf.
- Transportation costs for the median household in New York City include average automobile ownership and usage, and may not reflect costs for a household which only uses public transportation.HUD defines median household income for the MSA, not the city. Housing and transportation costs are estimated at the city level. In most cities, median household income in the city is slightly lower than in the MSA. New York City’s MSA includes the following counties: Kings, NY; Queens, NY; New York, NY; Bronx, NY; Richmond, NY; Westchester, NY; Bergen, NJ; Hudson, NJ; Middlesex, NJ; Monmouth, NJ; Ocean, NJ; Passaic, NJ; Rockland, NY; Orange, NY; Suffolk, NY; Nassau, NY; Putnam, NY; Dutchess, NY; Essex, NJ; Union, NJ; Morris, NJ; Somerset, NJ; Sussex, NJ; Hunterdon, NJ; and Pike, PA.
- HUD defines median household income for the MSA, not the city. Housing and transportation costs are estimated at the city level. In most cities, median household income in the city is slightly lower than in the MSA. New York City’s MSA includes the following counties: Kings, NY; Queens, NY; New York, NY; Bronx, NY; Richmond, NY; Westchester, NY; Bergen, NJ; Hudson, NJ; Middlesex, NJ; Monmouth, NJ; Ocean, NJ; Passaic, NJ; Rockland, NY; Orange, NY; Suffolk, NY; Nassau, NY; Putnam, NY; Dutchess, NY; Essex, NJ; Union, NJ; Morris, NJ; Somerset, NJ; Sussex, NJ; Hunterdon, NJ; and Pike, PA.
- Per data included in the LAI dataset, 57 percent of New Yorkers commute to work using public transportation, 40 percent in Washington DC, 36 percent in San Francisco, and 35 percent in Boston. The average percent of commuters who use public transportation across all 20 cities is 18 percent.
- Based on the number of households classified as “4-or-more-person household, 3 workers” per the 2012-2016 American Community Survey Five-Year Estimates. See: U.S Census Bureau, “American Community Survey, Table B08202, Household Size by Number of Workers in Household, 2012-2016 American Community Survey 5-Year Estimates” (accessed November 1, 2019, last updated January 18, 2018), https://factfinder.census.gov/faces/tableservices/jsf/pages/productview.xhtml?pid=ACS_16_5YR_B08202&prodType=table.
- Based on selected tables from the 2012-2016 American Community Survey 5-year estimates, with total households in New York City are used as the denominator for all percentages. See: U.S Census Bureau, “American Community Survey, Table B17017, Poverty Status in the Past 12 Months by Household Type by Age of Householder, 2012-2016 American Community Survey 5-Year Estimates” (accessed November 1, 2019, last updated January 18, 2018), https://factfinder.census.gov/faces/tableservices/jsf/pages/productview.xhtml?pid=ACS_16_5YR_B17017&prodType=table, and U.S Census Bureau, “American Community Survey, Table S1101, Households and Families, 2012-2016 American Community Survey 5-Year Estimates” (accessed November 1, 2019, last updated January 18, 2018), https://factfinder.census.gov/faces/tableservices/jsf/pages/productview.xhtml?pid=ACS_16_5YR_B11005&prodType=table, and U.S Census Bureau, “American Community Survey, Table B19059, Retirement Income in the Past 12 Months for Households, 2012-2016 American Community Survey 5-Year Estimates” (accessed November 1, 2019, last updated January 18, 2018), https://factfinder.census.gov/faces/tableservices/jsf/pages/productview.xhtml?pid=ACS_16_5YR_B19059&prodType=table.
- Other household types omitted from this analysis include a working individual and moderate-income family; these two household types were omitted as their affordability rankings and costs closely resembled those of the median household.
- See: Ewing, R., Hamidi, S., Grace, J.B., and Wei, D.Y., “Does urban sprawl hold down upward mobility?” Landscape and Urban Planning, vol. 148, no. 1 (April 2016), pp. 80-88, www.sciencedirect.com/science/article/pii/S016920461500242X.
- For individuals living at the poverty line in cities with high public transit usage (defined as those with more than 15 percent of commuters using public transportation to get to work, including: New York City, Washington D.C., San Francisco, Boston, Chicago, Philadelphia, Baltimore, and Seattle) the average percent of income spent on housing is 42.4 percent and the average percent of income spent on transportation is 19.1 percent, a combined average of 61.5 percent. In cities with low public transit usage (less than 15 percent of commuters), the average percent of income spent of housing is 39.7 percent and the average percent of income spent on transportation is 28.9 percent, a combined average of 68.7 percent. Cities with high public transit usage have housing costs as a percent of income that are on average 2.6 percentage points higher, but have transportation costs as a percent of income that are on average 9.7 percentage points lower. As a result, cities with higher transit use tend to rank better with respect to their peers among individuals living at the poverty line, and similarly rank better for other lower-income households.
- “Fair Fares” is a New York City program established in 2018 to provide subsidized half-fare MetroCards to qualifying individuals living below the poverty line or receiving public assistance. Early estimates of the eligible population were 800,000; however, the City initially made the program available to just 30,000 people receiving certain forms of public assistance as of January 2019. In Fall 2019 City University of New York and veteran students, as well as New York City Housing Authority residents, who meet an income requirement were eligible to enroll. See: Community Service Society, “Fair Fares – A New Commitment from Mayor de Blasio” (press release, March 5, 2019), https://www.cssny.org/news/entry/fair-fares-a-new-commitment-from-mayor-de-blasio and New York City Office of the Mayor, “Important Information Regarding Eligibility for Fair Fares NYC,” (accessed December 17, 2019), https://www1.nyc.gov/office-of-the-mayor/fair-fares-nyc-eligibility.page.
- New York City Department of Housing Preservation and Development, “Selected Initial Findings of the 2017 New York City Housing and Vacancy Survey” (February 9, 2018), www1.nyc.gov/assets/hpd/downloads/pdf/about/2017-hvs-initial-findings.pdf.