School Spending, Enrollment, and Fiscal Cliffs 101:
The NYC Department of Education Budget Before, During, and After the Pandemic
Download the Executive Summary.
Download the Chartbook.
EXECUTIVE SUMMARY
More than one-third of New York City’s budget—$36.9 billion—is spent educating children. Few core City services are as important. Quality elementary and secondary education provides the opportunity to realize one’s full potential, improves equity, and underpins the City’s ability to attract and retain residents and businesses and in turn maintain its competitiveness.
This brief examines New York City Department of Education (DOE) spending, funding, and enrollment trends from fiscal years 2016 through 2026. Understanding these trends is vital when deciding how much of the City’s resources should be allocated to the DOE going forward. The Citizens Budget Commission (CBC) found that:
- The DOE’s fiscal year 2023 budget totaled $36.9 billion as of January 2023, comprised of the $31.2 billion agency operating budget plus $5.6 billion for pension contributions, debt service, and additional fringe benefits that are allocated centrally;
- Between fiscal years 2016 and 2022, DOE spending grew 32.5 percent, or 4.8 percent annually;
- Thirty percent of spending growth was due to one-time federal pandemic aid;
- Long-term enrollment declines accelerated during the COVID-19 pandemic. Between school years 2015-16 and 2021-22, K-12 DOE enrollment declined by more than 141,000 students, with the largest losses (90,000 students) occurring during the pandemic;
- Simultaneous spending increases and enrollment declines led to rapid increases in per-student spending. In fiscal year 2022, the DOE spent more than $37,000 per K-12 DOE student—up 15.2 percent from the prior year and 46.9 percent since fiscal year 2016, including centrally allocated cost;
- The total DOE budget for fiscal year 2024 is projected to decrease by $401 million to $36.5 billion, primarily due to a $243 million decrease in federal pandemic aid;
- After resuming growth, the total DOE budget is projected to reach $37.3 billion in fiscal year 2026, without the benefit of federal pandemic aid;
- With enrollment declines projected to continue, K-12 DOE per-student spending will increase to nearly $38,000 in fiscal year 2024 and to more than $41,000 in fiscal year 2026. Adding unbudgeted yet likely collective bargaining costs, per-student spending would reach nearly $44,000 in fiscal year 2026;
- The recently announced Program to Eliminate the Gap (PEG) directs the DOE to reduce City- funded spending by 3 percent, which totals $421 million or roughly $392 per student in fiscal year 2024. Given projected enrollment declines, per-student K-12 DOE spending in fiscal year 2024 would still be $555 higher than in fiscal year 2023; and
- Federal pandemic aid continues to support ongoing programs that face an estimated fiscal cliff of $556 million in fiscal year 2026.
Decisions about the DOE’s budget should consider enrollment declines and the City’s precarious fiscal condition. Including unbudgeted collective bargaining costs, funding the fiscal cliff, and funding other underbudgeted programs, the City’s budget gap is likely $12.0 billion in fiscal year 2026, or larger if there is a recession. As the largest City agency, DOE spending will necessarily reflect fiscal realities.
CBC urges the City and the DOE to:
- Consider per-student spending and recognize that declining enrollment could yield flat or reduced total spending;
- Diligently manage the impact of enrollment declines in individual schools with appropriate changes in funding and staffing to ensure the smoothest possible continuity and equity of services;
- Identify priority programs funded by expiring federal pandemic aid and be transparent about whether the DOE plans to replace the one-time federal funds with recurring City and State resources or to shrink or end the programs; and
- Evaluate and modify DOE programs and initiatives to prioritize those that deliver maximum impact to the target populations.
INTRODUCTION
On March 15, 2020, Mayor Bill de Blasio announced that the New York City Department of Education (DOE) would halt in-person instruction because of the COVID-19 pandemic, immediately altering the lives of one million students across 1,800 public schools and throwing DOE operations into unprecedented upheaval. The DOE pivoted to providing remote instruction—required for all students for the remainder of the 2019-20 school year and optional throughout the 2020-21 school year as other City students returned to in-person learning—and then increased focus on addressing student learning loss from more than two years of interrupted learning time.
Although student enrollment had already been declining prior to 2020, the pandemic accelerated this trend. Meanwhile, to support pandemic response and recovery, New York City has received $7.0 billion in federal education aid since December 2020, through the Coronavirus Response and Relief Supplemental Appropriations Act (CRRSAA) and the American Rescue Plan Act (ARPA). Of the $7.0 billion, nearly $3.0 billion has been spent in fiscal years 2021 and 2022, with the remaining $4.0 billion to be spent through fiscal year 2025.
This brief examines DOE spending, funding, and enrollment trends prior to and through as well as what is proposed for after the pandemic (from fiscal years 2016 through 2026). Understanding these trends is vital when deciding how much of the City’s resources should be allocated to the DOE going forward.
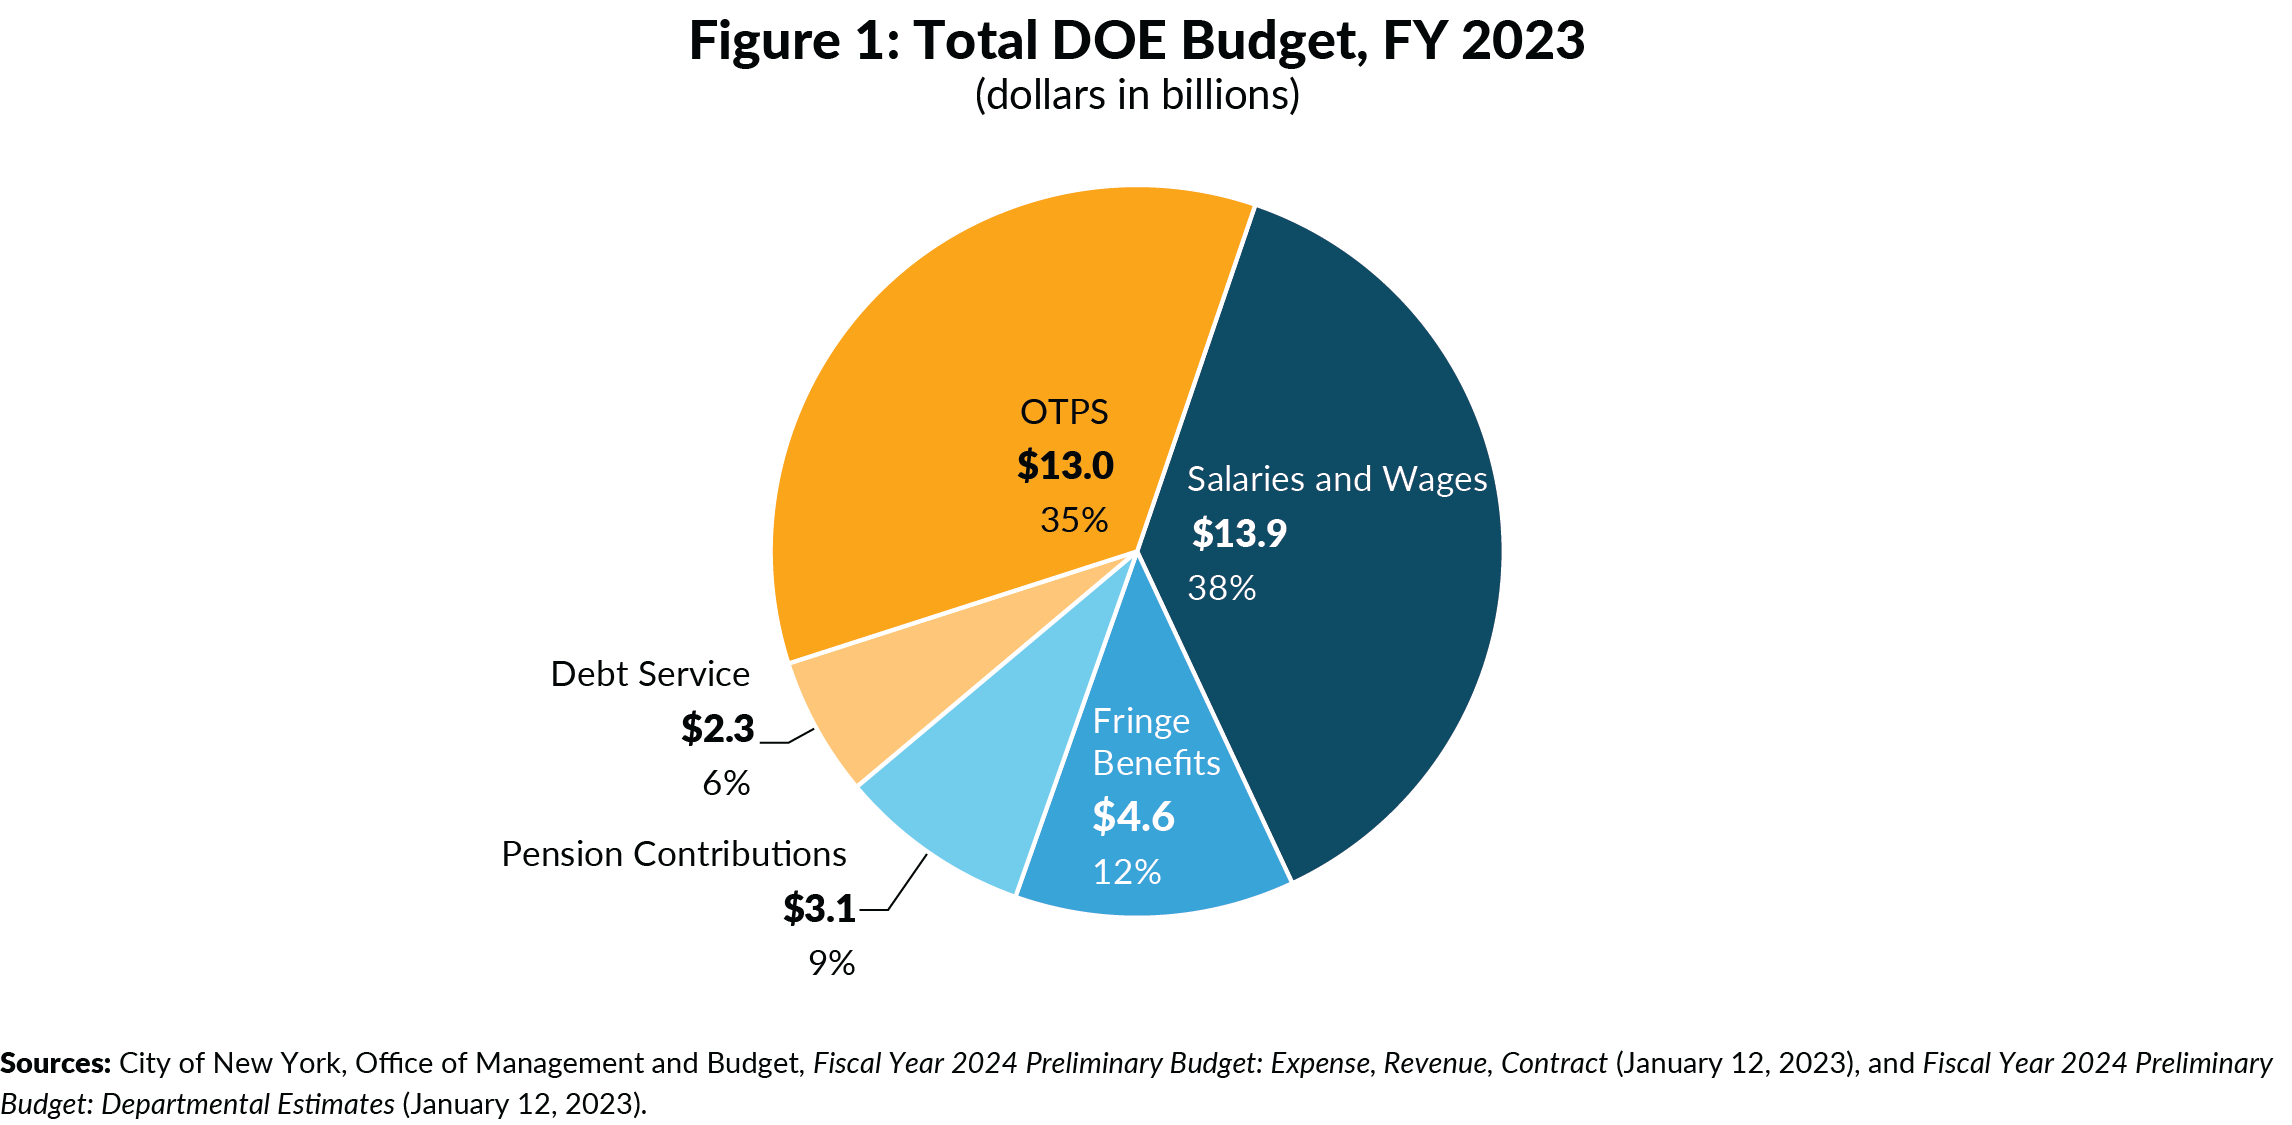
THE DOE’S TOTAL BUDGET IS $36.9 BILLION IN FISCAL YEAR 2023, FULLY 35 PERCENT OF THE CITY’S TOTAL BUDGET.
Including centrally allocated expenditures for pensions contributions, debt service, and fringe benefits, the City is spending $36.9 billion on DOE instruction and administration in fiscal year 2023. (See Figure 1.) The DOE agency operating budget is $31.2 billion, including $4.3 billion for fringe benefits. An additional $5.6 billion is allocated centrally, including $3.1 billion for pension contributions, $2.3 billion for debt service, and $218 million for additional fringe benefits.
Fully 59 percent of DOE spending is for personnel, comprised of 38 percent for salaries and wages, 12 percent for fringe benefits, and 9 percent for pension contributions. Another 6 percent covers debt service costs for capital investments in the City’s schools. The remaining 35 percent, $13.0 billion, pays for other than personal services (OTPS) such as pupil transportation, contracted early childhood providers, materials and supplies, and pass-through funding for charter schools and payments to non-public schools.
DOE SPENDING GREW 4.8 PERCENT ANNUALLY SINCE FISCAL YEAR 2016, TO $37.6 BILLION IN FISCAL YEAR 2022, BOLSTERED BY FEDERAL PANDEMIC AID. DWINDLING FEDERAL AID IN FISCAL YEARS 2023 AND 2024 CAUSES PROJECTED BUDGET DECLINES, AFTER WHICH SPENDING GROWTH RESUMES, REACHING $37.3 BILLION IN FISCAL YEAR 2026.
Between fiscal years 2016 and 2022, the DOE’s total budget grew at an annual average of 4.8 percent, from $28.4 billion to $37.6 billion. (See Figure 2.) Spending steadily increased prior to the pandemic, growing 5.8 percent annually between fiscal years 2016 and 2019; City funding grew 6.6 percent per year while State funding grew 5.2 percent per year. Spending increased slightly in fiscal year 2020 and remained flat in fiscal year 2021, likely due to pandemic-related savings from operations and programs suspended during the remote learning period. Then, in fiscal year 2022, DOE spending reached a record-high $37.6 billion—up 9.0 percent in just one year, in large part due to an influx of $2.7 billion in federal pandemic aid.
While DOE spending would have grown without the addition of federal pandemic aid, this federal funding was responsible for 30 percent of spending growth between fiscal years 2016 and 2022. In response to the pandemic, the City received $7.0 billion in federal pandemic education aid through CRRSAA and ARPA to support pandemic response and recovery—the DOE spent $3.0 billion in fiscal years 2021 and 2022 and must spend the remaining $4.0 billion before the funds expire at the end of fiscal year 2025.1,2
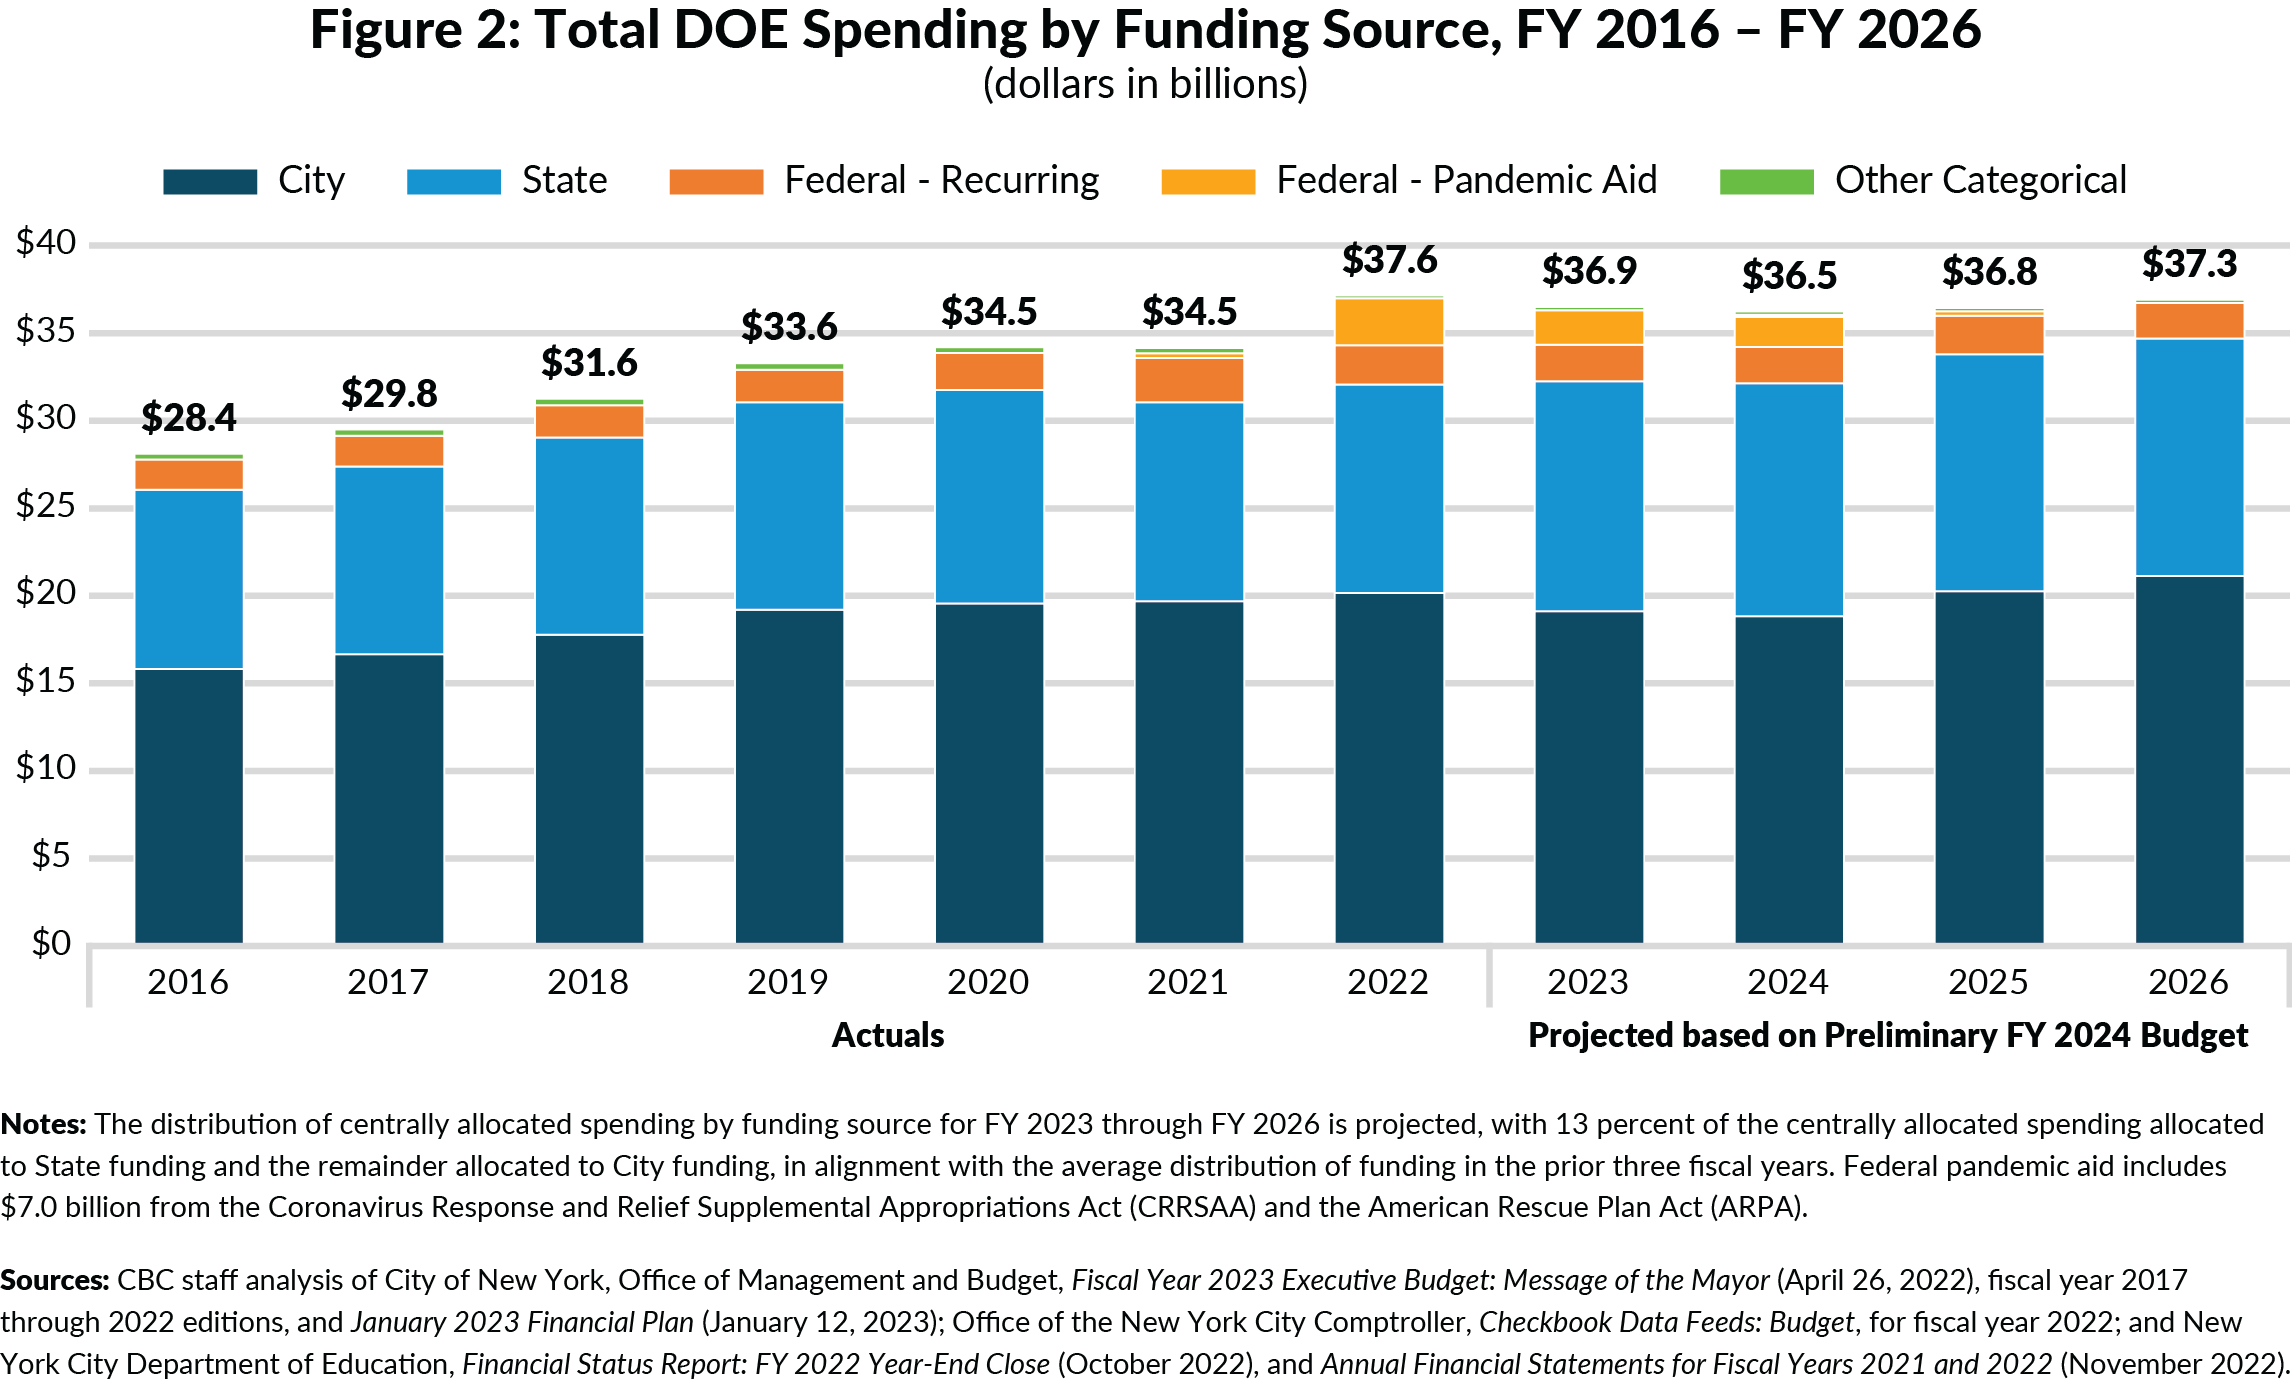
Much of the growth between fiscal years 2016 and 2022 was due to City funds, which were 47.5 percent of the increase; State aid growth, including the commitment to fully fund Foundation Aid by school year 2023-24, was another 18.4 percent of the growth.3
With the City’s decision to spend the largest portion of federal pandemic aid in fiscal year 2022 and taper funds in the remaining years, the DOE’s modified budget for fiscal year 2023 hovers at $36.9 billion, down nearly $750 million from the previous year, primarily due to the $717 million decline in federal pandemic aid.
The preliminary DOE budget for fiscal year 2024 decreases by $401 million to $36.5 billion, largely due to a $243 million decrease in federal pandemic aid. After fiscal year 2024, the DOE budget increases annually to $37.3 billion in fiscal year 2026, just shy of fiscal year 2022 spending, without any federal pandemic aid. State aid increases to $13.7 billion by fiscal year 2026, growing 3.4 percent per year between fiscal years 2022 and 2026.
Currently, budgeted spending for fiscal year 2023 is set to decline $433 million for K-12 DOE schools, $402 million for ancillary school services such as transportation and school food, $375 million for central costs, and $94 million for non-public school payments; this is offset by increases of $276 million for early childhood, $209 million for charter schools, and $71 million for school support services, such as field-based support. (See Figure 3.) However, there will likely be further changes before the year ends, so whether fiscal year 2023 will be lower or higher than the current budget remains to be seen.4
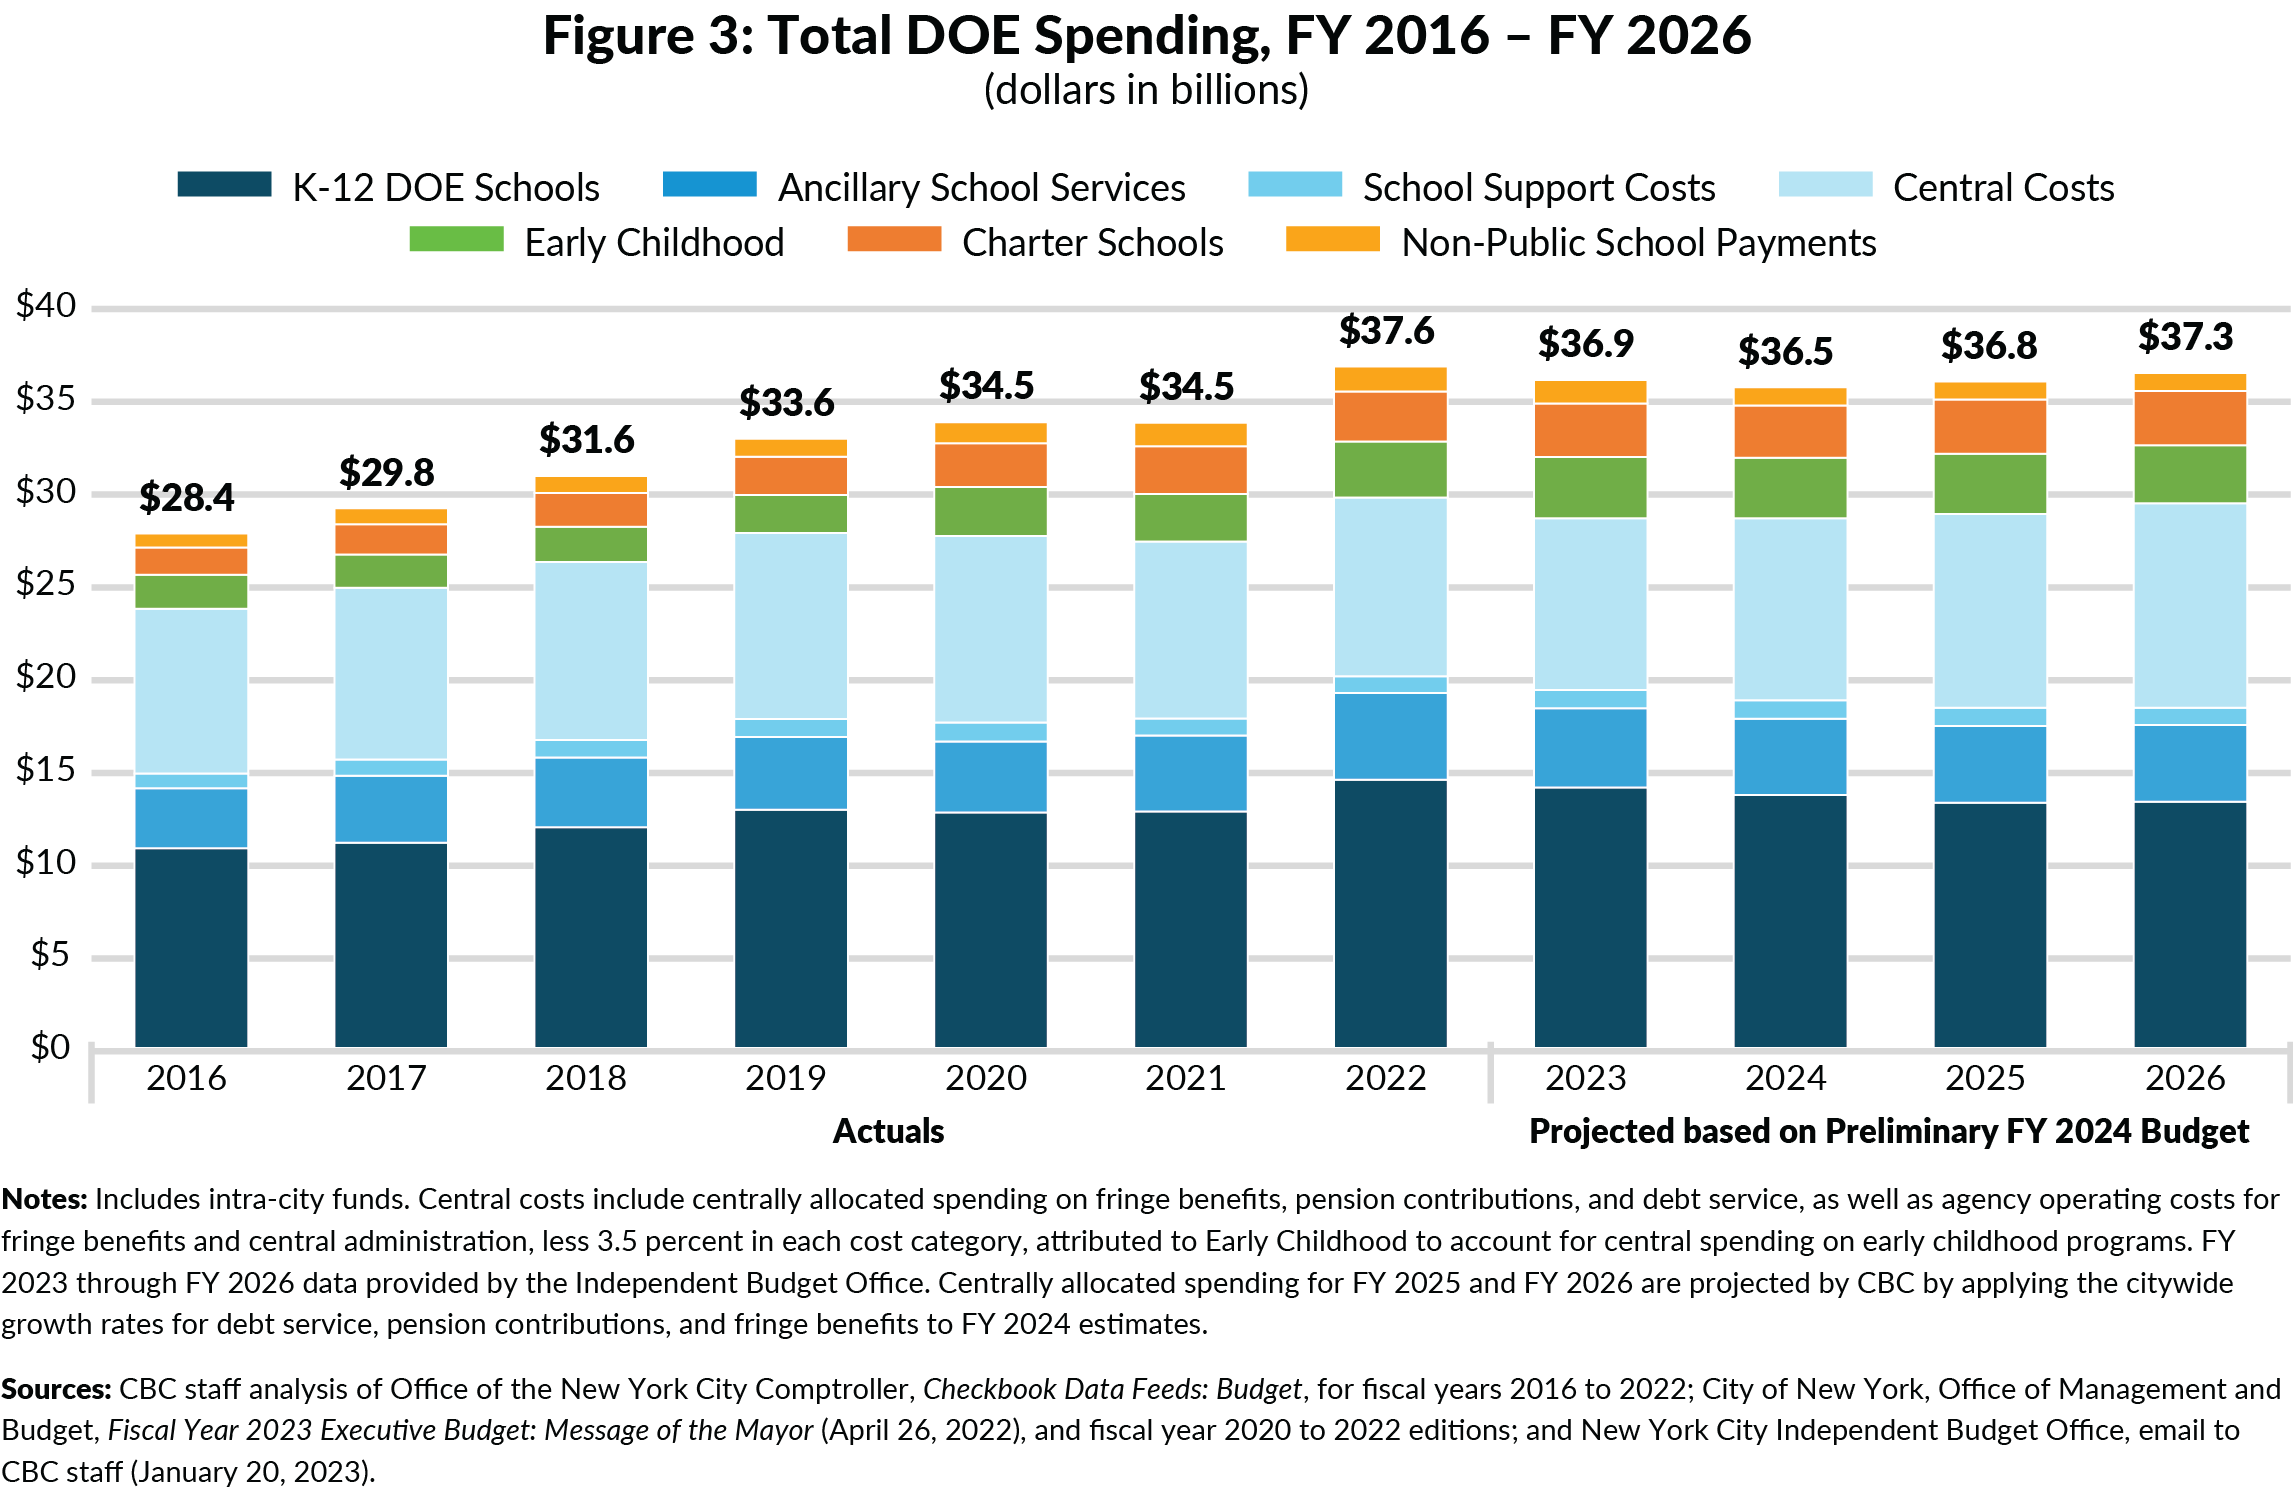
Out-year spending is likely understated since the City consistently underbudgets at least $500 million annually for spending on pupil transportation, charter schools, and Carter Cases that fund private school tuition for special education students.5In addition, out-year budgets do not include the likely cost of collectively bargained raises; extending the tentative District Council 37 pattern to all DOE employees would add an estimated $2.1 billion to spending in fiscal year 2026, which, along with underbudgeted spending, could increase spending in fiscal year 2026 to $39.8 billion.6
BETWEEN FISCAL YEARS 2016 AND 2022, SPENDING ON EARLY CHILDHOOD EDUCATION, NON-PUBLIC SCHOOL PAYMENTS, AND CHARTER SCHOOLS GREW AT APPROXIMATELY TWICE THE RATE OF SPENDING ON K-12 DOE SCHOOLS.
While total DOE expenditures increased 32.5 percent between fiscal years 2016 and 2022, or 4.8 percent annually, growth varied by function. Spending directly related to instruction and leadership in K-12 DOE schools grew at a comparable rate, 34.4 percent. (See Figure 4.) Spending on ancillary school services—such as transportation, food services, school safety, and facilities— grew at a similar pace. Spending on school support costs, including special education instructional support and support for field-based administration, grew more slowly, 15.3 percent between fiscal years 2016 and 2022. Spending on central costs, including central administration, fringe benefits, pension contributions, and debt service, saw the slowest growth.
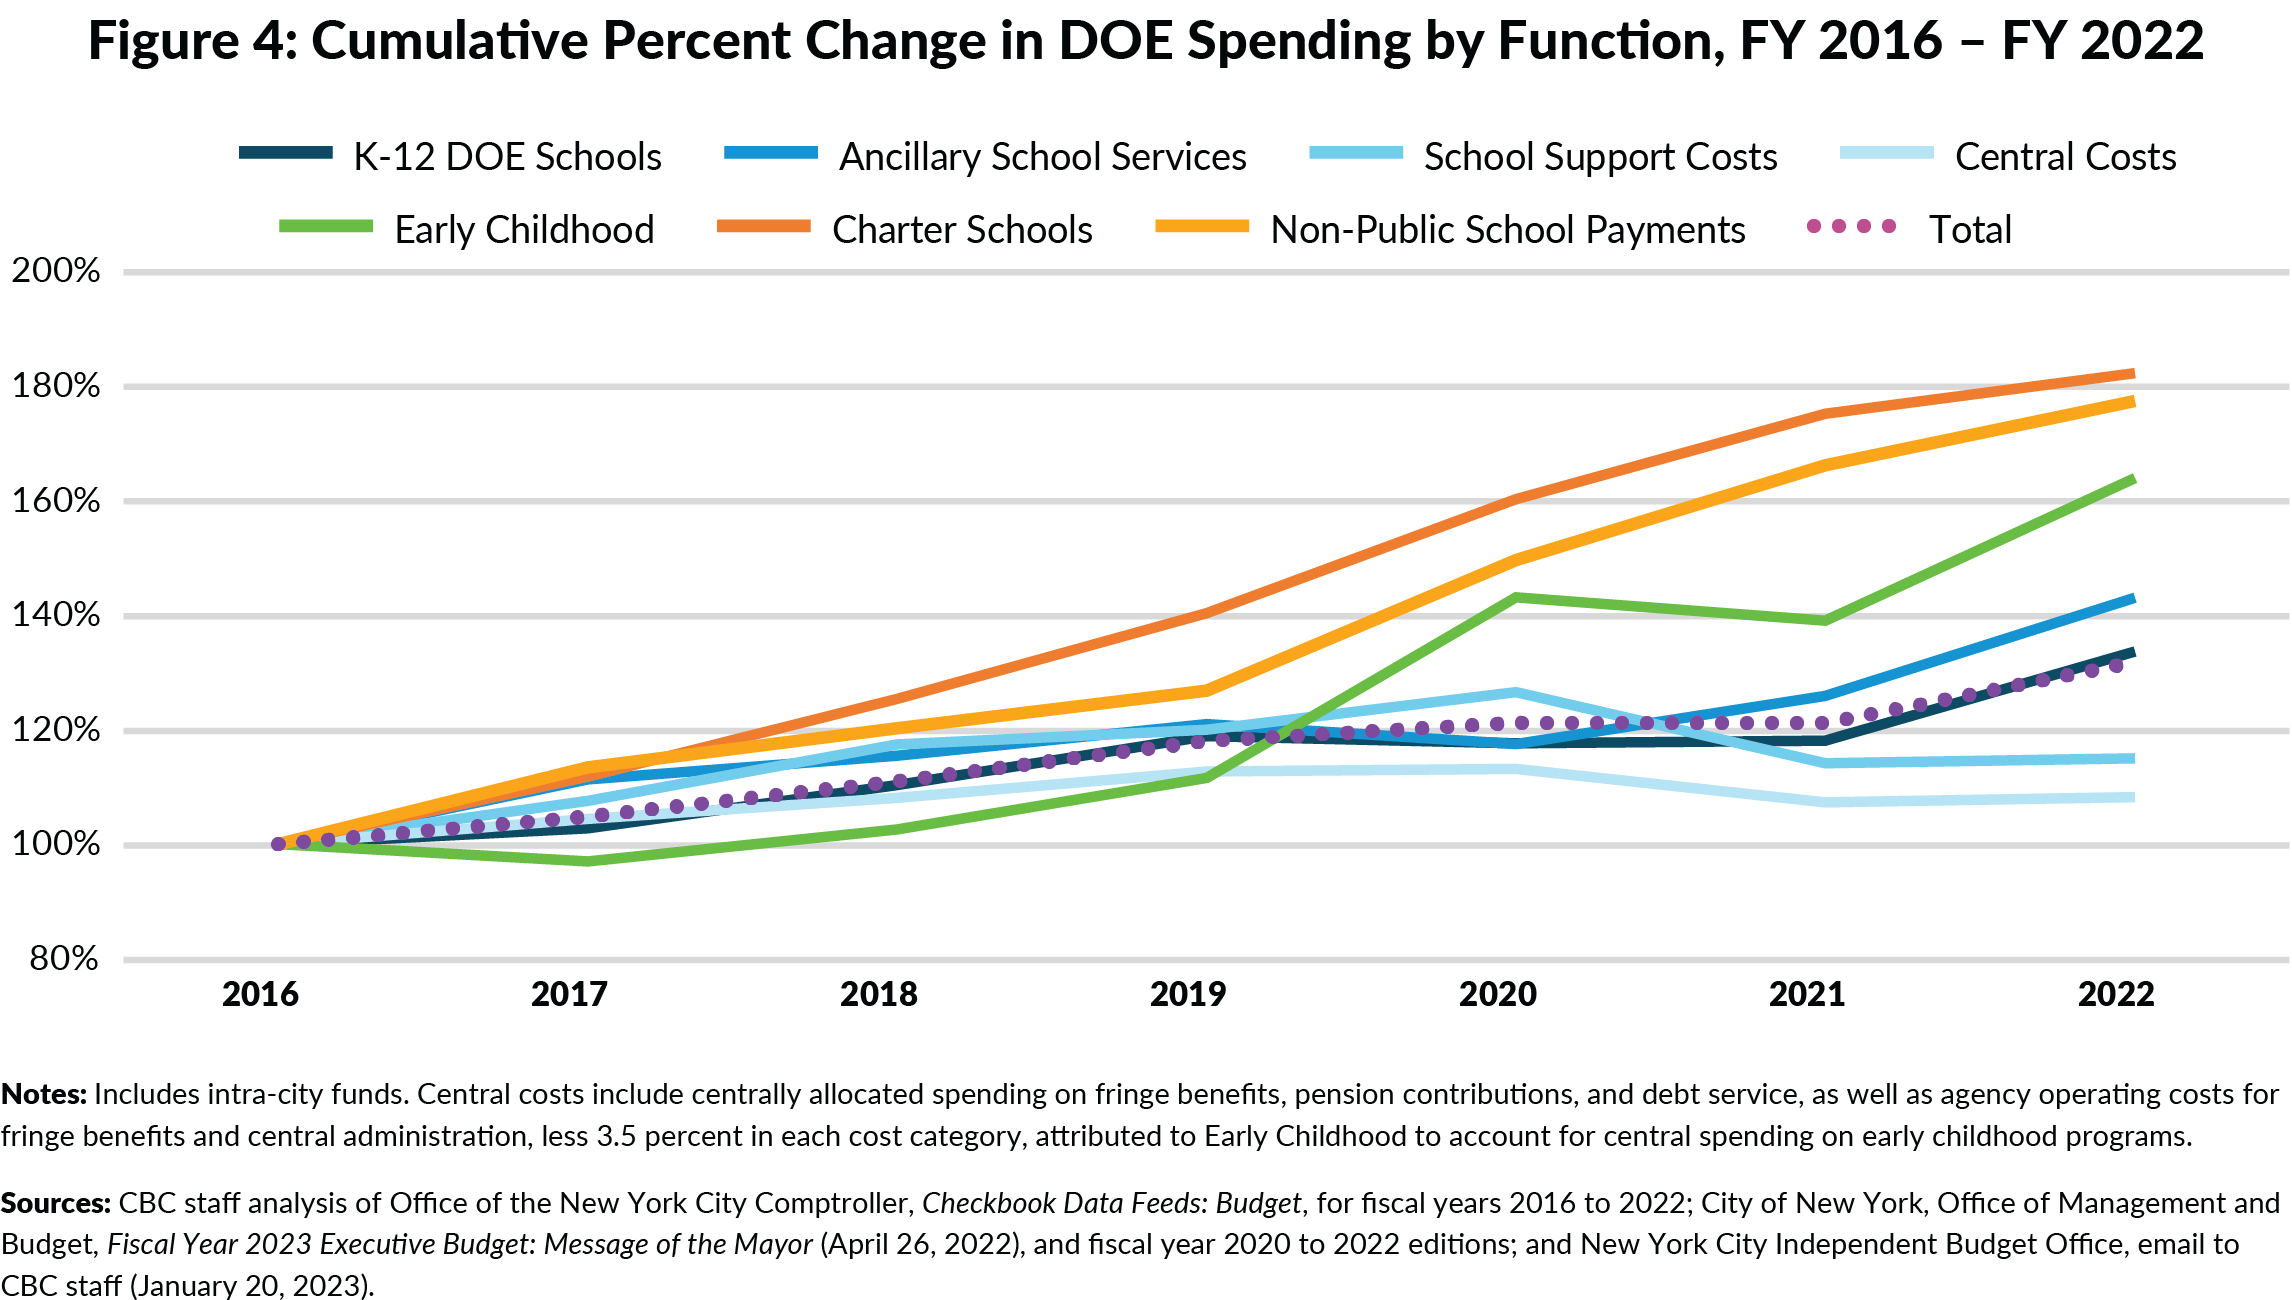
On the other hand, spending for three areas grew at roughly twice the average rate: early childhood education at 65.3 percent, non-public school payments at 79.0 percent, and charter schools at 84.0 percent. Enrollment growth at charter schools, early childhood programs, and Carter Cases drove spending increase in those areas.7,8
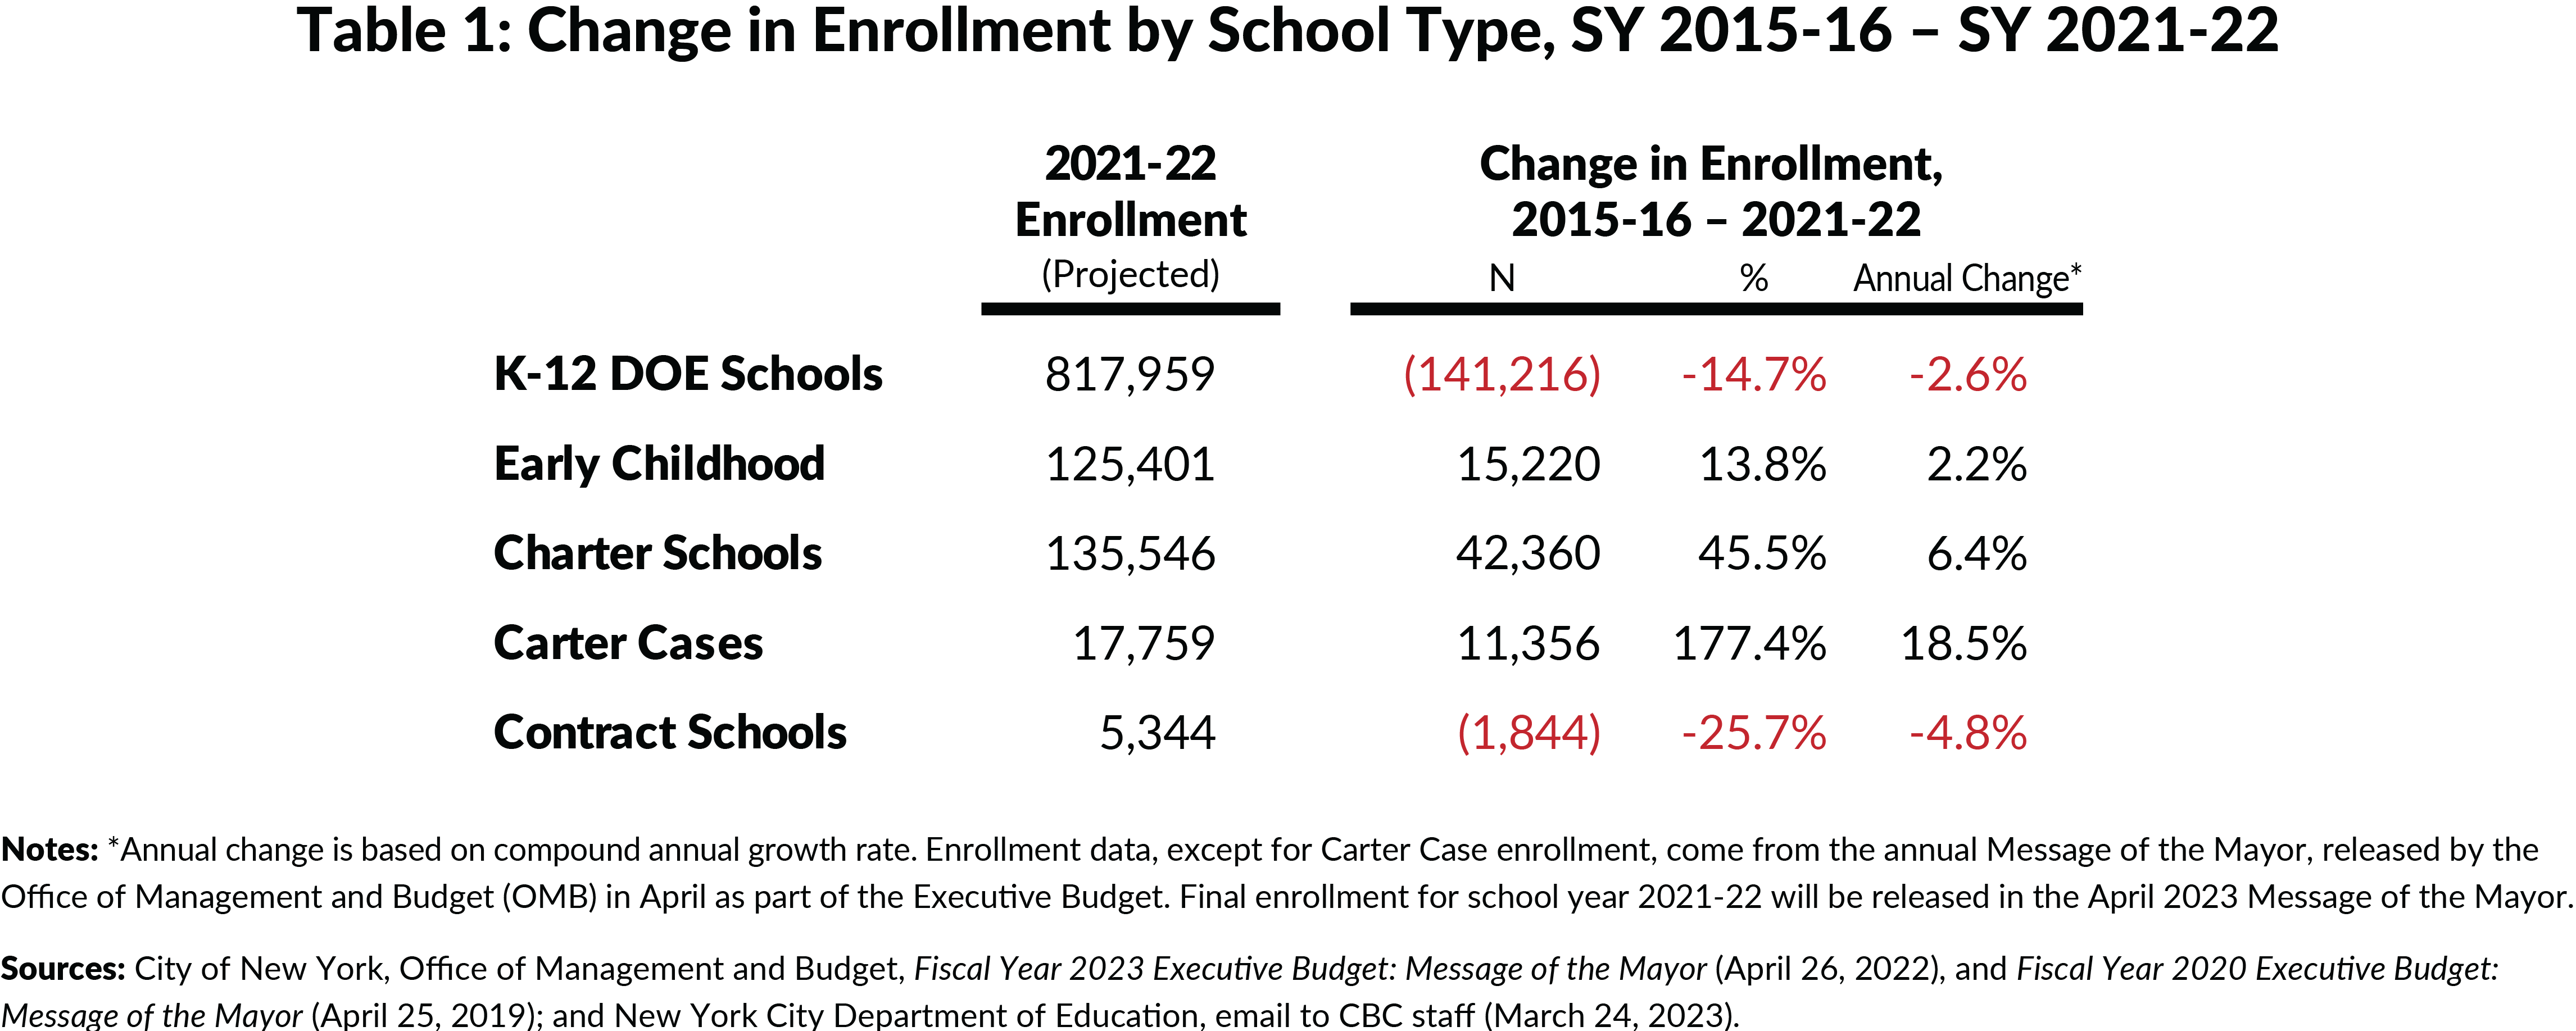
WHILE SPENDING INCREASED, ENROLLMENT IN K-12 DOE SCHOOLS, EXCLUDING CHARTER SCHOOLS, DECLINED BY 141,000 STUDENTS BETWEEN SCHOOL YEARS 2015-16 AND 2021-22, ACCELERATING DURING THE PANDEMIC.
Between school years 2015-16 and 2021-22, K-12 DOE schools lost more than 141,000 students, a decrease of 2.6 percent per year, with the largest losses (90,000 students) during the pandemic.9 (See Figure 5 and Table 1.) Between school years 2015-16 and 2019-20, K-12 DOE school enrollment declined an average of 12,800 students annually (1.4 percent); in school years 2020- 21 and 2021-22, losses surged to 45,000 per year (5.1 percent). The largest declines came from students in kindergarten through sixth grade—suggesting some never enrolled in DOE schools.10
After hovering around 110,000 students annually from school years 2015-16 through 2018-19, early childhood enrollment increased by nearly 21,000 students (18.9 percent) in school year 2019- 20 with the expansion of 3-K for All. Following a decline in school year 2020-21, during the peak of the pandemic, enrollment increased in school year 2021-22, but remained about 5,000 students below school year 2019-20 levels.
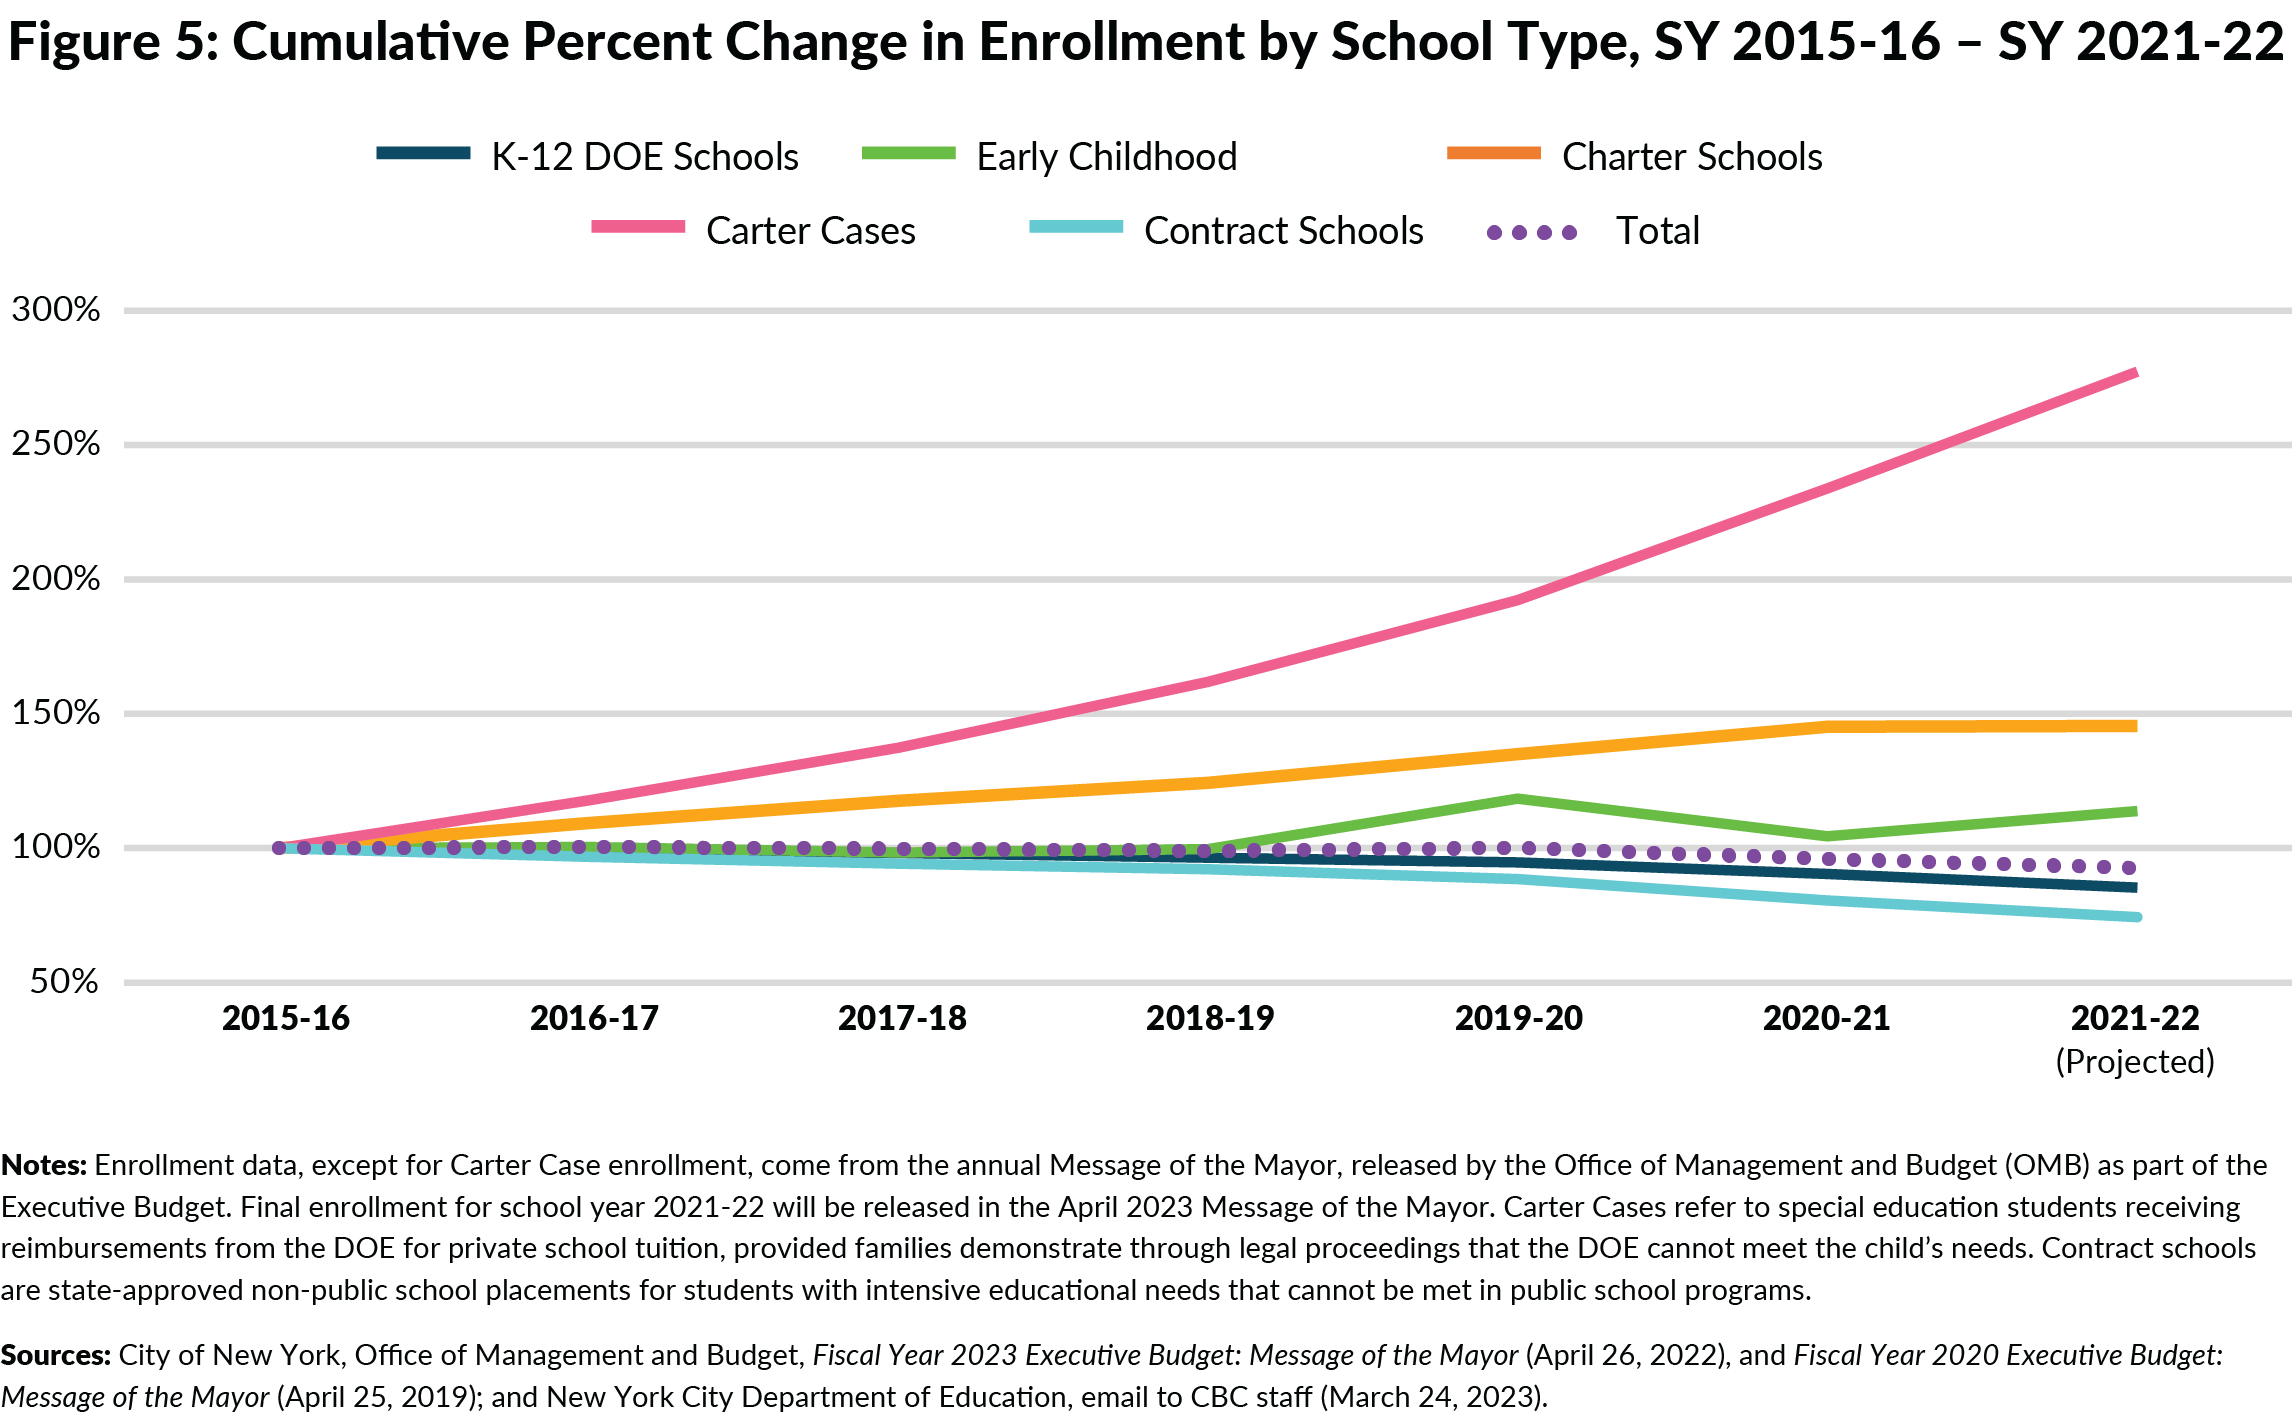
Charter school enrollment increased steadily between school years 2015-16 and 2020-21, averaging 7.7 percent annually (or an average increase of 8,400 students per year). However, growth stagnated in school year 2021-22, with charter schools seeing an increase of just 0.2 percent.
The number of special education students receiving reimbursements from the DOE for private school tuition, known as Carter Cases, nearly tripled over the past seven years; Carter Cases grew an astounding 18.5 percent per year, from 6,403 students in school year 2015-16 to 17,759 students in school year 2021-22.11
Finally, the number of students in contract schools—state-approved non-public school placements for students with intensive educational needs that cannot be met in public school programs—has decreased 4.8 percent annually between school years 2015-16 and 2021-22, with 5,344 students enrolled in school year 2021-22.12
The enrollment data by school type is only available for students whose schooling is funded by the DOE; children residing in New York City who attend private school or are home-schooled are excluded. A separate dataset from the New York State Education Department (NYSED) provides the enrollment for all students who live in New York City.13 According to NYSED, the number of New York City students enrolled in K-12 private schools declined at an annual average of 3,000 students, or 1.3 percent per year, between school years 2015-16 and 2021-22.14 The number of New York City students receiving home instruction increased dramatically during the same time period (26.4 percent per year between school years 2015-16 and 2021-22), nearly doubling during the pandemic from 6,800 students in school year 2019-20 to 12,900 students in school year 2021- 22.15
GIVEN SPENDING INCREASES AND ENROLLMENT DECLINES, PER-STUDENT SPENDING IN K-12 DOE SCHOOLS INCREASED RAPIDLY TO MORE THAN $37,000 IN FISCAL YEAR 2022; ASSUMING ENROLLMENT CONTINUES TO DECLINE, SPENDING WILL SURPASS $41,000 PER STUDENT BY FISCAL YEAR 2026.
Simultaneous spending increases and enrollment declines led to rapid increases in K-12 DOE per- student spending. While this was already the case prior to the pandemic, an influx of $2.3 billion in federal pandemic aid in fiscal year 2022 led to a 9.0 percent spending increase while enrollment declined 5.7 percent. CBC’s analysis found that in fiscal year 2022, including centrally allocated costs, the DOE spent $37,136 per K-12 DOE student—up 15.2 percent from the prior fiscal year and 46.9 percent since fiscal year 2016, when the DOE spent $25,276 per student. (See Figure 6.)
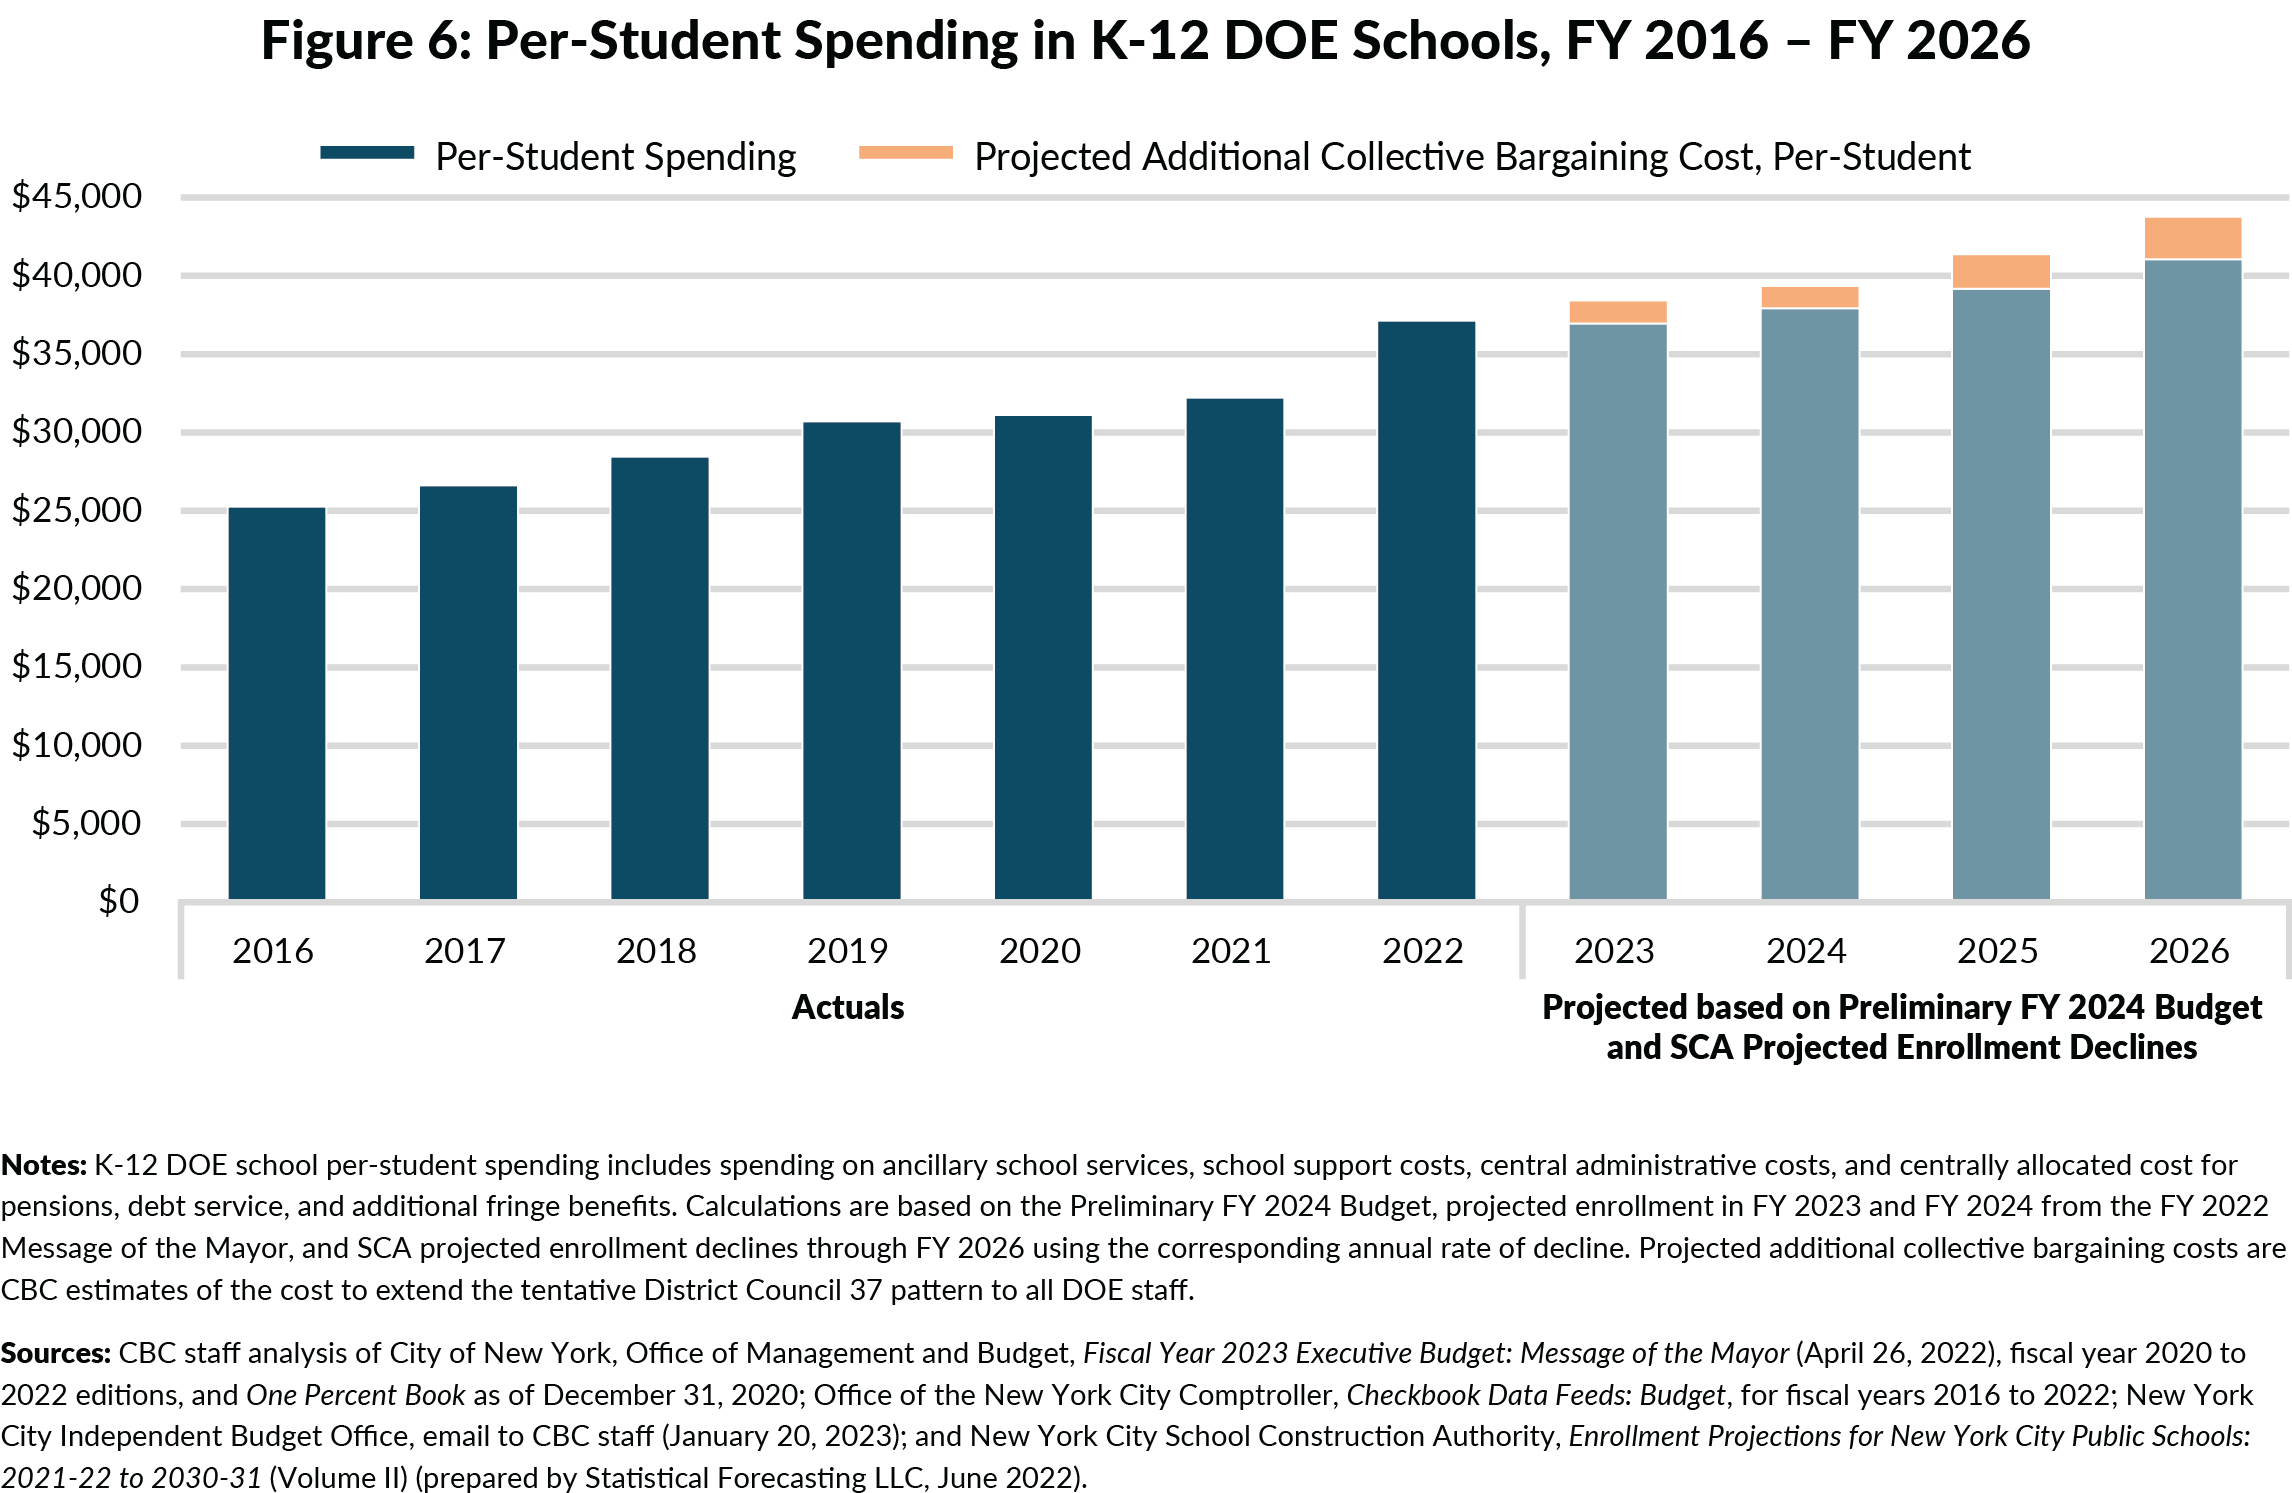
CBC’s analysis found that the total DOE budget will return to $37.3 billion in fiscal year 2026, a 1.0 percent decrease from the $37.6 billion budget in fiscal year 2022.16 While the budget remains relatively flat, the School Construction Authority’s (SCA) annual enrollment projections forecast a continued decline in K-12 DOE school enrollment (excluding charter schools). Based on these projections, per-student spending on K-12 DOE schools would continue to increase at an annual average of 2.5 percent, to $37,925 in fiscal year 2024 and $41,069 in fiscal year 2026.
The City’s recently announced Program to Eliminate the Gap (PEG) directs the DOE to identify savings equal to 3 percent of its City-funded spending, which totals $421 million in fiscal year 2024, growing to $477 million in fiscal year 2026.17 This would reduce per-student spending by $392 in fiscal year 2024. Given declining enrollment, the PEG does not need to reduce per-student spending year-over-year; fiscal year 2024 per-student spending for K-12 DOE students would be $37,533, greater than per-student spending of $37,136 and $36,979 in fiscal years 2022 and 2023, respectively. Additionally, if the DOE uses its discretion to implement the PEG through efficiencies in ancillary, central, and support costs, it would avoid cuts to school budgets.
Furthermore, out-year budgets do not include likely additional costs for collectively bargained raises. CBC’s analysis found that if the tentative pattern for employee raises set in negotiations with District Council 37 were extended to all DOE employees, DOE spending would be an additional $6.2 billion through fiscal year 2026—$2.4 billion in the central Labor Reserve plus an additional $3.9 billion not yet reflected in the financial plan.
When distributing these labor costs by fiscal year, DOE spending would be $1.2 billion higher in fiscal year 2023 and $2.1 billion higher in fiscal year 2026, $2.0 billion of which would be spent on K-12 DOE schools. This increase is $2,709 per K-12 DOE student, bringing the full per-student spending to $43,778 in fiscal year 2026.
In addition, certain program costs have not been fully budgeted in out-years, such as the spending for Carter Cases, pupil transportation, and charter schools. These are likely to total at least $500 million annually, further increasing spending, overall and per student.
PER-STUDENT SPENDING ON EARLY CHILDHOOD PROGRAMS, CHARTER SCHOOLS, CARTER CASES, AND CONTRACT SCHOOLS GREW AT VARIED RATES BETWEEN FISCAL YEARS 2016 AND 2022.
Mirroring the per-student spending trend at K-12 DOE schools, per-student spending at early childhood programs grew at an annual average of 6.4 percent between fiscal years 2016 and 2022. (See Figure 7.) While early childhood enrollment was fairly flat from school year 2015-16 to school year 2018- 19, spending increased 3.8 percent per year on average. Additional federal pandemic aid supported the expansion of 3-K for All, the growth of which outpaced enrollment growth and drove per-student spending from $17,040 in fiscal year 2016 to $24,744 in fiscal year 2022. (The SCA data excludes pre-K special education schools, which are included in CBC’s analysis, therefore SCA projections cannot be used to determine per-student spending at early childhood education programs.)
Per-student spending by the DOE at charter schools remains lower, at $20,281 in fiscal year 2022, with annual average increases of 4.0 percent since fiscal year 2016. However, this is limited to pass-through DOE funding to charter schools for mandated tuition and rental reimbursement and does not include funding for other DOE-funded services and the additional funding charter schools receive from sources that do not pass through the DOE, such as private philanthropic funds.
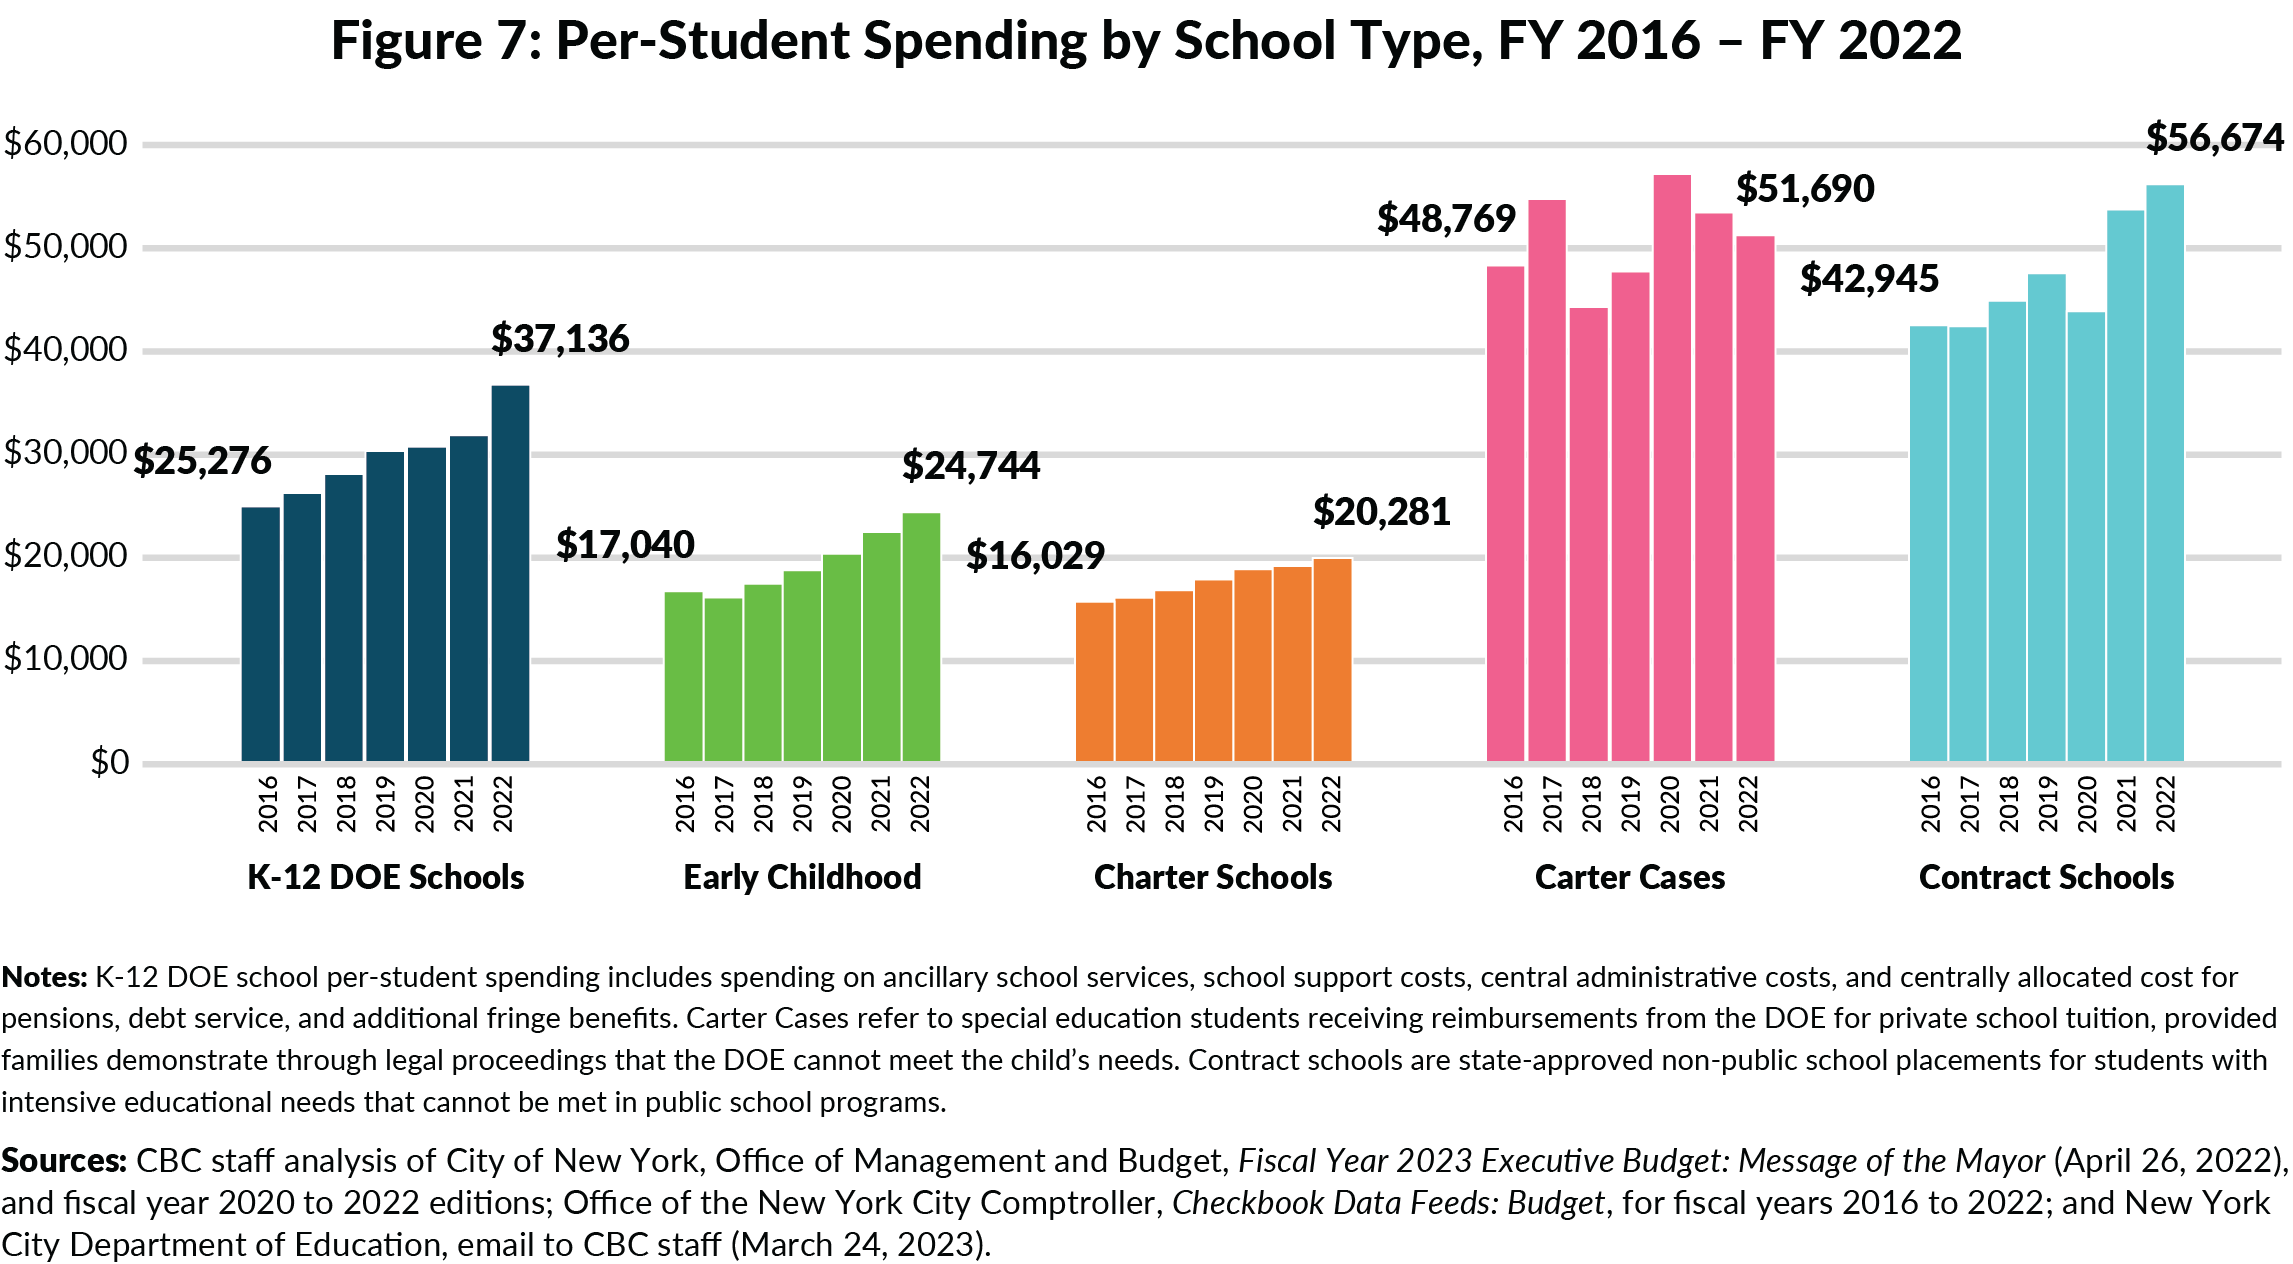
Meanwhile, per-student spending for students in Carter Cases was $51,690 in fiscal year 2022, up 6.0 percent since fiscal year 2016. Despite consistent and large enrollment growth (up to nearly 18,000 students in school year 2021-22), total spending has fluctuated, likely due to changes in tuition costs, leading to inconsistent trends in per-student spending. In fiscal year 2022, per- student spending on Carter Cases was 39.2 percent higher ($14,554) than per-student spending on K-12 DOE schools, which includes special education students in community school districts and District 75. Carter Case spending is paid entirely by City funds.
Finally, per-student spending for students in contract schools has grown 4.7 percent per year on average between fiscal years 2016 and 2022, with the largest increase (22.4 percent) during the pandemic in fiscal year 2021; spending reached an average of $56,674 per student in fiscal year 2022.
NEARLY ONE-THIRD OF AGENCY SPENDING GROWTH BETWEEN FISCAL YEARS 2016 AND 2022 WAS DRIVEN BY NON-RECURRING FEDERAL PANDEMIC AID, MUCH OF WHICH THE DOE HAS SPENT ON ONGOING PROGRAMS, LEADING TO FISCAL CLIFFS IN THE OUT-YEARS.
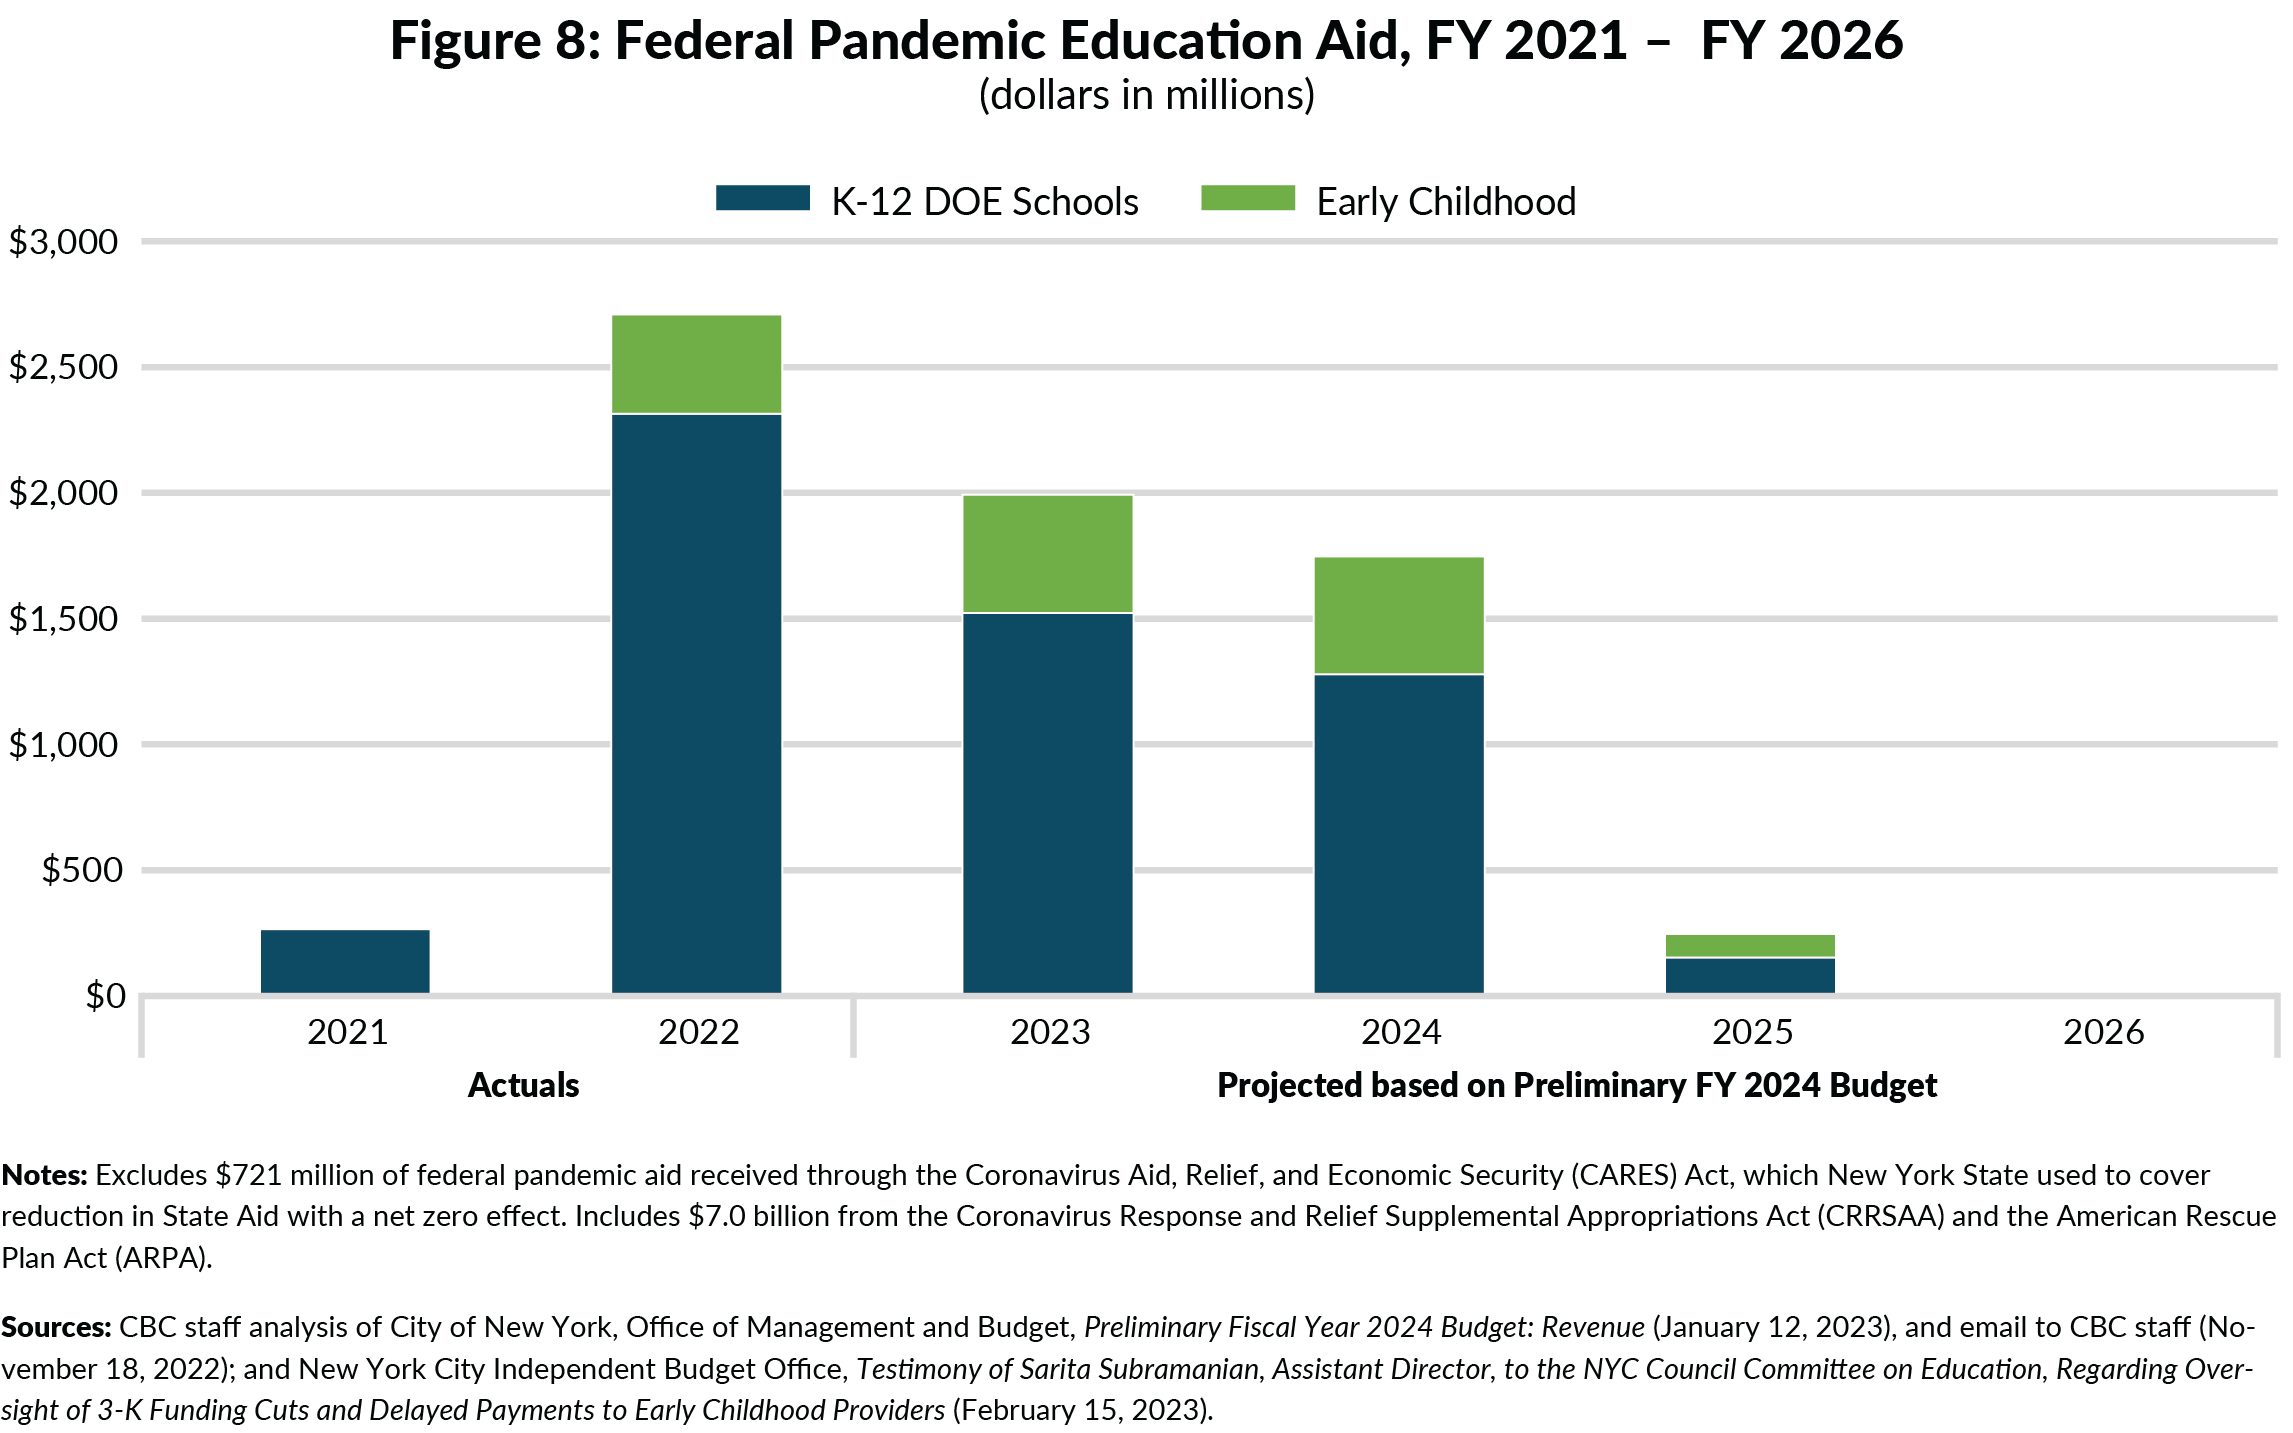
The DOE has received $7.0 billion in federal education aid to support pandemic response and recovery through CRRSAA and ARPA. (See Figure 8.) The DOE spent $3.0 billion of these federal pandemic funds in fiscal years 2021 and 2022.
CBC’s analysis found that in fiscal years 2021 through 2025, the DOE will spend $5.5 billion (80 percent) of the federal pandemic aid on K-12 DOE schools and $1.4 billion (20 percent) on early childhood education.
However, use of these funds peaked in fiscal year 2022 and are set to taper off rapidly before expiring at the end of fiscal year 2025. Based on the Preliminary Fiscal Year 2024 Financial Plan, the remaining $4.0 billion in non-recurring federal pandemic aid is budgeted across fiscal years 2023 to 2025 at $2.0 billion, $1.7 billion, and $246 million, respectively.
The Office of the New York State Comptroller (OSC) identified programs currently funded by non-recurring federal pandemic aid and estimated fiscal cliffs of $321 million in fiscal year 2025 and $556 million in fiscal year 2026, once federal pandemic aid has fully expired.18 Some of the programs and initiatives receiving at least partial funding through one-time federal pandemic aid include the expansions of 3-K for All, Pre-K for All Special Education, and Community Schools. The City and the DOE have not been adequately transparent about whether federally funded programs will end once the federal pandemic aid expires, or whether funds from other programs and services will be redistributed to maintain these programs.
CONCLUSION
Decisions about the DOE’s budget should consider enrollment declines and the City’s precarious fiscal condition. Including unbudgeted collective bargaining costs, funding fiscal cliffs, and funding other underbudgeted programs, the City’s budget gap is likely $12.0 billion in fiscal year 2026, or larger if there is a recession.19 As the largest City agency, DOE spending will necessarily reflect fiscal realities.
CBC urges the City and the DOE to:
- Consider per-student spending and recognize that declining enrollment could yield flat or reduced total spending;
- Diligently manage the impact of enrollment declines in individual schools with appropriate changes in funding and staffing to ensure the smoothest possible continuity and equity of services;
- Identify priority programs funded by expiring federal pandemic aid and be transparent about whether the DOE plans to replace the one-time federal funds with recurring City and State resources or to shrink or end the programs; and
- Evaluate and modify DOE programs and initiatives to prioritize those that deliver maximum impact to the target populations.
Download Chartbook
CHART-BOOK_DOE-Spending_04112023.pdfFootnotes
- New York City received an additional $721 million in federal pandemic education aid through the Coronavirus Aid, Relief, and Economic Security (CARES) Act, excluded because the State used these funds to reduce their formula aid with a net zero effect.
- City of New York, Office of Management and Budget, COVID-19 Funding Tracker: P-12 Education Stimulus (Updated February 2022), https://www.nyc.gov/site/covid19fundingtracker/education.page.
- New York State, Office of the Governor, “Governor Hochul Announces Settlement of NYSER v. NYS Case to Fully Fund Foundation Aid in New York's Schools” (press release, October 14, 2021), https://www.governor.ny.gov/news/governor-hochul-announces-settlement-nyser-v-nys-case-fully-fund-foundation-aid-new-yorks.
- K-12 DOE schools include schools in Community School Districts 1-32, District 75 (Special Education), and District 79 (Alternative Schools and Programs).
- New York City Independent Budget Office, DOE Needs Additional City Funding to Continue Programs Funded with Covid Aid, For Carter Cases, & More (March 2023), https://www.ibo.nyc.ny.us/iboreports/preliminary-budget-snapshot-march-2023.html.
- CBC staff analysis of City of New York, Office of Management and Budget, The Cost of a One Percent Increase: Data as of December 31, 2020, (Revised April 18, 2022); and City of New York, Office of the Mayor, “Mayor Adams and DC37 Announce Tentative Contract Agreement, Providing Fair Wage Increases and Other Benefits to Nearly 90,000 Employees and Securing Fair Deal for NYC Taxpayers” (press release, February 17, 2023), https://www.nyc.gov/office-of-the-mayor/news/120-23/mayor-adams-dc-37-tentative-contract-agreement-providing-fair-wage-increases-and#/0.
- The early childhood category includes students in 3-K for All, Pre-K for All, Special Education, and Early Learn.
- Non-public school payments include spending on Carter Cases (66 percent of spending in fiscal year 2022), students attending contract schools (22 percent of spending in fiscal year 2022), and additional spending on students in Blind and Deaf schools, year-round special education programming, and payments to the Fashion Institute of Technology (all totaling 12 percent of spending in fiscal year 2022).
- Enrollment numbers are based on the annual Message of the Mayor, the latest of which was released in April 2022. School year 2021-2022 enrollment is projected rather than actual.
- New York City Independent Budget Office, How Has Public School Enrollment Changed Two Years Into The Covid-19 Pandemic? (July 2022), how-has-public-school-enrollment-changed-two-years-into-the-covid-19-pandemic-nycbtn-july2022.pdf.
- Parents and guardians of students with disabilities can choose to place their children in private schools and receive tuition reimbursements or direct tuition payments to schools if they demonstrate through legal proceedings, known as a “Carter Case,” that DOE schools cannot meet the child’s needs. See: Florence County School Dist. Four v. Carter, 510 U. S. 7 (1993).
- New York City Department of Education, Special Education in NYC (Accessed March 2023), https://www.schools.nyc.gov/learning/special-education/school-settings/other-educational-settings.
- New York State Education Department enrollment data for students in public and charter schools do not align with the data in Figure 5 and Table 1 because of differences in classification, such as the inclusion or exclusion of long-term absences.
- New York State Education Department, Nonpublic School Enrollment (Updated November 2022), https://www.p12.nysed.gov/irs/statistics/nonpublic/.
- New York State Education Department, Children Instructed at Home (Updated May 2022), https://www.p12.nysed.gov/irs/statistics/HomeSchooled/home.html.
- Central costs for fiscal years 2025 and 2026 were projected by growing the fiscal year 2024 pension contributions, fringe benefits, and debt service amounts at the corresponding citywide growth rates, using the Preliminary Fiscal Year 2024 Financial Plan.
- City of New York, Office of Management and Budget, Fiscal Year 2024 Preliminary Budget: Financial Plan Expense (January 12, 2023), https://www.nyc.gov/assets/omb/downloads/pdf/jan23-fp.pdf.
- Office of the State Comptroller, Identifying Fiscal Cliffs in New York City’s Financial Plan (Updated February 23, 2023), https://www.osc.state.ny.us/reports/osdc/identifying-fiscal-cliffs-new-york-citys-financial-plan.
- CBC projection for the fiscal year 2026 budget gap, comprised of $5.0 billion existing gap (as of January 2023), $1.9 billion estimate of the City and federal fiscal cliff based on the Office of the State Comptroller, $1.1 billion in underspending on existing programs based on a review of monitor reports, and $3.9 billion to extend the tentative District Council 37 pattern citywide. See: City of New York, Office of Management and Budget, Fiscal Year 2024 Preliminary Budget: Financial Plan Detail (January 12, 2023), https://www.nyc.gov/assets/omb/downloads/pdf/tech1-23.pdf, and $688,320,000 General Obligation Bonds, Fiscal 2023 Series C and D Offering Statement (February 23, 2023), https://www.nyc.gov/assets/investorrelations/downloads/pdf/go-bonds-statements/2023/nycgo-2023c-d.pdf; Office of the State Comptroller, Identifying Fiscal Cliffs in New York City’s Financial Plan (Updated February 23, 2023), https://www.osc.state.ny.us/reports/osdc/identifying-fiscal-cliffs-new-york-citys-financial-plan, and Review of the Financial Plan of the City of New York (Report 14- 2023, December 2022), https://www.osc.state.ny.us/files/reports/osdc/pdf/report-14-2023.pdf; Office of the New York City Comptroller, Annual State of the City's Economy and Finances (December 15, 2022), https://comptroller.nyc.gov/reports/annual-state-of-the-citys-economy-and-finances; New York City Independent Budget Office, Current Year Surplus Projected Despite Slowing Economy, Future Year Challenges Remain (December 2022), https://www.ibo.nyc.ny.us/iboreports/current-year-surplus-projected-despite-slowing-economy-future-year-challenges-remain-fiscal-outlook-december-2022.pdf; and Citizens Budget Commission, Briefing on the NYC & NYS FY 23 Budget Update (December 13, 2022), https://cbcny.org/newsroom/briefing-latest-nyc-nys-fy-2023-budget-updates.