Still a Poor Way to Pay for Medicaid
For more than 50 years New York State has financed its Medicaid program in a unique way: the State requires New York City and the 57 other counties to pay more for Medicaid than all other local governments in the nation combined. In 2011 the Citizens Budget Commission (CBC) report, A Poor Way to Pay for Medicaid, criticized New York’s local share requirement as regressive and inequitable.1 New York State recently froze the local share burden. However, the framework put in place a half century ago continues to foist a more than $7 billion annual cost burden on local governments, and the heaviest burden is placed upon the poorest local districts. It is time for New York to adopt measures that will completely eliminate the required local share of Medicaid.
Background
New York Implements Medicaid (1966)
The Medicaid program was signed into federal law on July 30, 1965 by President Lyndon B. Johnson as part of historic legislation also creating the Medicare program of health insurance for all elderly Americans. Medicaid was designed to finance medical care for low-income Americans.2 Medicaid is jointly funded: the federal government pays half of the program costs in New York, and the other half comes from nonfederal (State or local) sources.3 The federal government provides authorization and oversight for Medicaid, but states develop their own plans for administering the program. Federal law grants the states flexibility to raise a portion of the nonfederal half from local governments, and New York chose that option. When New York Governor Nelson Rockefeller signed into law the State’s provisions to implement the program in 1966, the nonfederal half was split between the state government and local governments. The federal government would pay for 50 percent, the State would pay for 25 percent, and local districts–New York City and the 57 counties outside of New York City–would pay 25 percent.4
State Takeover Efforts Rejected (1981)
Since Medicaid began, New York’s program has always been among the largest in the nation in terms of enrollment and cost due to wide eligibility criteria and service offerings.5 Accordingly, the cost burden on local governments has always been large. In 1981 the annual local share of Medicaid was already greater than $1 billion. Governor Hugh Carey sought to have the State take over the Medicaid local share over seven years. The Assembly passed Governor Carey’s plan; however, the Senate rejected that proposal.6 Although the Senate Majority Leader publicly acknowledged that the local share was inappropriate because Medicaid is state-run, leaders could not agree on how to pay for the takeover.7
Partial Takeover Success (1983)
New York’s next Governor, Mario Cuomo, sought a takeover of the majority of the local share. In 1983 he proposed a five-year plan wherein the State would bear 90 percent of the nonfederal share.8 Again the Senate blocked the plan, but a deal was reached for the State to take on 90 percent of Medicaid long-term care costs (primarily nursing homes and home care) to save local governments $429 million in the first year alone.9 This was a significant success because long-term care costs represented nearly half of Medicaid spending at that time.10 This policy helped alter significantly the financing of Medicaid. By 2004 local districts were paying 16 percent of New York’s total Medicaid bill compared to 25 percent prior to the 1983 legislation.11
Growth Cap Enacted (2005)
Nevertheless the burden on local governments was still rising as county Medicaid expenditures were climbing an average of 8.6 percent annually.12 By 2005 the local share of Medicaid surpassed $6 billion annually statewide ($4.3 billion in New York City and $1.8 billion in the rest of the state).13 Then State Comptroller Alan Hevesi estimated that local property taxes would need to increase by one-third over five years to keep up with the cost of the local Medicaid share under the status quo.14 In 2005 a cap on the local share was proposed as part of Governor George Pataki’s executive budget and was enacted.15 The annual growth of the local share in the first three years (from 2006 through 2008) was capped at 3.5 percent, 3.25 percent, and 3 percent, respectively.16 Annually thereafter 3 percent of additional growth was permitted. Any cost growth above that level became the fiscal responsibility of the State.17
Freezing Local Share Growth (2012)
The 3 percent growth cap limited local governments’ liability, but the cap still allowed the statewide local share to increase approximately $182 million annually. In 2011 Governor Andrew Cuomo took office, and in 2012 the Governor and Legislature enacted a phaseout of local cost growth, ultimately resulting in a freeze. Over the next three years, annual growth was reduced from 3 percent to 0 percent in 2015. Annually thereafter each local district’s Medicaid local share could not exceed the 2015 level.18 All nonfederal costs above the frozen amount are now paid for by the State.19
The Current Local Share Landscape (2018)
Statewide, the frozen annual local share of Medicaid is $7.6 billion. New York City’s share is $5.3 billion, and $2.3 billion is paid by the 57 counties. Local districts also benefit from savings passed down by the State provided by the Affordable Care Act (ACA). Enhanced federal Medicaid funding from the ACA has reduced nonfederal Medicaid costs in New York, and a portion of the savings is required to be passed on to local districts. This year that amount is approximately $675 million, $184 million of which benefits counties, and $491 million benefits New York City.20 Accounting for the ACA funding, local districts currently pay $7 billion for Medicaid services annually. (See Figure 1.)

Cap and Freeze Savings Since 2005
From fiscal year 2005 through fiscal year 2018 the cap and freeze of Medicaid local share growth have saved local districts more than $15 billion. If the cap and freeze were not in effect, local districts would pay approximately $11 billion in fiscal year 2019 and $11.3 billion in fiscal year 2020 as opposed to the currently required $7 billion. Most of these savings can be attributed to the period during which cost growth was frozen (2015 and later). Savings are now steadily increasing; the freeze will save local governments another $15 billion over the next four years. (See Figure 2.)

Of the estimated $15.4 billion of reduced local share costs from fiscal year 2006 to fiscal year 2018, New York City benefitted from a $6.4 billion reduction compared to $9 billion in the rest of the state. These savings are not in proportion to the frozen costs: New York City’s costs represent 70 percent of statewide local share costs, but New York City’s savings are only 42 percent of local share savings. This trend is driven by concurrent enrollment increases over the period. Figure 3 illustrates Medicaid enrollment in the rest of the state increased at a far greater rate (73 percent) than in New York City (26 percent).

In recent years enrollment has leveled, and the State projects that enrollment will remain relatively flat over the coming years.21 As enrollment levels off, local district savings will accrue more evenly. In fiscal year 2022 it is expected that New York City will save $2.1 billion, and the rest of the state will save $2.2 billion.
Problems Persist Under the Freeze
New York’s local share is still an aberration nationally; New York requires more local contributions to finance Medicaid services than all other states in the nation combined.22 Although the freezing of the local share now saves local districts more than $3 billion annually, three fundamental problems associated with the local share persist:
- It is an unfunded mandate – Local governments have no legislative authority and highly limited administrative authority over the program.
- It is a tax burden on local governments – The local share consumes a large share of county budgets.
- It is regressive – The least wealthy counties shoulder the largest proportional burden.
The freeze has halted the growth of the local share and the negative effects associated with it, and the State deserves positive recognition for this step. However, the freeze does not reverse the inequities; rather it perpetuates them.
The Local Share Remains a Significant Burden on Local Governments
In 2016 the Medicaid local share averaged 8.6 percent of local districts’ gross expenditures, ranging from a low of 3.2 percent in Hamilton County to a high of 15.5 percent in Fulton County. (See Figure 4.)

In 2005 the Medicaid local share represented 9.3 percent of local district expenditures, indicating that the cap and freeze have decreased the share of local district budgets consumed by Medicaid while the aggregate cost is frozen.
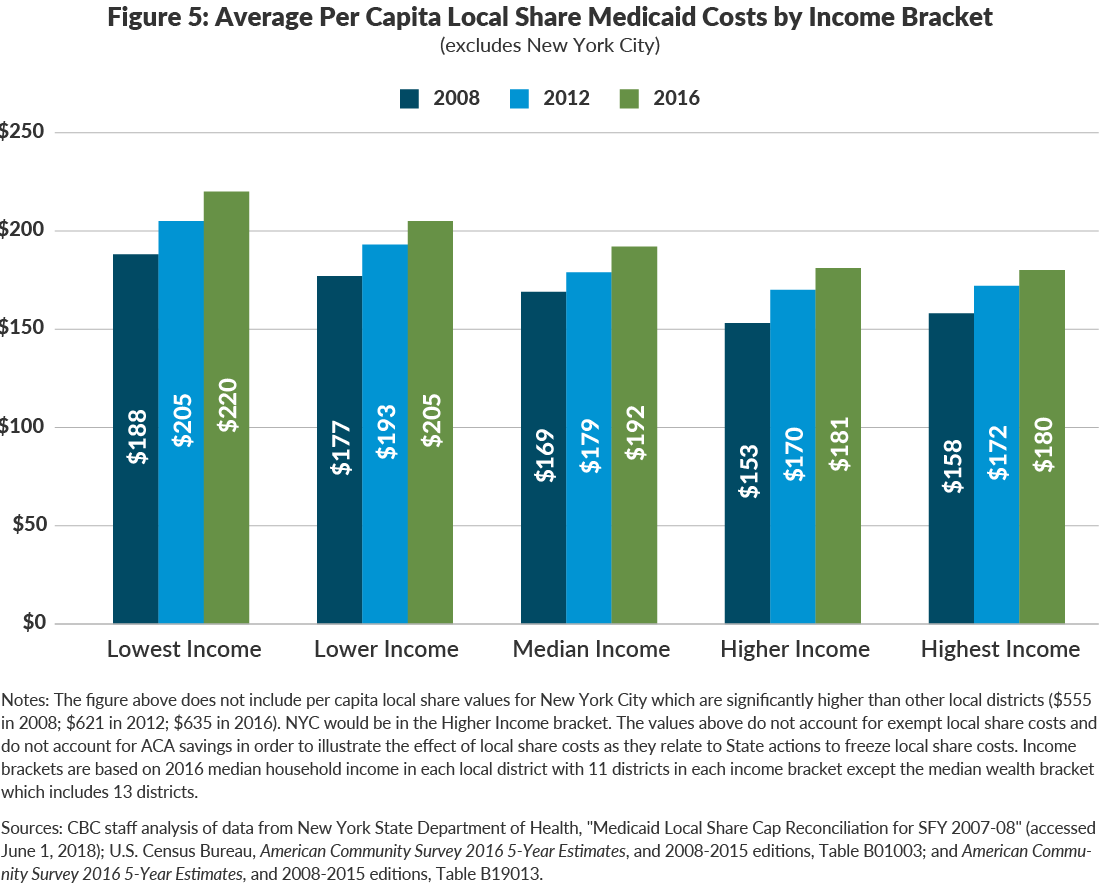
The Local Share is Still Regressive
Each local district’s Medicaid share is determined by the cost of serving enrollees residing in that local district prior to 2006. Local districts that had the largest low-income populations and associated Medicaid costs in 2006 have the largest per capita local share burden. These counties tend to remain poor 12 years later. This is an inequitable, regressive practice because the poorest counties have to accommodate the largest per capita Medicaid costs. As shown in Figure 5, in 2008 the per capita burden in the lowest income districts was 19 percent higher than that in the highest income districts; in 2016 the lowest income districts per capita cost was 22 percent greater than that in the highest income districts. Although the freeze will hold costs flat for local districts, it does not correct the persistent regressive nature of the local share.
More Work to be Done
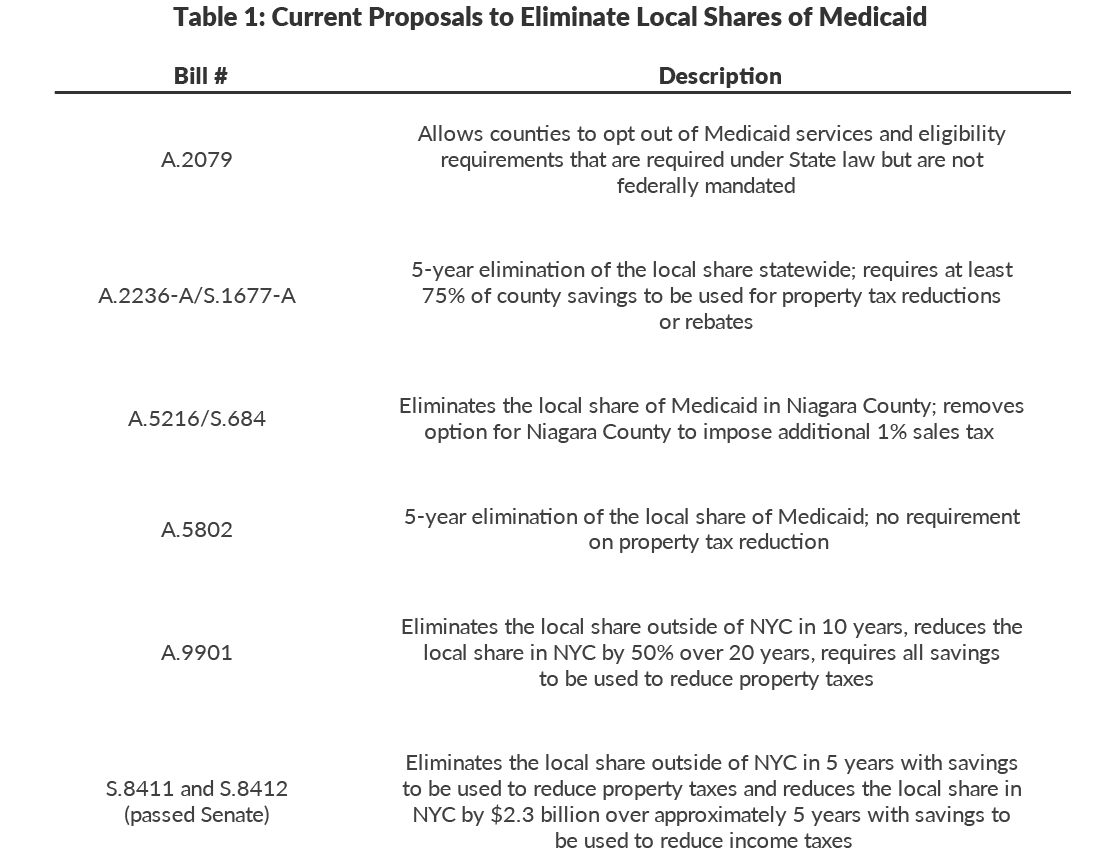
The local share still remains a priority for key stakeholders.23 Proposals have been introduced by several state legislators to require a state takeover of the local share.24 Table 1 summarizes the proposals introduced during the 2018 Legislative session.
The same issue that plagued Governor Carey’s proposal in 1981 persists decades later: cost. To absorb the local share of Medicaid would be a significant fiscal lift for the State. The cost of the current freeze already exceeds $3 billion per year and is increasing. A takeover would require the State to accommodate the remaining $7 billion of annual local costs. Table 2 below shows the approximate annual incremental cost to the State of taking over the local share under various timeframes. An immediate assumption requires nearly $7 billion; a 20-year phase in requires annual increments of $348 million.

A Menu of Options
The State’s options to finance the cost of a takeover each require reduced spending and/or increased revenues to provide the necessary funding. Four broad options are worthy of consideration. (See Table 3.)
Option #1: New State Revenue
If the State increases its expenses, it can keep financial balance by equally increasing revenues. This can be done with a new revenue source or an increase in an existing revenue source. For example, the State could increase the state sales tax rate by a factor equal to the cost of the local share takeover. Currently the state sales tax of 4 percent generates $15.1 billion in revenue. To raise $7 billion of additional revenue, the sales tax rate would have to be raised to 5.8 percent.25
This approach has two significant negative aspects. First, if not paired with a mechanism for reducing local taxes by an equal or greater amount, this option would be a tax hike on New Yorkers. Such mechanisms can be designed; notably a requirement for local districts to pass local share savings to residents via reduced local property or sales taxes.
Second, the sales tax base generally grows year-after-year. Whereas the local share cost is currently frozen, state sales tax receipts are projected to grow by nearly 4 percent annually over the next four years.26 If the new sales tax rate were not adjusted in future years, the new tax would outpace the cost of the takeover, representing a net cost for taxpayers.
On a positive side, this option would eliminate the cost from local district budgets and would undo the regressive nature of the local share. Sales tax receipts are generally higher in higher income counties.27 Thus an increase in the sales tax rate would generate more revenue from higher income counties, reversing the current structure which disproportionately burdens the lowest income counties.
Option #2: Sales Tax Intercept
The State could intercept a set portion of the sales tax receipts that local districts currently use as revenue for their budgets.28 This option is appealing because it would provide a reliable funding source for the state takeover and would not result in higher taxes. The effect on budgets would theoretically be neutral in the aggregate, shifting both the cost and the revenue from local districts to the State.29
The sales tax intercept could take one of two forms. One option would be to intercept receipts in direct proportion to a local district’s local Medicaid share. But this dollar-for-dollar swap would still regressively siphon money from those districts that bear a disproportionate share of the Medicaid burden now.
Another approach would be to intercept $7 billion from local districts statewide in proportion to the districts’ current sales tax receipts. In 2016 the 58 local districts reported $16 billion in sales tax receipts.30 The State could intercept $7 billion, or 43 percent of the current total. Each district’s intercept would be in proportion to its taxable sales; since higher income localities have greater sales volumes this would be less regressive than the current arrangement and shift some of the burden from lower to higher income localities.31
Option #3: Reduce State Expenditures thru Efficiencies
Another option is for the State to accommodate the additional cost of $7 billion within its financial plan using existing resources; that is, reduce planned expenditures by an equivalent amount. This is desirable if savings can be achieved without reducing services through efficiency measures; however, a sufficient scale of such savings may not be achievable in the short run.32 This fiscal year the State will spend approximately $100 billion for operating costs.33 Over the next three years, the New York State Division of the Budget projects deficits totaling $18 billion with an annual deficit equaling $7 billion in fiscal year 2022.34 It is unlikely the State can close its operating deficits and accommodate $7 billion in additional annual costs from a local share takeover. Doing so would likely require significant undesirable cuts to programs or a lengthy phase in of the takeover to achieve savings. While this option is difficult to implement, it would solve the problems caused by the current local share.
Option #4: Eliminate STAR
New York State has placed the local share obligation on local districts for 50 years, helping drive local tax burdens upward. For the last 20 years, the State has also administered a program to reduce local tax burdens using state funds, the School Tax Assessment Relief (STAR) program.35 This program’s goal is to lower the burden of local property taxes levied by school districts.36 STAR does this in an inequitable manner; it gives proportionally more aid to the wealthier districts than to poorer districts. Whereas the Medicaid local share places the highest burden on the lowest income counties, the STAR program provides the greatest benefit to the highest income counties, compounding inequity.37
The elimination of STAR would reduce state costs by $3.3 billion annually ($814 million in New York City and $2.5 billion in the rest of the state).38 Coupling the elimination of STAR with state takeover of the local Medicaid share would come short of financing the entire takeover, but together with achieving efficiencies in the operation of the program statewide, it would be an equitable, if partial, option.
The four options are not mutually exclusive. They could be combined – a proportional sales tax intercept, reduced operating expenses through efficiency, and the elimination of STAR could be combined in a feasible manner to eliminate the Medicaid local share in a relatively short time frame, for example.

The summary of takeover financing options presented in Table 3 highlights a major roadblock to implementation of a takeover: the impact of New York City’s local share. Dating back to the efforts of Governor Carey to eliminate the local share in 1981, the issue of New York City’s vastly greater local share served as a barrier to an agreement.39 Under any scenario New York City benefits significantly, while residents of other localities experience varying impacts from significant gains to losses. Residents in all jurisdictions benefit from the State financing the takeover through operating efficiencies. Eliminating STAR and using its resources to partially fund a takeover provides net gains to all jurisdictions except those in the wealthiest counties, but the gains are greatest for New York City. The other options provide more modest gains for New York City but impose a net cost on residents of the other counties. A combination of options using state efficiencies, elimination of STAR, and some sales tax intercept might yield a design that can gain widespread support.
Other Factors to Consider
Regardless of the method used to finance the takeover of the local share, new proposals require more detail in order to be actionable and comprehensive policy options. The recent proposals identified in Table 1 omit important details, and these factors should be addressed in future proposals:
- Regional uniformity – The disparity between the cost in New York City and the rest of the state has a significant impact on the ability of legislators to negotiate a full takeover. The takeover should be comprehensive covering the entire state, but the financing strategy may need to be tailored to accommodate the magnitude of the takeover costs in different regions.
- Programmatic uniformity – Approximately $1.3 billion of additional annual Medicaid costs are exempt from the local share freeze and paid by New York City ($1 billion) and various counties ($300 million). These costs, associated with supplemental Medicaid payments for public hospitals and nursing homes, are incurred only by local districts which choose to operate hospitals and/or nursing homes and are therefore reasonably excluded from the freeze. Takeover proposals need to include provisions for the continued exclusion of these additional payments from the takeover.
- The Medicaid Global Cap – Since 2011 the State has capped the growth of much of its State-funded Medicaid spending to help spur efficiency and innovation in the program. The State will likely have to exempt local takeover costs from the Medicaid Global Cap or exempt them in a way similar to other episodic costs such as the takeover of costs of Medicaid administration and costs associated with the minimum wage increases enacted in 2016.
- Local property and sales tax collections – A policy decision should be made about the extent to which state assumption of local Medicaid costs should result in lower local tax collections. A requirement could be placed on counties to reduce their property tax levies in concert with the local takeover. Consideration needs to be given to how the State would require county savings to be passed on to taxpayers. If there is a 1-to-1 reduction requirement on property tax levies (as in some legislative proposals ), then the elimination of the local share may be viewed less favorably by counties’ budget officials than if they have more discretion in the scale of property tax reductions. No recent proposals fully address the impact on county budgets.
- Elective local shares – In some rare cases, local governments may want to elect to provide a local share if doing so would allow them to enhance services. Some current examples of this include the Value Based Payment Quality Improvement Program (VBP QIP) and the Delivery System Reform Incentive Payment (DSRIP) program. Under each of these arrangements, local government entities supply a nonfederal share through intergovernmental transfer which allows them to participate in special initiatives. Flexibility should exist for such special circumstances if the local government desires.
Conclusion
New York State’s requirement of a $7 billion annual local Medicaid share is unique in a national context, but more importantly it is inequitable and inefficient in a state context. The mandate requires local districts to dedicate an average of 8.6 percent of their annual budgets to a State-implemented program over which the local districts do not have programmatic control. Furthermore, the local share is regressive, putting the highest cost burden on residents of the lowest income counties. Financing a comprehensive state takeover of the local share will be a large lift fiscally and politically. The state’s leaders deserve credit for capping growth and then freezing the local share in recent years, but locking in the local share cost also locks in its inequities. Fifty years after the initiation of the Medicaid local share, the arrangement remains a poor way to finance the program. The State should design a way to eliminate the mandated local share in a reasonable time period.
Download the Report
Download Still a Poor Way to Pay for MedicaidFootnotes
- Matthew Sollars, A Poor Way to Pay for Medicaid (Citizens Budget Commission, December 2011) https://cbcny.org/sites/default/files/media/files/A%20Poor%20Way%20to%20Pay%20for%20Medicaid.pdf.
- Social Security Amendments of 1965, P.L. 89-97, 79 Stat. 286.
- The federal government finances a portion of the cost of the Medicaid based on per capita income in each state. The rate of federal funding, the federal medical assistance percentage (FMAP), can be between 50 percent and 83 percent. New York is one of 14 states which receive the minimum FMAP of 50 percent, requiring nonfederal sources to finance the remaining 50 percent. The highest current FMAP in the nation is Mississippi’s at 76.39 percent. See: Alison Mitchell, Medicaid’s Federal Medical Assistance Percentage (FMAP), Report for Congress R43847 (Congressional Research Service, April 25, 2018).
- Chapter 256 of the Laws of 1966.
- Charles Brecher and Mina Addo, What Ails Medicaid in New York? (Citizens Budget Commission, May 20, 2016), https://cbcny.org/research/what-ails-medicaid-new-york-0.
- Robin Herman, “Medicaid Cost Takeover Voted by State Assembly,” The New York Times (April 2, 1981), p. B8, www.nytimes.com/1981/04/02/nyregion/medicaid-cost-takeover-voted-by-state-assembly.html.
- Robin Herman, “Medicaid Takeover at Heart of Carey-Anderson Impasse,” The New York Times (April 23, 1981), p. B14, www.nytimes.com/1981/04/23/nyregion/medicaid-takeover-at-heart-of-carey-anderson-impasse.html.
- Josh Barbanel, “Cuomo Gives Up Goal on Sharing Medicaid Costs,” The New York Times (May 20, 1983), p. 3, www.nytimes.com/1983/05/20/nyregion/cuomo-gives-up-goal-on-sharing-medicaid-costs.html.
- Luther Bliven, “Official Hoopla Planned for Medicaid Bill Signing,” Syracuse Post-Standard (August 2, 1983), p. D-4, https://newspaperarchive.com/syracuse-post-standard-aug-02-1983-p-28/.
- Deborah Bachrach and Mira S. Burghardt, Understanding the New State/County Paradigm: The 2005 New York State Medicaid Cap Legislation (United Hospital Fund, November 2006), p. 4, https://uhfnyc.org/publications/434594.
- New York State Division of the Budget, 2004-2005 Enacted Budget Report (September 14, 2004), p. 18, https://openbudget.ny.gov/historicalFP/fy0405archive/enactedBudgetReport0405.pdf.
- Average annual growth rate is based on statewide average for 1993 through 2003. See: Office of the New York State Comptroller, County Medicaid Costs: 2005 County by County Data (accessed July 31, 2018), www.osc.state.ny.us/localgov/pubs/research/medicaidtable.pdf.
- Unless otherwise noted the local share values in the remainder of this report include only those costs subject to the local share cap of 2005. Costs which are not subject to the cap include the local share of supplemental payments such as the Disproportionate Share Hospital (DSH) and Upper Payment Limit (UPL) programs. Current annual costs of the local share of Medicaid for uncapped expenses are approximately $1.3 billion, of which approximately $1 billion is paid by New York City for supplemental payments made to New York City Health + Hospitals and approximately $300 million for hospitals and nursing homes operated by counties. These values are based on CBC staff analysis of supplemental payment data from the New York State Department of Health, email to Citizens Budget Commission staff (March 31, 2017). Supplemental payments were not exempt from the local cap but were subsequently exempted via Section 29 of Chapter 161 of the Laws of 2005 and Section 60 of Part A of Chapter 57 of the Laws of 2006.
- Office of the New York State Comptroller, 2005 Annual Report on Local Governments (September 2005), p. 17, https://osc.state.ny.us/localgov/annualreport/05annreport.pdf.
- New York State Senate, S. 992 (2005-2006 Session).
- Additional allowable growth under the cap was calculated relative to the 2005 local share. For example, the growth rate for 2006 was 3.5 percent above the 2005 level, 2007 was 6.75 percent above the 2005 level, 2008 was 9.75 percent above the 2005 level, and 2009 was 12.75 percent above the 2005 level. See: Part C of Chapter 58 of the laws of 2005.
- An option was also created to allow local districts to avoid the local share in its entirety in exchange for a portion of its sales tax receipts. Monroe County was the only district to elect the sales tax intercept option, forfeiting approximately 40 percent of its sales tax receipts in exchange for its share for Medicaid. Monroe utilized this option through January 2013 in order to benefit from the State’s freeze of the local share enacted in 2012. See: Office of the New York State Comptroller, Local Government Sales Taxes: 2010 Update (April 2010), p. 14, www.osc.state.ny.us/localgov/pubs/research/salestax2010.pdf; and Nicole Gaudiano and Joseph Spector, “Controversial New York Measure Lands in GOP Heath Care Bill,” Democrat & Chronicle (March 21, 2017), www.democratandchronicle.com/story/news/2017/03/21/controversial-new-york-measure-lands-gop-health-care-bill/99438654/.
- See: Section 1 of Part F of Chapter 56 of the Laws of 2012.
- Local shares associated with supplemental payments remained excluded from the freeze.
- CBC staff analysis of data from the New York State Division of the Budget, email to Citizens Budget Commission staff (June 28, 2018); and Section 11 of Part A of Chapter 56 of the Laws of 2013.
- New York State Division of the Budget, FY 2019 Enacted Budget Financial Plan (May 2018), p. 92, www.budget.ny.gov/pubs/archive/fy19/enac/fy19enacFP.pdf.
- See: Dave Lucas, State and Federal Medicaid Financing Reforms Benefit County Taxpayers (New York State Association of Counties, June 5, 2018), https://issuu.com/nysac/docs/nysac_news_spring-summer_2018_-_fin.
- The New York State Association of Counties named the local share as a priority issue in March 2018, noting in articular the importance of the maintenance of ACA savings for local districts. See: New York State Association of Counties, State Takeover of Local Medicaid Costs (February 2018), www.nysac.org/files/Budget%20Priority%20-%20Medicaid%20Takeover.pdf.
- Language was also included in Congressional health reform proposals which were not enacted during 2017. The proposed language would have required New York to eliminate the local share outside of New York City or federal aid would be reduced. See: U.S. House of Representatives, “Faso-Collins Language to Cut New York Property Taxes Included in Senate Health Bill Draft” (June 22, 2017), https://faso.house.gov/news/documentsingle.aspx?DocumentID=392.
- [i] New York State Division of the Budget, FY 2019 Enacted Budget Financial Plan (May 2018), p. 77, www.budget.ny.gov/pubs/archive/fy19/enac/fy19enacFP.pdf.
- New York State Division of the Budget, FY 2019 Enacted Budget Financial Plan (May 2018), p. 77, www.budget.ny.gov/pubs/archive/fy19/enac/fy19enacFP.pdf.
- For example, 32 percent of state sales tax collections are from the highest income counties which pay just 14 percent of statewide local Medicaid costs. County-level state sales tax values are based on CBC staff analysis of data from New York State Department of Taxation and Finance, “Taxable Sales And Purchases Quarterly Data: Beginning Sales Tax Year 2013-2014” (May 1, 2018), https://data.ny.gov/Government-Finance/Taxable-Sales-And-Purchases-Quarterly-Data-Beginni/ny73-2j3u.
- A sales tax intercept option was granted to counties with the initial local share cap legislation enacted in 2005. At the time of its enactment, estimates suggested that only four counties were likely to benefit from the intercept option. Only Monroe County elected the sales tax intercept option, and the county estimates the decision saved $30 million over the five-year period it was implemented. See: Office of the New York State Comptroller, Decision 2007: Counties and the Medicaid Choice (July 2007), p. 1, www.osc.state.ny.us/localgov/pubs/research/medicaidchoice.pdf; and David Riley, “What is County Executive Maggie Brooks’ Legacy?” Democrat & Chronicle (December 28, 2015), www.democratandchronicle.com/story/news/2015/10/10/what-county-executive-maggie-brooks-legacy/73152824/.
- Authorizing statute would also have to ensure that local sales tax distributions to local governments within each county are not impacted by this intercept.
- CBC staff analysis of data from Office of the New York State Comptroller, “Local Government Data Search” (accessed July 20, 2018), http://wwe2.osc.state.ny.us/transparency/LocalGov/LocalGovIntro.cfm.
- For further analysis of the impacts of a local sales tax intercept see: Bill Hammond, Parsing a NY Medicaid Takeover (Empire Center, March 21, 2017), www.empirecenter.org/publications/impact-of-medicaid-takeover-would-vary/.
- For further analysis of state takeover options via Medicaid Global Cap reform see: Bill Hammond, Shifting Shares: The Costly Challenge of a State Medicaid Takeover (Empire Center, July 2018), pp. 10-12, www.empirecenter.org/wp-content/uploads/2018/07/ShiftingShares.pdf.
- New York State Division of the Budget, FY 2019 Enacted Budget Financial Plan (May 2018), p. 7, www.budget.ny.gov/pubs/archive/fy19/enac/fy19enacFP.pdf.
- New York State Division of the Budget, FY 2019 Enacted Budget Financial Plan (May 2018), p. 10, www.budget.ny.gov/pubs/archive/fy19/enac/fy19enacFP.pdf.
- Section 425 of the Real Property Tax Law.
- Governor Cuomo proposed freezing the growth of STAR in the fiscal year 2019 budget, citing fiscal and programmatic justifications. See: New York State Division of the Budget, FY 2019 New York State Executive Budget Revenue Article VII Legislation Memorandum In Support (January 2018), p. 4, www.budget.ny.gov/pubs/archive/fy19/exec/fy19artVIIs/REVENUE-ArticleVII-MS.pdf.
- See: David Friedfel, A Better Foundation Aid Formula (Citizens Budget Commission, December 12, 2016), https://cbcny.org/research/better-foundation-aid-formula.
- CBC staff analysis of data from New York State Education Department, Fiscal Analysis & Research Unit, Masterfile for 2015-16 (accessed July 20, 2018), www.oms.nysed.gov/faru/Profiles/profiles_cover.html.
- Robin Herman, “Anderson Tells Carey Why G.O.P. Opposes Takeover of Medicaid Costs,” The New York Times (April 5, 1981), p. 34, www.nytimes.com/1981/04/05/nyregion/anderson-tells-carey-why-gop-opposes-takeover-of-medicaid-costs.html.