Strategies to Boost Housing Production in the New York City Metropolitan Area
EXECUTIVE SUMMARY
As the New York region looks to rebuild its economy and restore confidence in the wake of the Covid-19 pandemic, policymakers have an opportunity to address many of the region’s longstanding challenges. One of these should be the sluggish rate of housing production. Policies that increase the supply and diversity of housing will have economic and social benefits and should be part of any strategy to help rebuild a more affordable New York City.
Despite perceptions that New York City experienced a building boom in recent years, New York City issued fewer permits for new housing units this decade (206,000) than in the 2000s. In fact, the annualized growth rate of the city’s housing stock has remained relatively constant since the 1990s despite accelerating job and population growth.
In addition, New York City issued fewer housing unit permits on a per capita basis than nearly every other large city, including not only fast-growing Seattle and Austin, but also cities that face similar constraints to development. New York issued permits for 40 percent fewer units per capita than San Francisco, half as many as Boston, and nearly two-thirds less than Washington, D.C. New York also lags on other metrics like the net change in the number of housing units.
Housing growth was sluggish despite a record-setting rate of job creation during the recovery from the Great Recession. Between 2010 and 2018 the number of jobs in New York City increased 22 percent, while the housing stock increased only 4 percent, resulting in only 0.19 housing units being added for every net new job created over the last decade – a wider gulf between job and housing growth than any city except San Francisco. The result is increasing household sizes, higher rates of overcrowding, persistently low vacancy rates, and a rapidly declining number of housing units that are affordable to low- and moderate-income households. An inadequate supply of housing has contributed to increased competition for scarce housing resources.
A small number of city neighborhoods have accommodated most of the housing growth while other neighborhoods—and suburban regions outside the city—had permitting rates that would rank among the lowest in the country. Since 2010 10 of the city’s 59 community districts accounted for nearly half of the new residential permits, and one-third took place in five neighborhoods—the far west side of Manhattan, Downtown Brooklyn, Williamsburg/Greenpoint, Long Island City, and Astoria—that were rezoned for growth in the mid-2000s. In many other neighborhoods, ranging from the Upper East Side and Upper West Side to single family neighborhoods in eastern Queens, the number of housing units has declined in recent years, as the combining of multiple units into single units outpaced the addition of newly built units.
Making matters worse, regional counties like Westchester, Rockland, Nassau, and Suffolk have some of the lowest housing production rates in the country. The downstate suburbs issued permits for substantially less housing than suburban communities in northern New Jersey, Connecticut, or in the suburban regions of Boston, Washington, and the Bay Area. Residents of Long Island and Westchester are also the most likely of any residents in the New York region to be rent-burdened.
New York’s low housing production is the product of decades of policy choices made by City and State officials– some deliberate, others unintended– that have slowed the pace of new construction in many neighborhoods. As a result, the supply of housing has not been able to keep pace with growing demand.
The City’s planning actions and zoning code have limited the city’s ability to grow and adapt, and have resulted in:
- The prevalence of low-density zoning districts throughout the city. Sixty percent of residential lots fall into the lowest density zoning categories; 12 percent allow no more than single family homes.
- A shortage of as-of-right development sites: Only 20 percent of residentially zoned lots are potential development sites based on their existing density levels; of those, nearly half allow no more than single family homes, duplexes, or small multifamily buildings, with 10 or fewer units.
- Uneven distribution of already-limited zoning capacity: Downzonings, contextual rezonings, and the continued extensions of historic districts have slowed the pace of development in many neighborhoods with strong demand for new housing. The reductions in zoning capacity in these neighborhoods has nearly offset the increased capacity in upzoned neighborhoods, and development trends have followed this pattern. The slowing pace of rezonings to promote growth, particularly for market-rate development in high-income neighborhoods, portends a supply crunch as neighborhoods rezoned in mid-2000s are increasingly built out.
- Leftover lots. Many potential development sites in neighborhoods zoned for dense development are too small or oddly shaped to develop without additional lot assembly or zoning lot mergers.
In addition, other policies and laws unique to New York City and State have contributed to slowing growth, including:
- Land and construction costs that are among the highest of major global cities;
- Construction and building codes that have failed to keep pace with modern construction methods and innovations;
- State law’s cap on floor area ratio, which arbitrarily limits density in an already land-constrained city;
- Laws about construction liability unique to New York that increase costs by as much as 7 percent;
- A lack of State policies to promote housing production in suburban communities; and
- A distortionary, opaque, and inequitable property tax system that taxes multifamily buildings at a higher rate than comparable owner-occupied housing and relies on a costly and inefficient property tax incentives to stimulate new development.
The Citizens Budget Commission (CBC) makes six recommendations to increase the supply of housing:
City Actions
1. Plan for Growth with a Comprehensive, Citywide Housing Strategy
Following the example of peer cities that build more housing, New York City should have a citywide housing plan that quantifies the city’s current and future housing needs at all market segments, identifies the gap between these needs and existing zoning capacity, and sets ambitious but achievable citywide production goals, including by market segment. The plan should be the product of a comprehensive housing needs assessment and include milestones and zoning actions the City needs to take to implement the strategy.
2. Zone for Growth by Updating the Zoning Code to Increase Capacity
The uneven distribution of development sites, coupled with the preponderance of low-density zoning, will make it difficult to boost housing production without rezonings that increase opportunities for as-of-right development throughout the city. A citywide approach would also avoid the contentious, expensive, and time-consuming neighborhood-by-neighborhood rezoning strategy, in which some neighborhoods make room for new development while others maintain zoning rules that block growth. This approach could leverage multiple strategies to increase production, such as: increasing density near transit and along commercial corridors; modifications to contextual zoning districts to allow for incremental growth and development; limitations on the use of historic district designations to limit as-of-right development; and regulatory changes to make it easier to build three-plus unit buildings as-of-right in all zoning districts citywide.
3. Modernize Outdated Building Code Provisions
The City should continue to revise outdated or unique code requirements that increase costs and adopt strategies to encourage construction industry innovation. In addition, the City should continue to reduce parking requirements in areas with access to mass transit to reduce construction costs and encourage ridership.
State Actions
1. Pass Laws to Encourage Municipalities to Zone for Growth
State lawmakers possess considerable, though rarely exercised, power over laws that allow local governments to establish zoning and land use regulations. State governments in New Jersey, California, Oregon, and elsewhere have passed laws to combat restrictive zoning ordinances and to require local governments to zone for different types of housing. New York State lawmakers could require municipalities to zone for both more housing and a wider variety of housing, including accessory dwelling units and multifamily residences, particularly in areas near commuter rail stations.
2. Reform Laws that Disincentivize Housing Production
Some New York State laws increase the cost to build new housing. Examples include the Scaffold Law, which mandates an absolute liability standard for construction insurance; the cap on floor area ratio; the Multiple Dwelling Law, which makes many small multifamily buildings less economically feasible than single-family homes; and the recently amended rent stabilization laws, which apply to many market-rate units built in middle-income neighborhoods under the Affordable New York tax incentive program, commonly referred to as 421-a.
3. Enact Property Tax Reform
State lawmakers should pass reforms to make the City’s property tax system more equitable and efficient. Comprehensive tax reform should include provisions to reduce the high tax rate on multifamily rental buildings relative to single family homes and other owner-occupied units. This would reduce the tax burden on renters and allow lawmakers to reform tax incentive programs like 421-a to make them more efficient and better targeted.
Neither the private nor the public sector will be able to solve New York’s housing crisis on its own, especially for the lowest income New Yorkers. However, the path to a housing market that meets the demands of residents needs a concerted effort to boost housing production. While the current economic crisis may slow construction activity in the near term, acting now to increase production will set the stage for and catalyze a more competitive and equitable housing market as the economy recovers. The strategies identified in this report represent a dramatic but necessary change in the State’s and City’s approaches to development. Building more housing for every type of household can help make the New York region more affordable and competitive for generations to come.
INTRODUCTION
New York City’s approach to planning and development has proven insufficient to meet its housing needs. As New York’s housing market moved from a crisis of abandonment in the late 20th century to a crisis of affordability in the 21st century, its housing supply failed to keep pace with the growing demand for housing. The result has been increasing household sizes, higher rates of overcrowding, persistently low vacancy rates, and a rapidly declining number of housing units that are affordable to low- and moderate-income households.
The consequences of New York City’s sluggish housing production rate became magnified in the wake of the Great Recession. As the city’s economy recovered and added jobs at a record pace, the housing market failed to recover along with it. New York City issued fewer permits for new housing units in the 2010s than it did in the 2000s, and despite a national trend towards urbanization, New York City issued permits for fewer new units than nearly every large city on a per capita basis. The downstate New York suburbs fared even worse in comparison to other suburban areas.
This report is divided into three sections. The first surveys data on housing production and job growth in New York City and the surrounding suburban counties; compares New York’s housing permitting activity during the 2010s to other large cities; and breaks down permitting activity and housing growth rates by neighborhood within New York City. The second section identifies several reasons for New York’s lagging housing production, including the limited and uneven distribution of zoning capacity among neighborhoods within New York City; policy choices that contribute to New York City’s high development costs; and the negative effects of New York’s distortionary, opaque, and inequitable property tax system on new development. The final section proposes actions that New York City and State lawmakers can take to boost production.
Adopting these policies will not solve all New York’s housing problems. State and local governments will need to establish clear, rational ground rules for development and efficiently subsidize the production and preservation of affordable housing. The federal government should adequately fund its housing subsidy programs, which benefit the New Yorkers most likely to be burdened by high housing costs. And the economic crisis brought on by the Covid-19 pandemic will place additional pressures on renters, homeowners, and multifamily owners without additional actions to stabilize the economy.
The path to a housing market that meets the demands of residents, however, will need a concerted effort to boost housing production. Policies that increase the supply and diversity of housing will have economic and social benefits and should be part of any strategy to help rebuild a more affordable New York City.
NEW YORK CITY AND REGION’S LAGGING HOUSING PRODUCTION
Why Housing Production Matters
An adequate supply of housing is needed to ensure that a housing market keeps pace with the demand produced by population increases and job growth. A growing body of research, however, has found that increasing housing production has benefits that go beyond the laws of supply and demand.
An adequate supply of housing allows for residents to move as their economic and social circumstances change; for young people to enter or stay in communities as they begin to form households; for older residents to remain in neighborhoods or downsize as they age; and for cities remain open to newcomers.1 It also helps keep the housing market competitive: studies have shown that new construction can restrain price appreciation at the neighborhood level and ensure that home prices and rent growth remain in line with household incomes.2 Building housing, including affordable housing, close to good schools and job centers is critical to implementing the City’s fair housing plan, while housing in areas well served by public transportation is needed to help meet the city’s sustainability goals.3
New York’s Underproduction
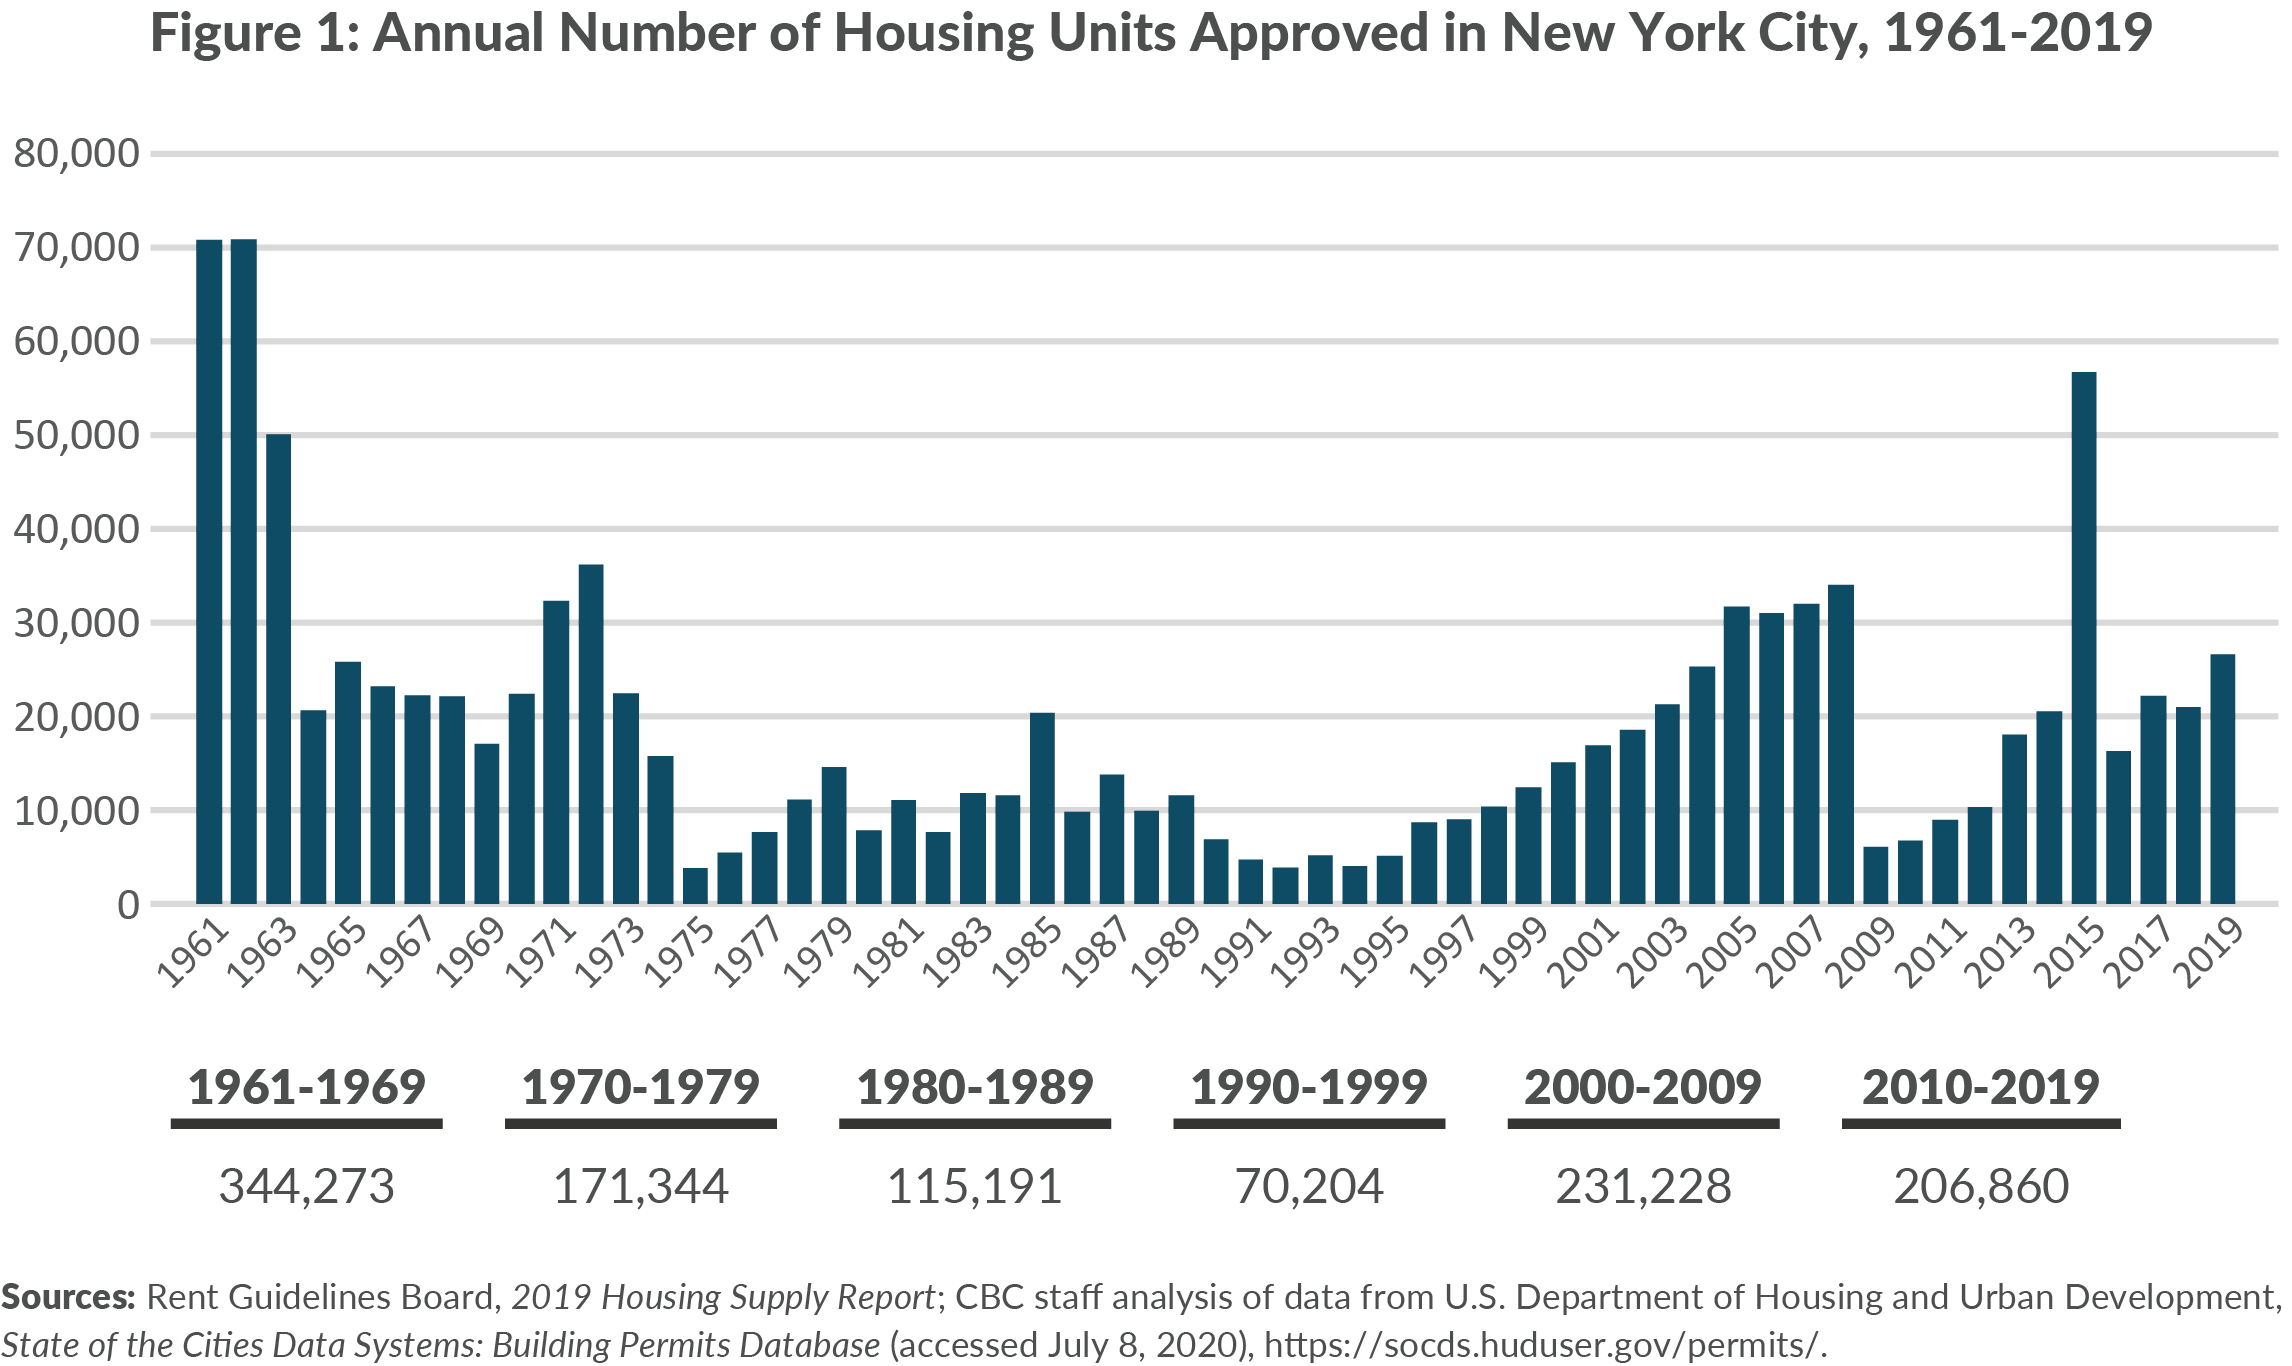
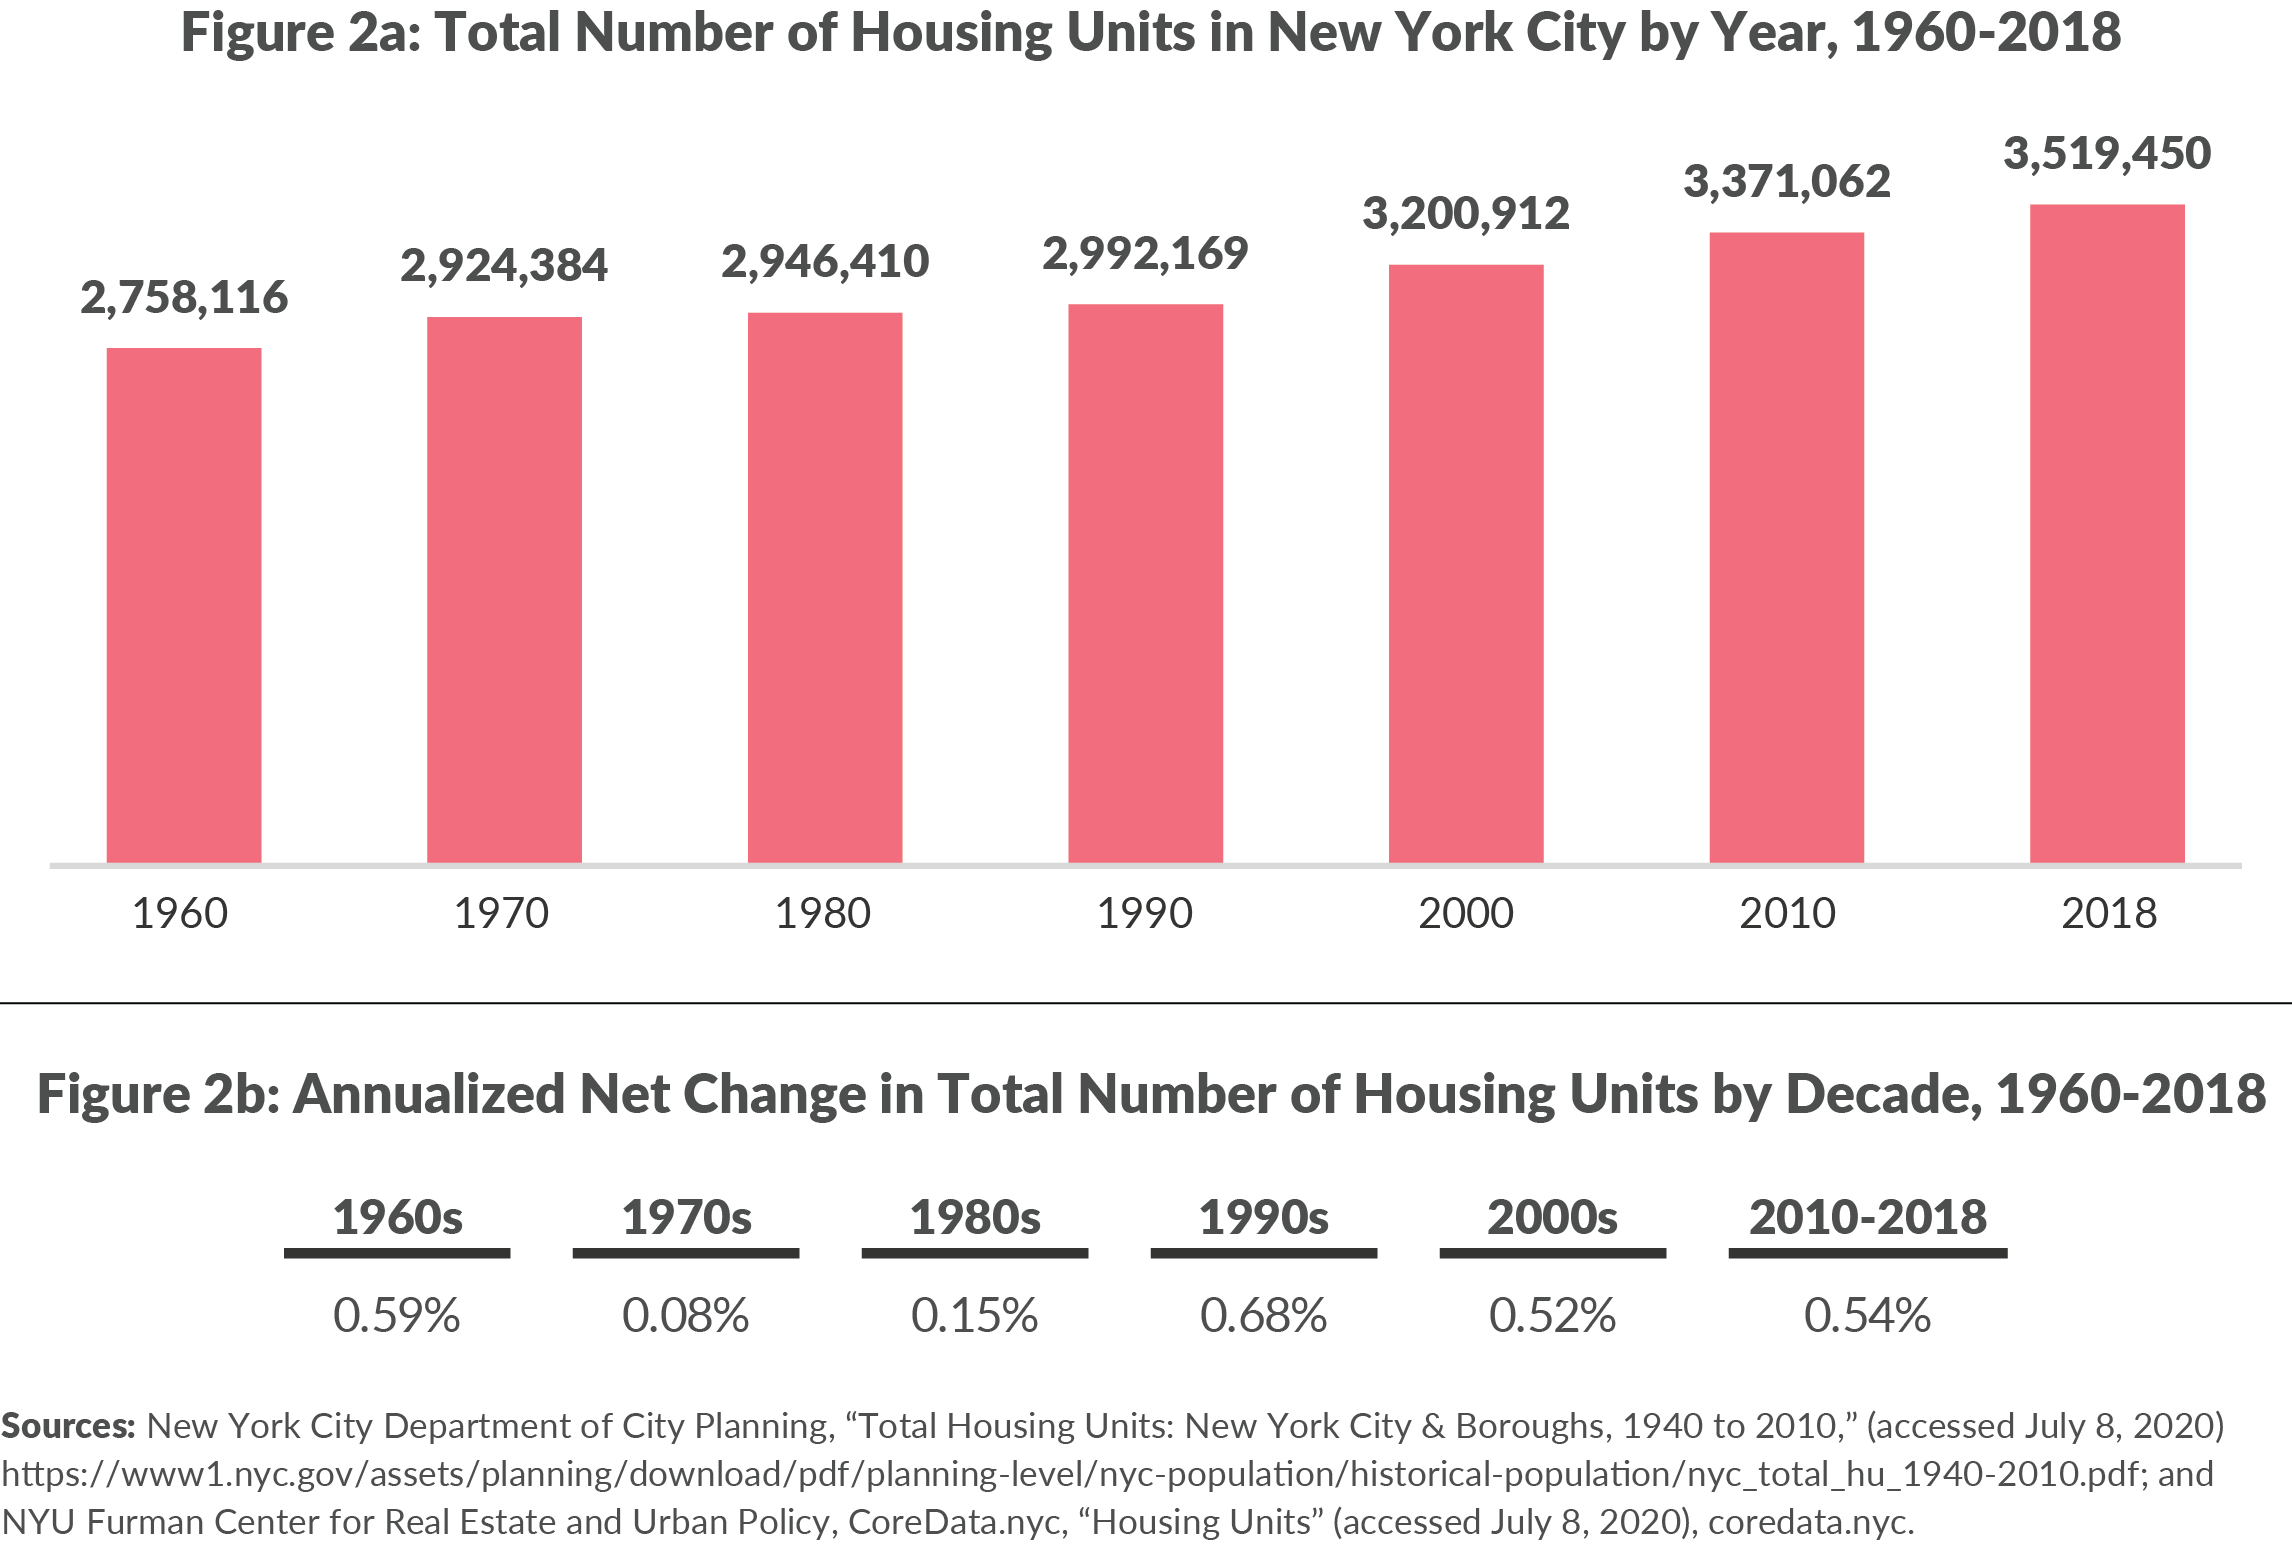
Over the last decade, New York City issued building permits for 206,860 housing units. (See Figure 1.) This is greater than the number issued in the 1980s and 1990s when the housing market focused on reversing years of abandonment but remains well below the levels of the 1960s and earlier decades. In fact, permitting levels have declined since the 2000s, when 231,228 permits were issued.4 The annualized rate at which the city’s housing stock grows has not changed meaningfully since the 1960s and has remained steady at 0.5 percent to 0.6 percent since the 1990s. (Net changes in supply account for a variety of changes to a neighborhood’s housing stock, including completions, demolitions, alterations, and other changes to the housing stock. See Figure 2.)
The consequences of low production were muted when New York City was losing population. As New York City moved from a crisis of abandonment and disinvestment to one of growing demand, however, housing supply struggled to meet the increased demand, particularly during New York City’s rapid economic growth following the Great Recession.
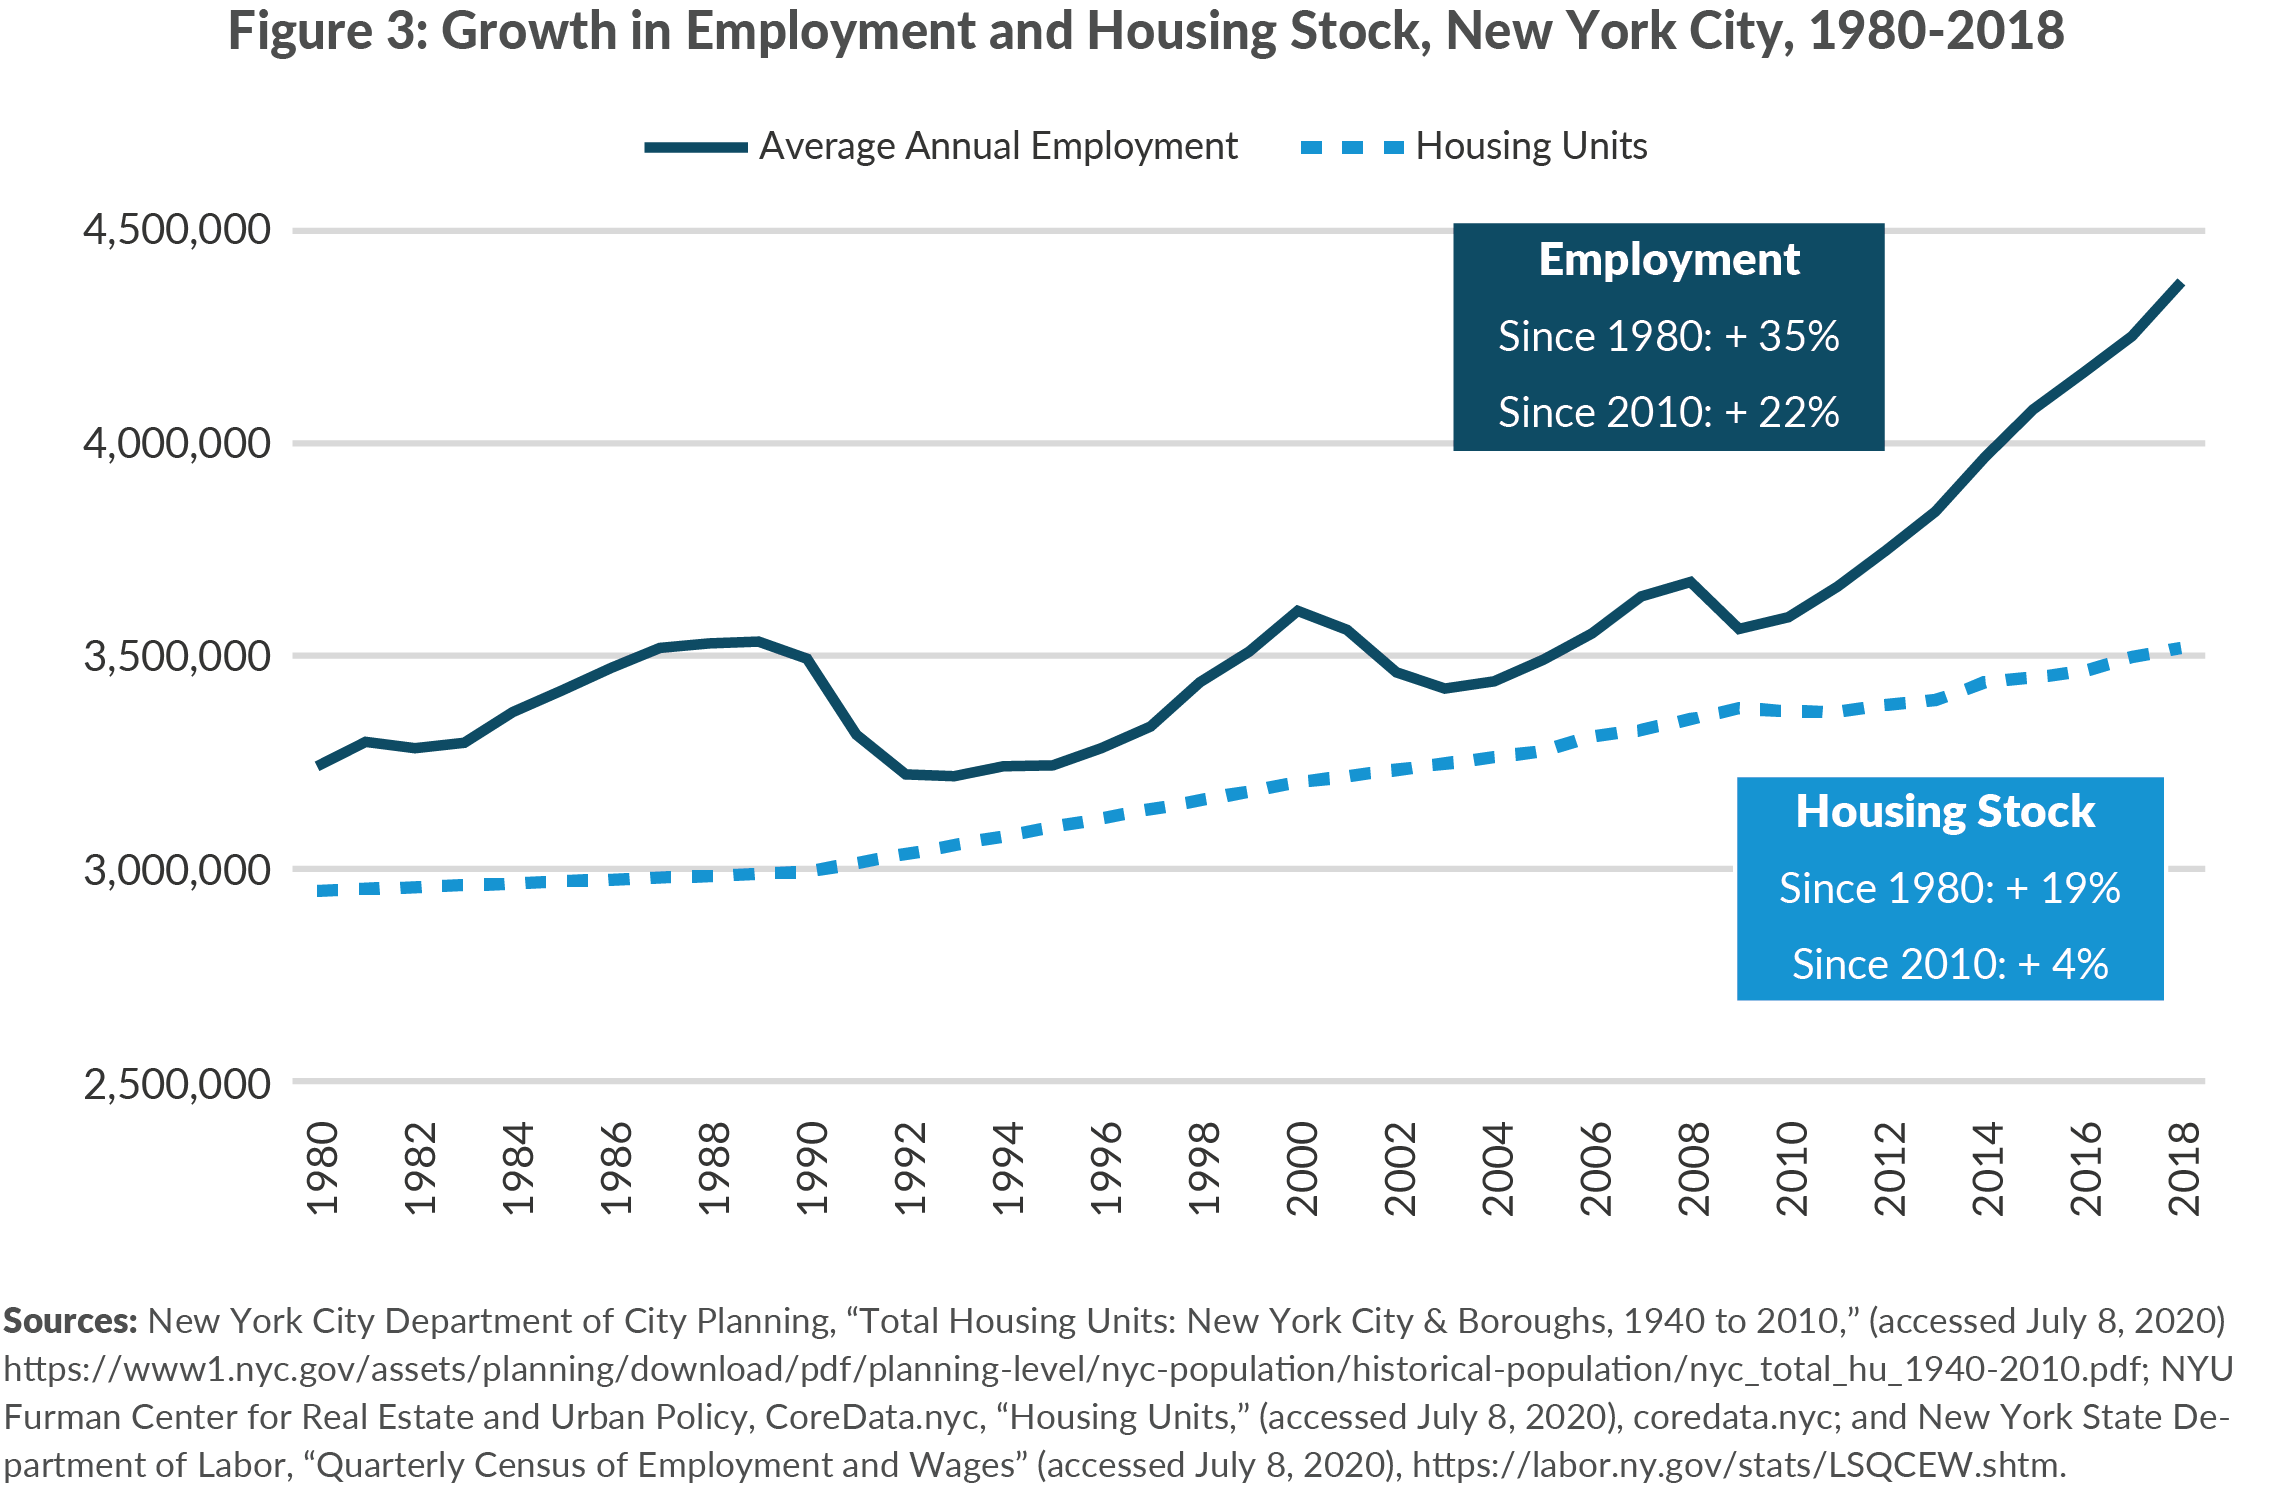
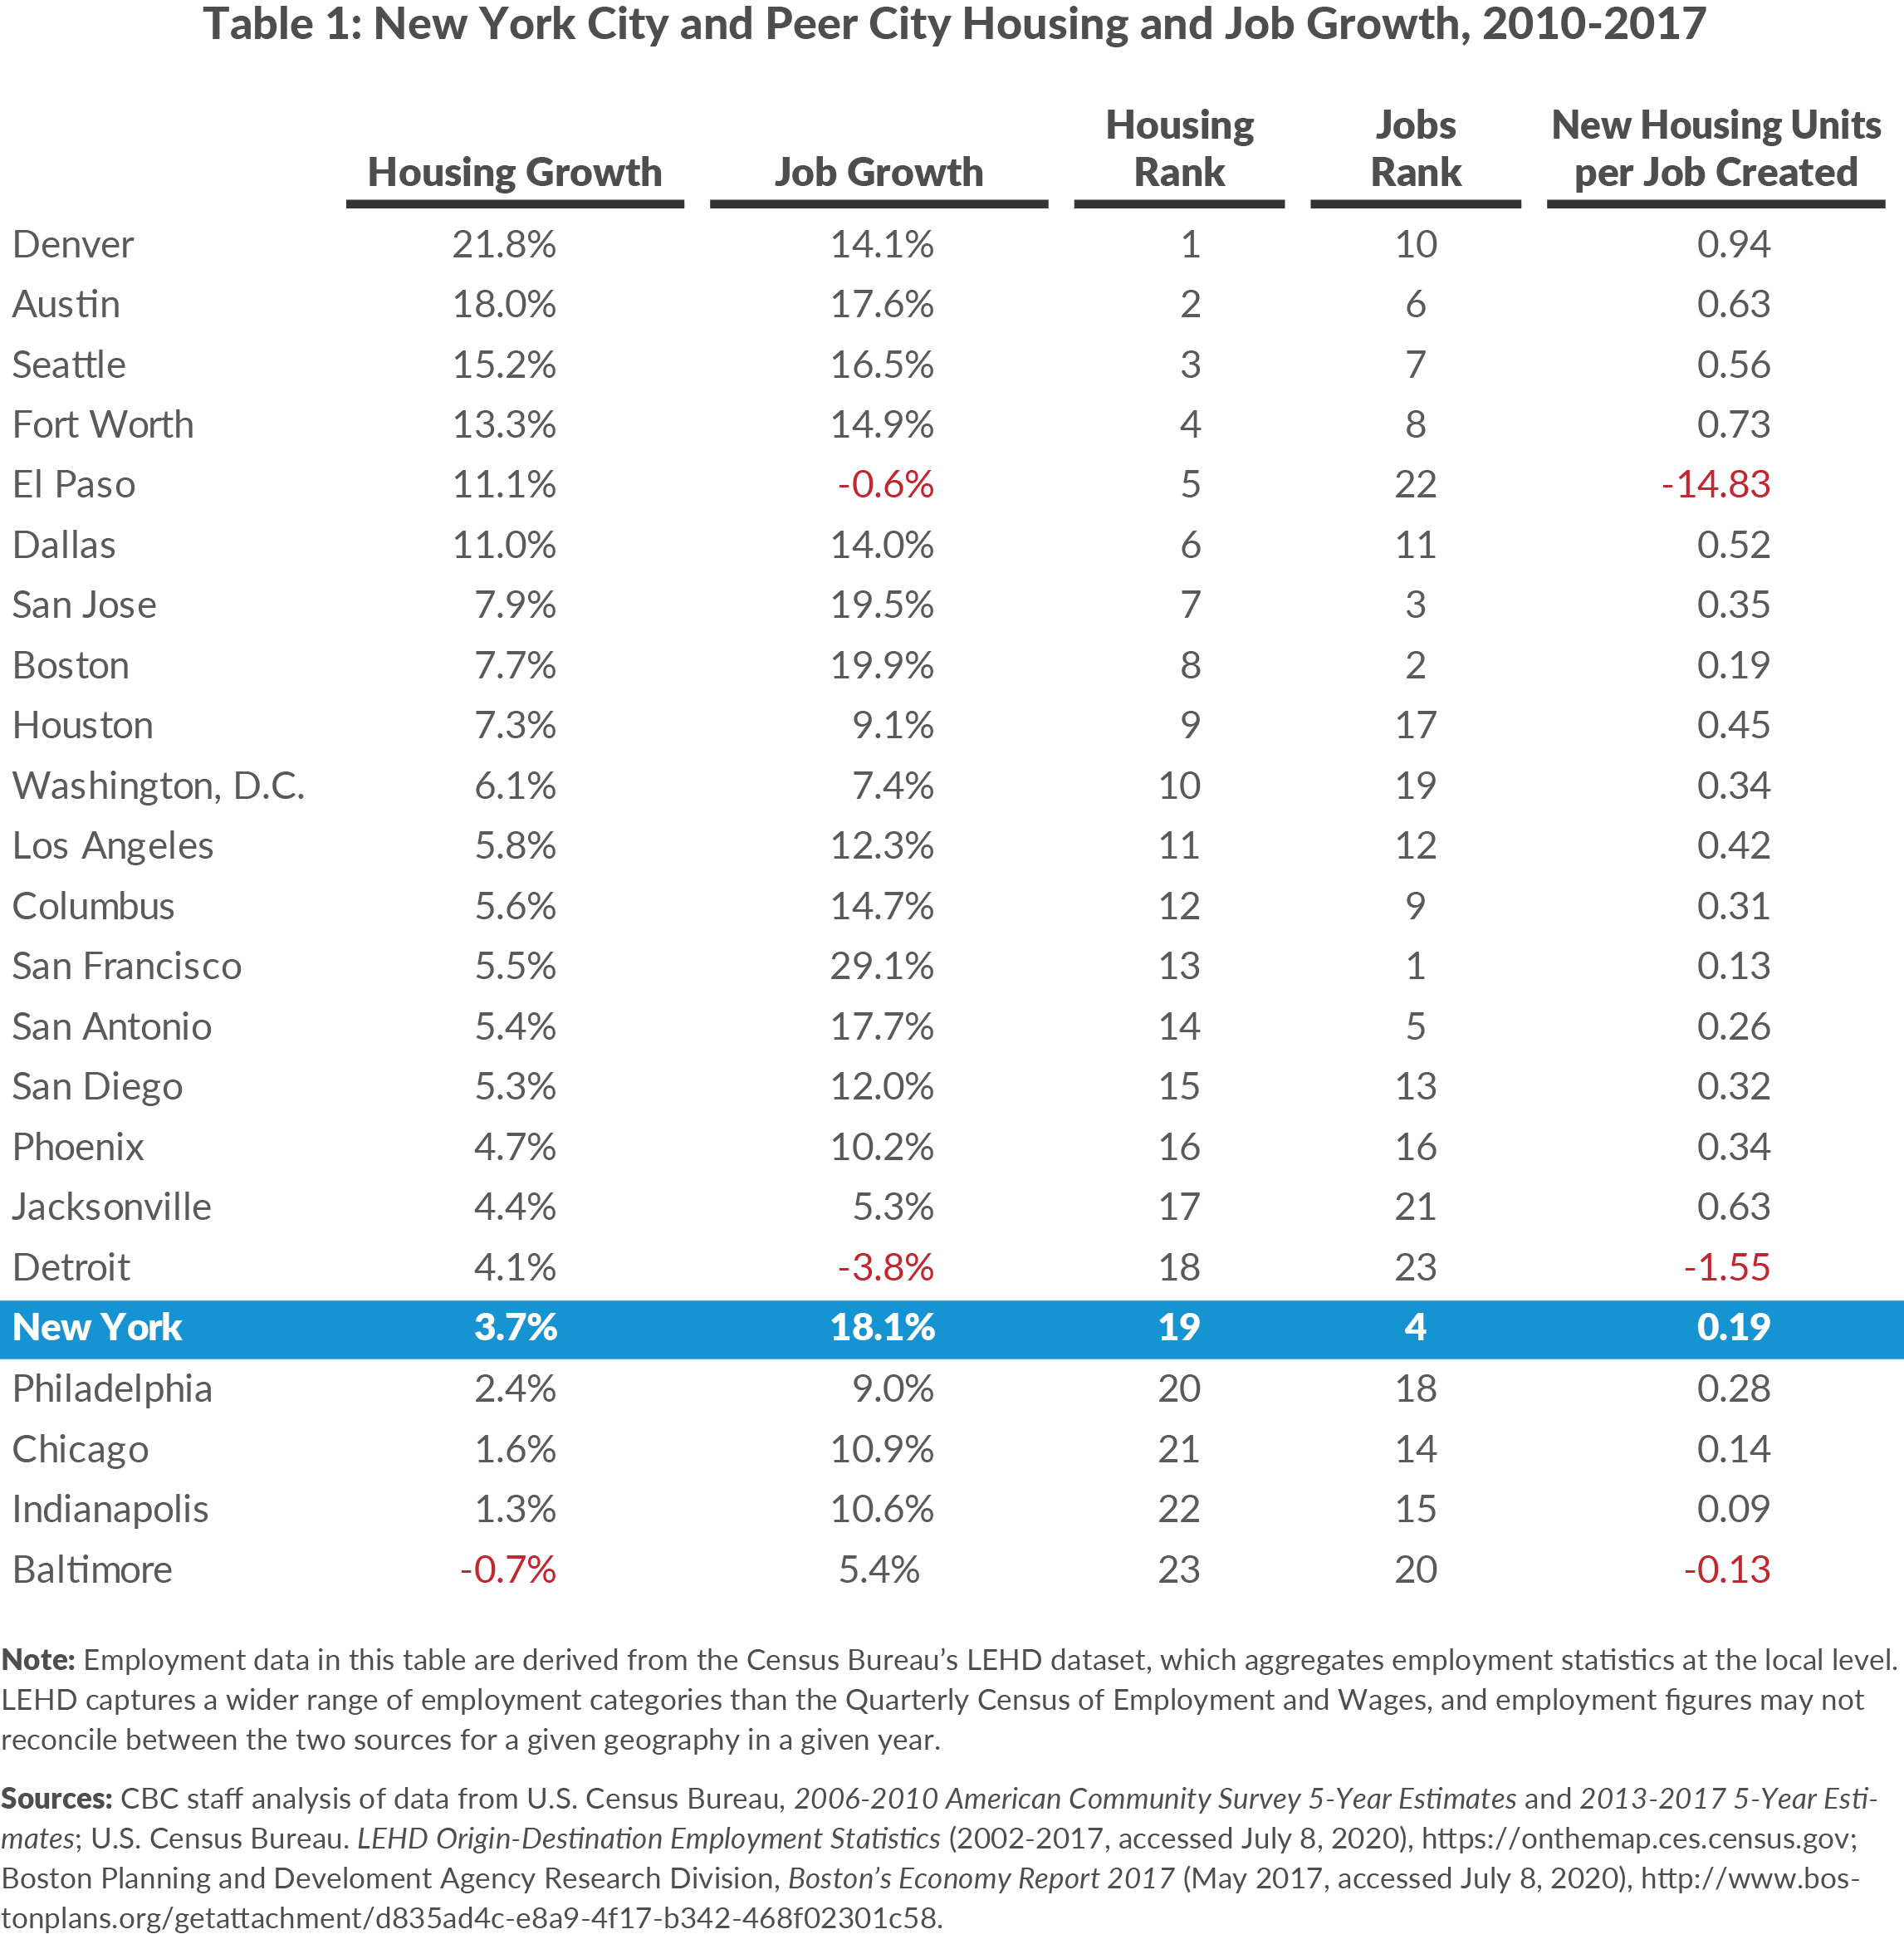
Between 2010 and 2018 New York City’s job base increased 22 percent, while its housing stock increased only 4 percent, resulting in the addition of only 0.19 housing units for every new job created this decade. (See Figure 3.) An inadequate supply of housing has contributed to increased competition for scarce housing resources that has resulted in increasing household sizes, higher rates of overcrowding, persistently low vacancy rates, and a rapidly declining number of housing units that are affordable to low- and moderate-income households.5
New York’s Housing Production Falls Short of Growth in Peer Cities and Regions
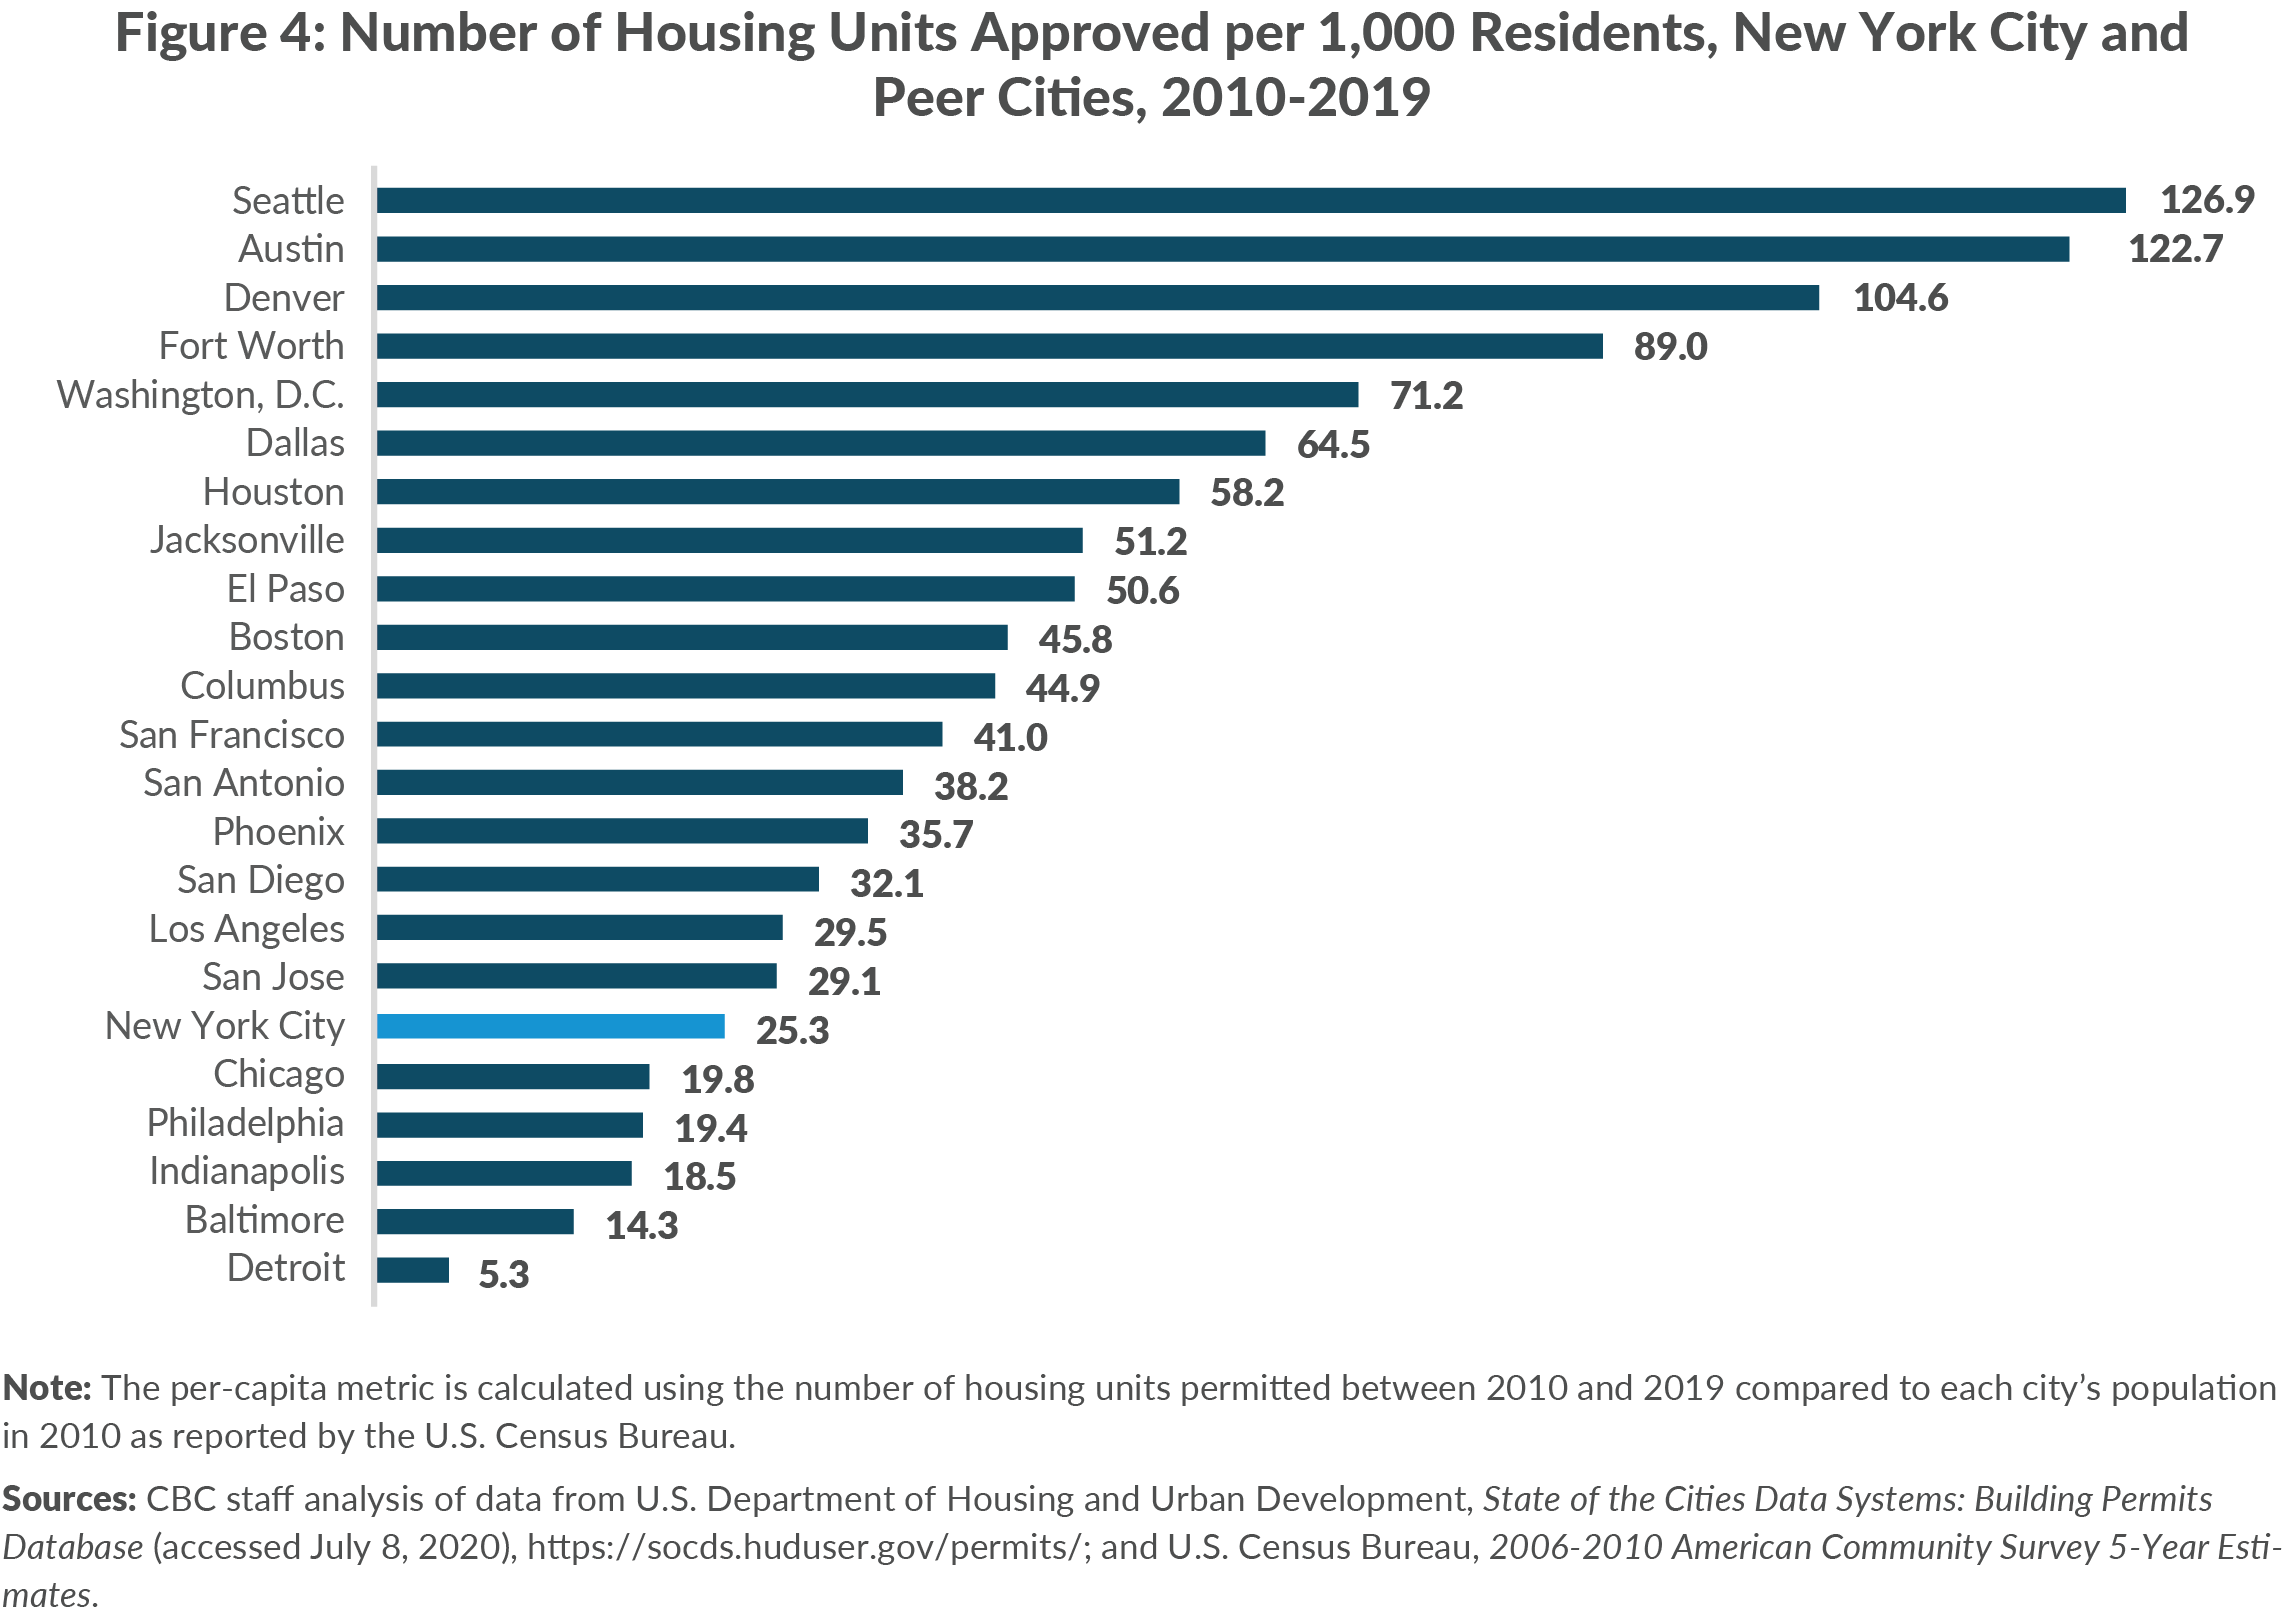
Over the last decade substantially less housing was built in New York City per resident than in other large cities. New York City issued building permits at the rate of 25 units per 1,000 residents (based on the 2010 Census) over the period of 2010 to 2019, the last year for which final data is available.6 This lags the permitting rate not only of fast growing cities like Seattle (127 units per 1,000 residents) and Austin (123), but also already-dense cities like Washington, D.C. (71), Boston (46), and San Francisco (41) that face constraints similar to New York City’s. (See Figure 4 and see Appendix A for more detail on the challenges of measuring housing production.)
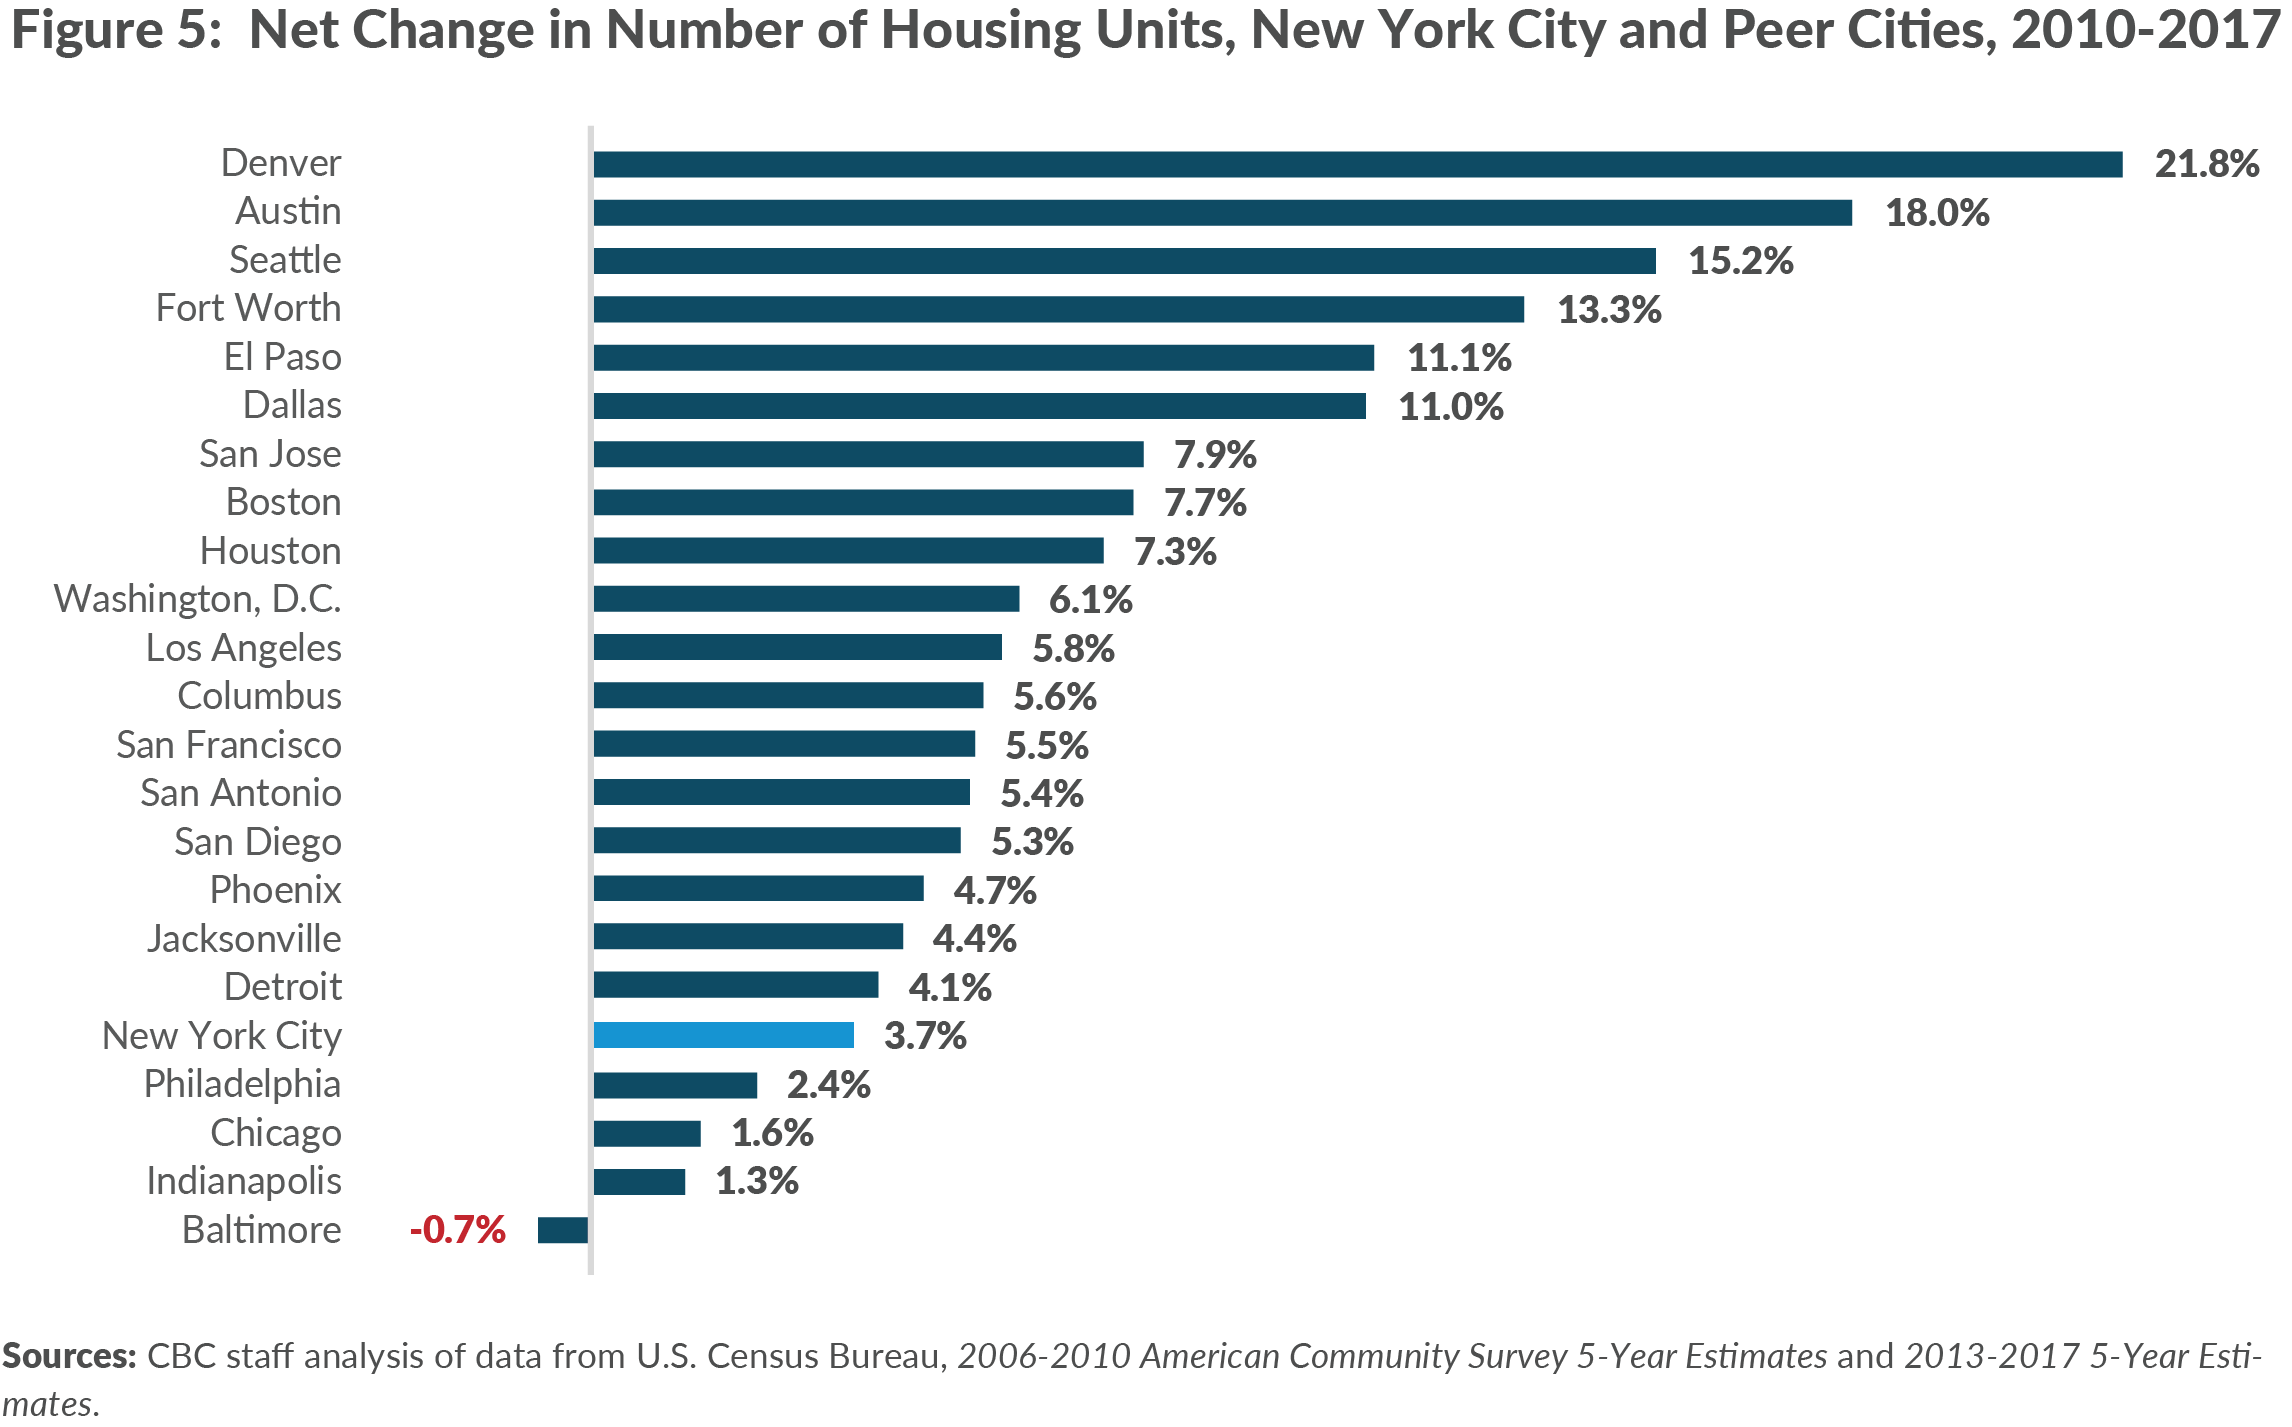
New York also lags its peer cities on other metrics of housing production, including net change in supply. Between 2010 and 2017 the number of housing units in New York City increased 3.7 percent, which ranks 20th among its peer cities. (See Figure 5.)
New York City’s sluggish housing growth also comes despite comparatively high job growth. Since 2010, New York’s job growth rate ranks 4th among large cities, but its housing growth rate ranks 19th. The other cities with comparable rates of job growth all added housing at much faster rates than New York City, while the cities with housing growth rates similar to New York’s all had below-average rates of job growth.
Uneven Housing Production in New York City’s Neighborhoods
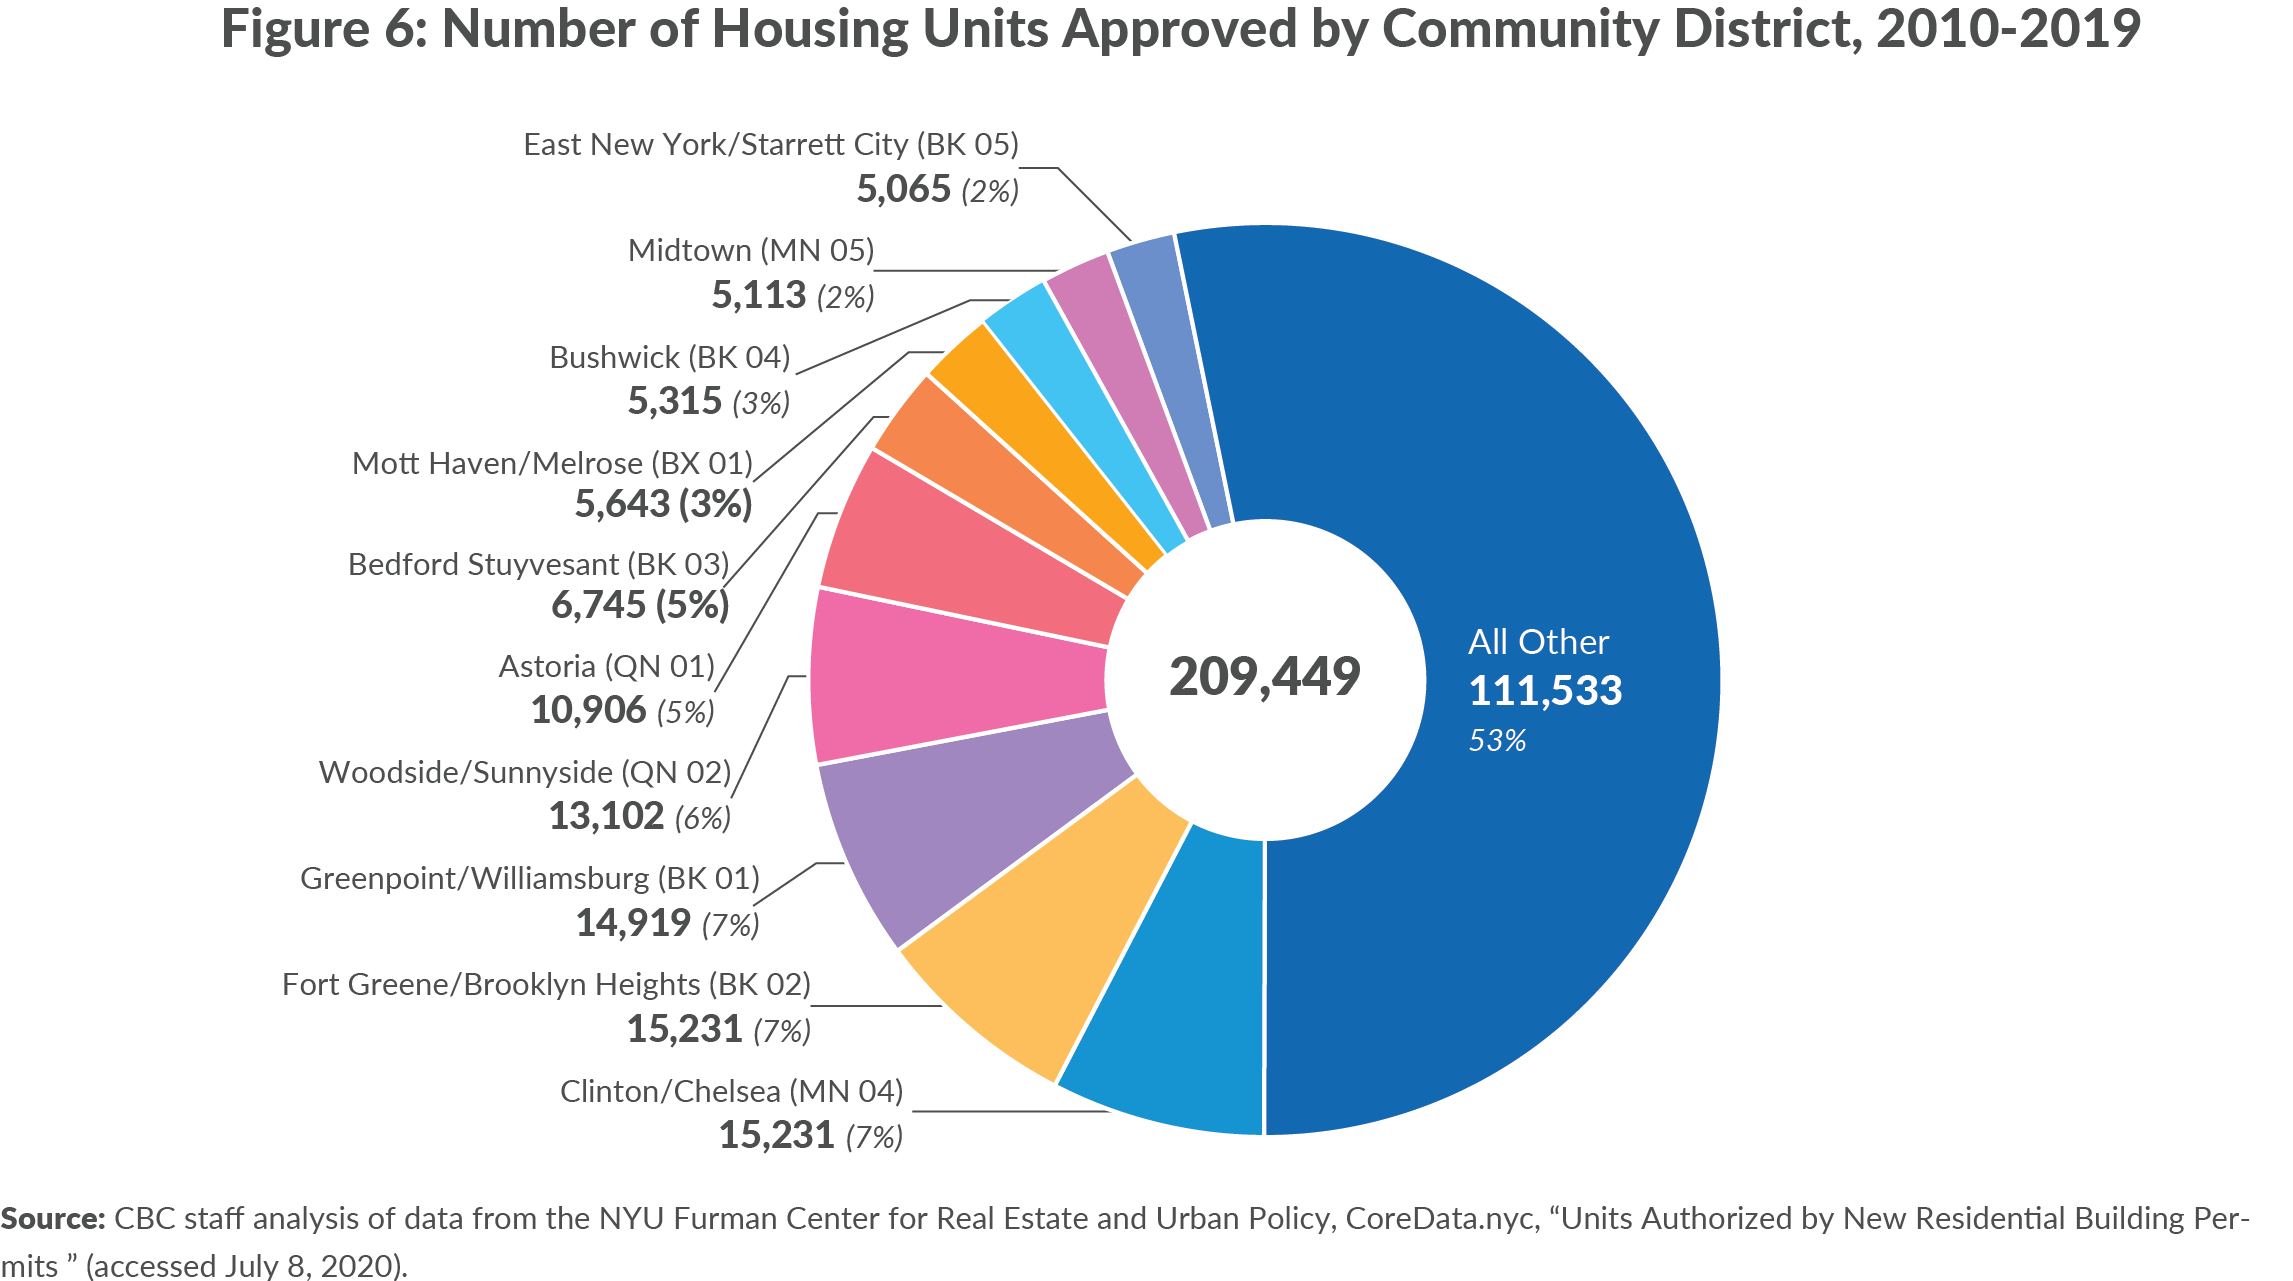
One reason for lagging housing production is most of growth in New York City has been concentrated in a small number of neighborhoods. Figure 6 shows that 10 of the city’s 59 community districts accounted for nearly half of the new housing units permitted since 2010, and that one-third took place in five neighborhoods: the far west side of Manhattan, Downtown Brooklyn, Williamsburg/Greenpoint, Long Island City, and Astoria. Portions of each of the top five neighborhoods’ community districts were rezoned in the early 2000s to allow for the redevelopment of underutilized commercial and manufacturing districts.7 These neighborhoods had housing production rates that rivaled the fastest growing cities in the country.
Many of the other neighborhoods where significant development activity occurred were those that already were zoned for multi-family development and had viable development sites, such as Midtown Manhattan, Bedford-Stuyvesant, and Bushwick. Other neighborhoods like East New York, Morrisania, and Mott Haven have been the focus of mayoral affordable housing plans under both the Bloomberg and de Blasio Administrations.
By contrast, housing production rates in much of the rest of the city rank among the lowest in the country. In many neighborhoods, including most of southern Brooklyn and eastern Queens, less new housing per capita was built over the last decade than in Detroit.
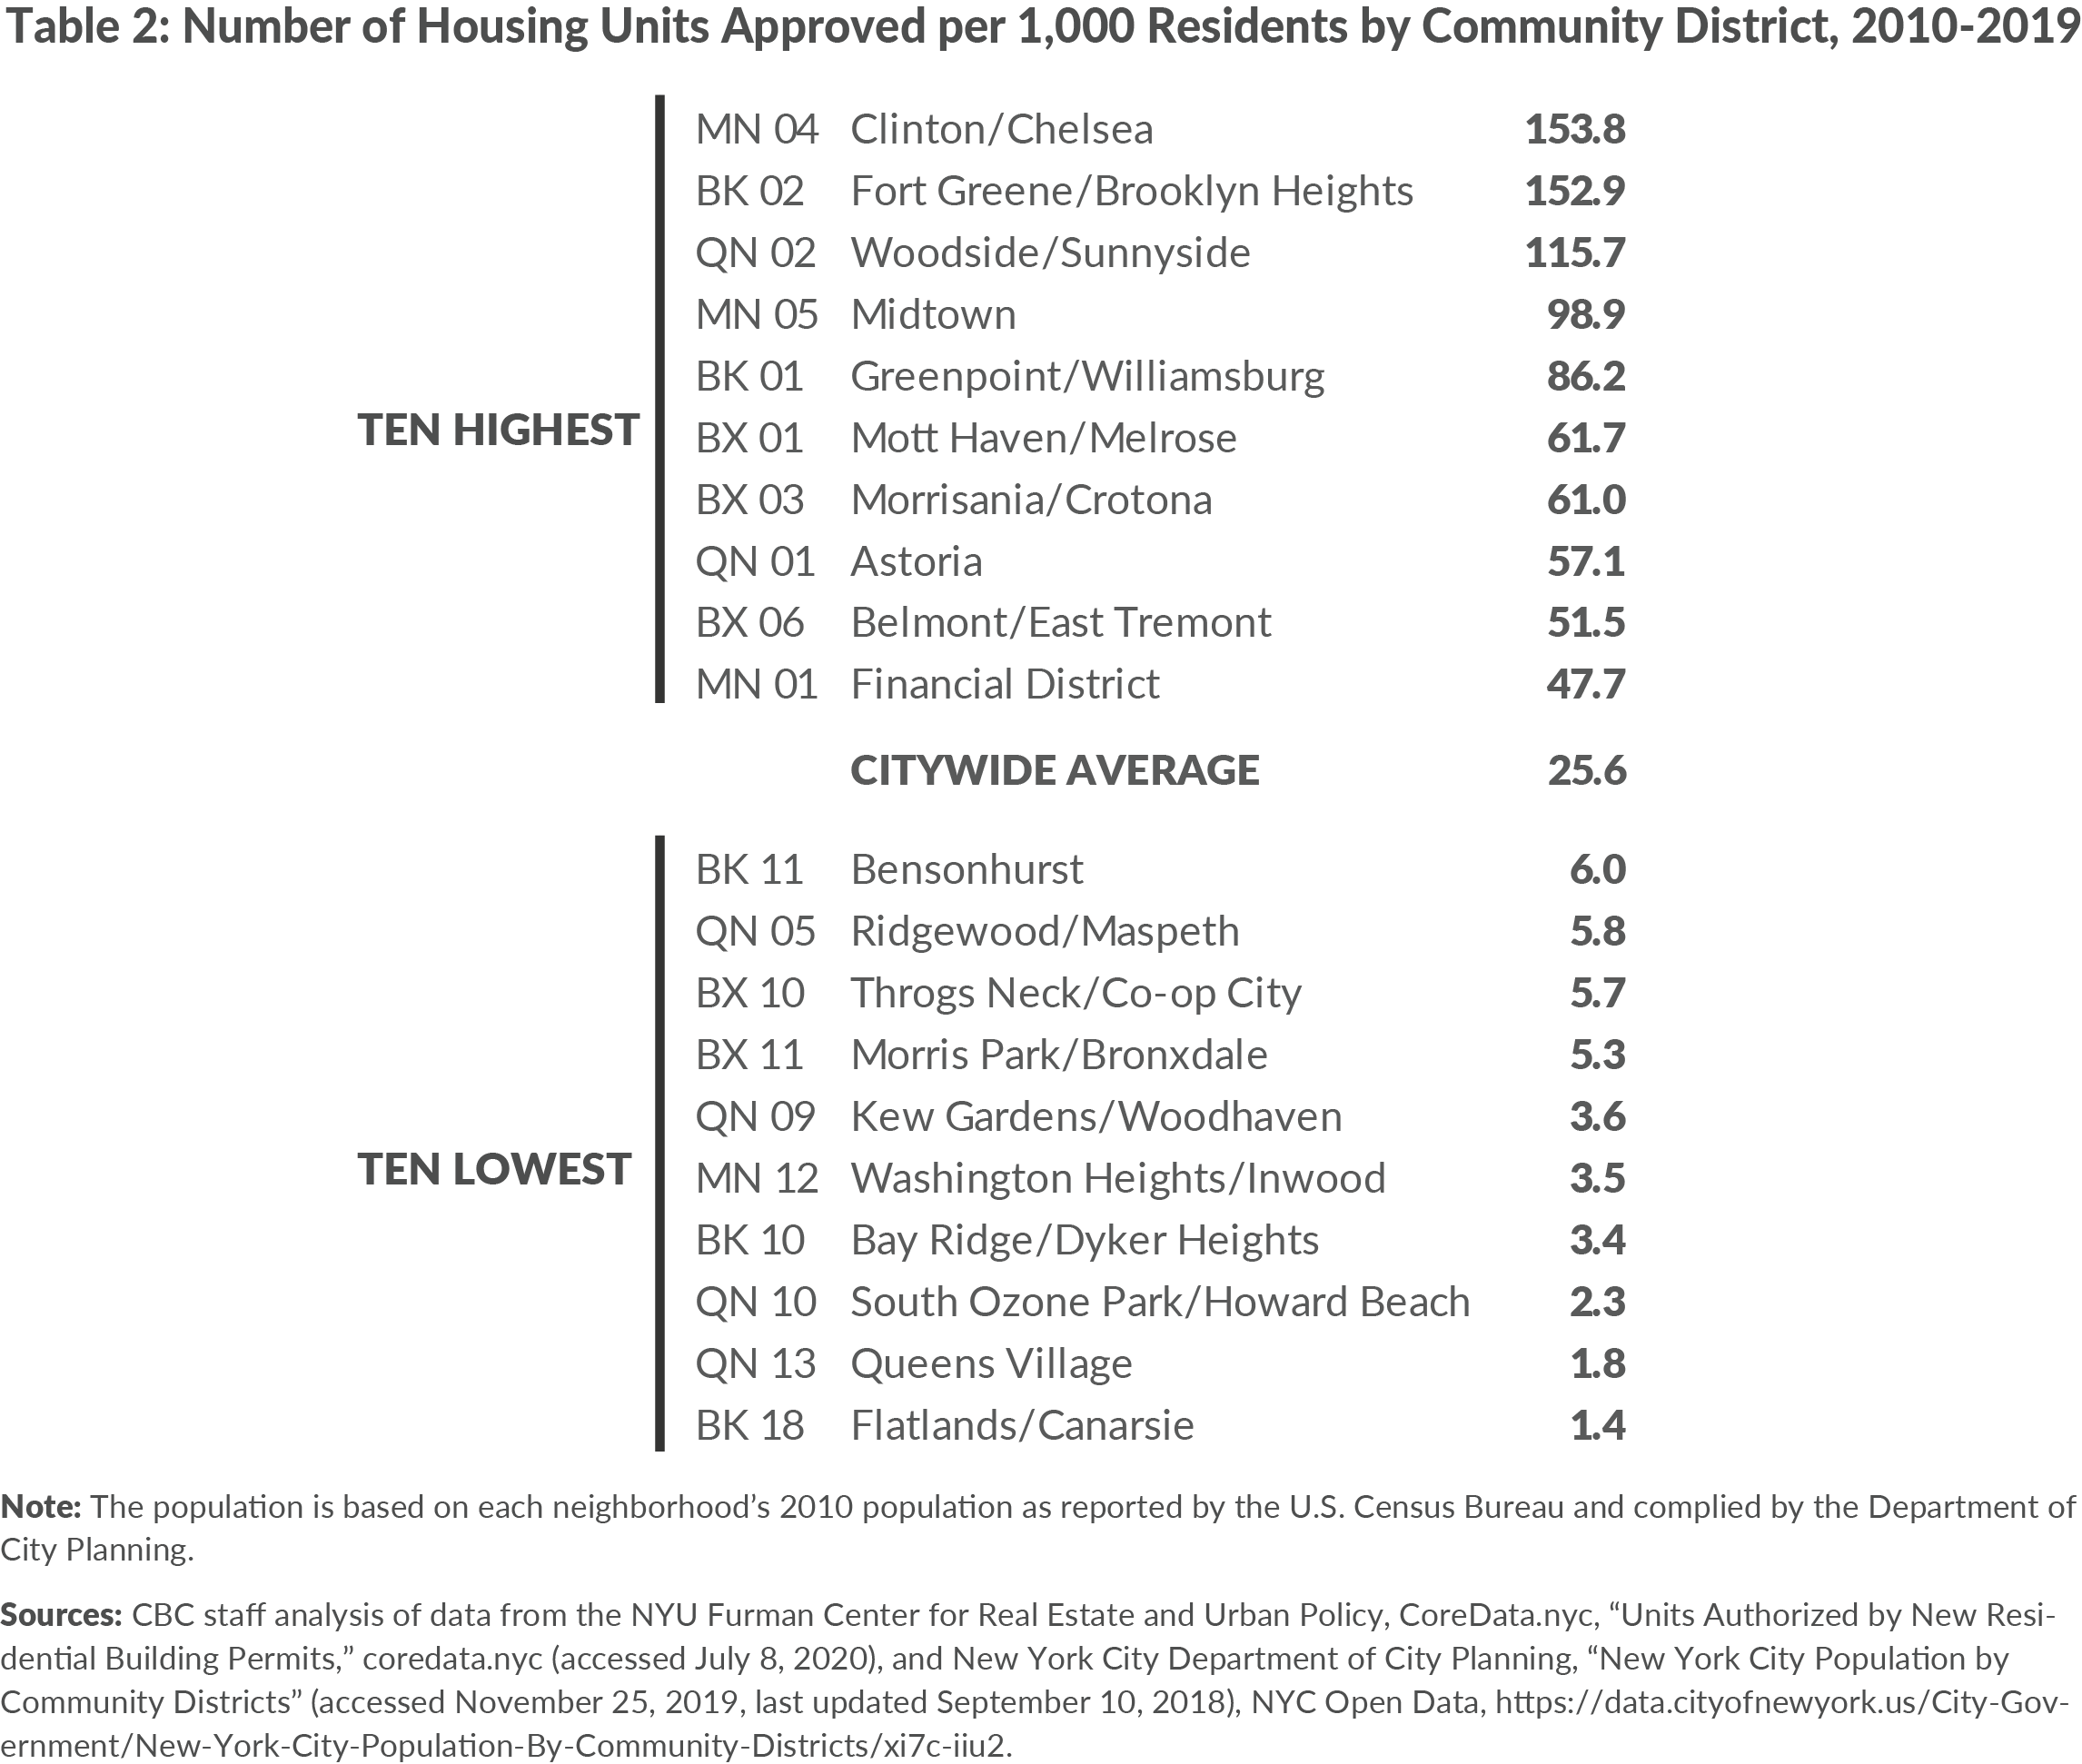
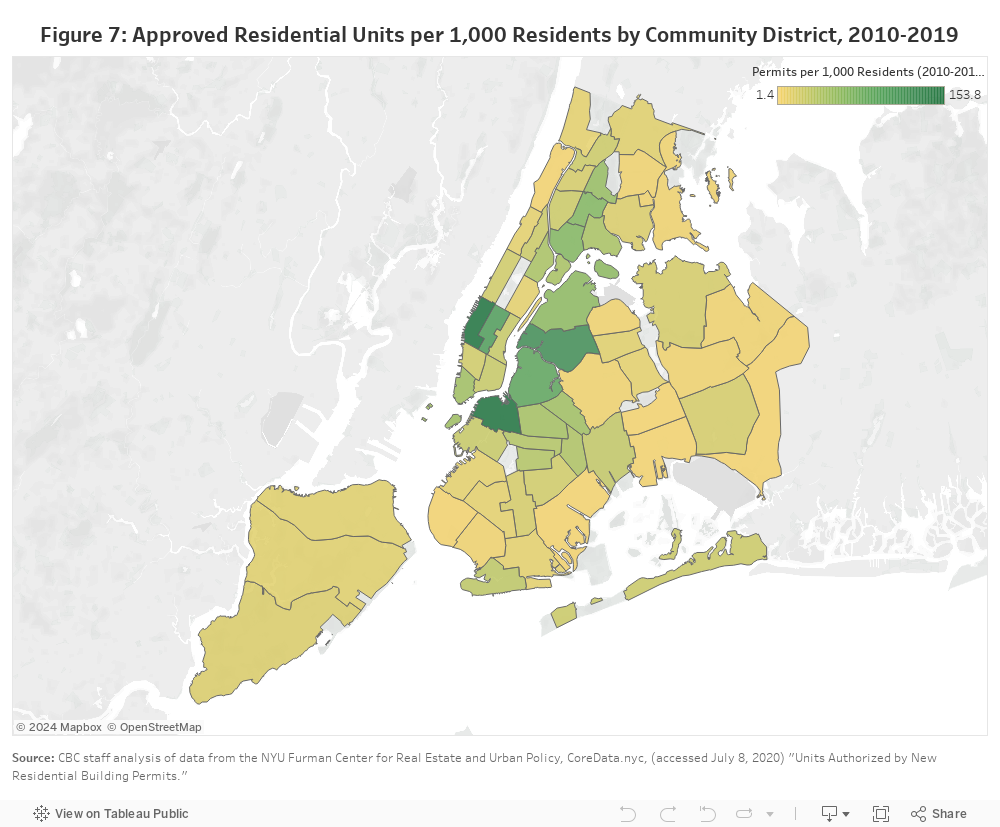
Many of the neighborhoods with the fewest new housing units were rezoned during the Bloomberg administration to limit development or faced other impediments to new development. (See Table 2 and Figure 7.) For example, there were 1.3 new units per 1,000 residents approved since 2010 in Brooklyn Community District 18 (Canarsie/Flatlands). Many neighborhoods in Manhattan, including the Upper East Side, Morningside Heights, and SOHO/Greenwich Village, also had below-average permitting activity on both an aggregate and per-capita basis. (See Appendix B for the full list of housing units approved by neighborhood.)
The neighborhood-level production figures in this report include both new market-rate and affordable units. This means that neighborhoods with low permitting rates also have low rates of new affordable housing development.
Record-setting levels of City capital subsidies for new affordable housing have helped finance 49,055 new affordable units between January 2014 and April 2020; however few of these new units have been built in the districts with lowest rates of new construction.[8] The City financed zero new construction affordable units in seven community districts: Bay Ridge/Dyker Heights, Bensonhurst, Flatlands/Canarsie, Woodhaven, Bayside/Little Neck, Queens Village, and the South Shore of Staten Island. In another four community districts fewer than 20 new units were produced: Howard Beach/Ozone Park (3 units), East Elmhurst/Jackson Heights (11 units), Co-op City/Throgs Neck (13 units), and Maspeth/Ridgewood (13 units).[9] Collectively, these 11 community districts have a combined population of 1.8 million, enough to rank as the 5th largest U.S. city, but have built just 42 new units of affordable housing since 2014.
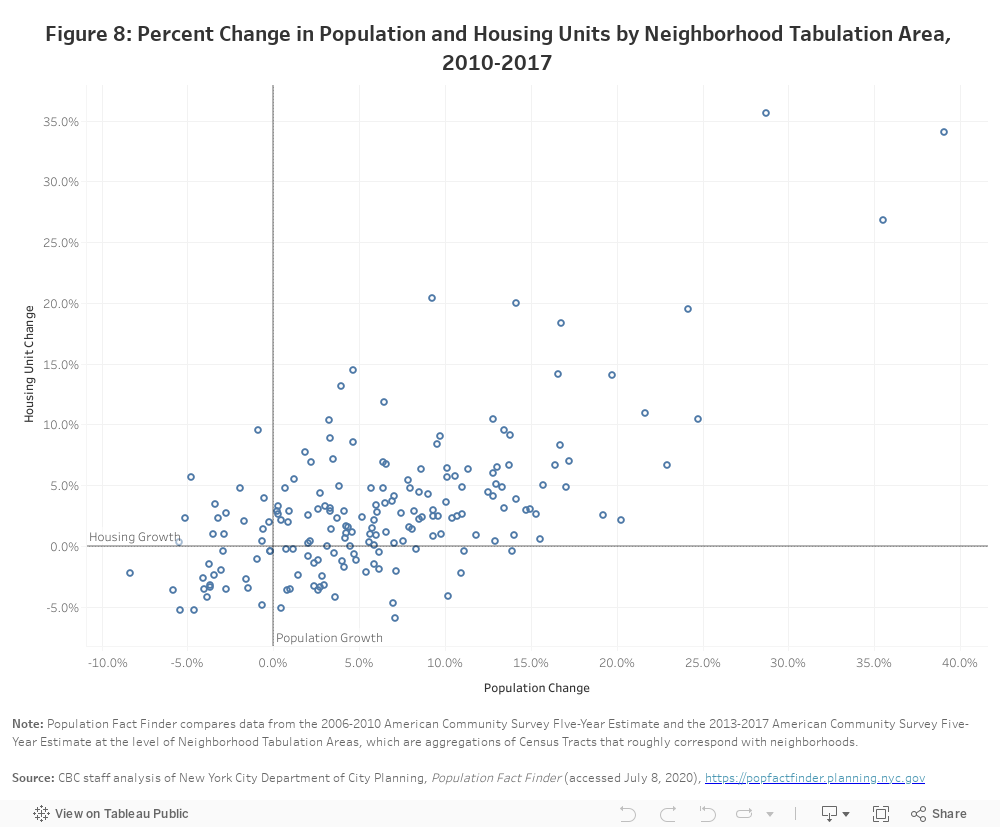
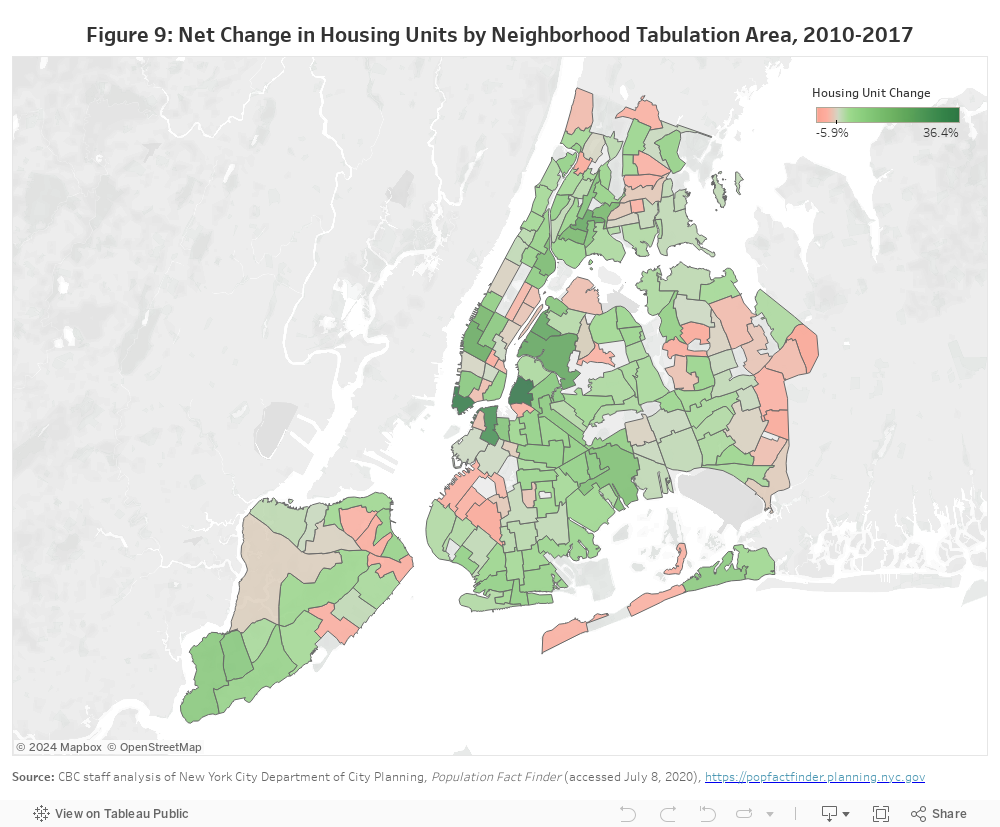
Comparing housing unit and population growth provides a more nuanced understanding of the differences among neighborhoods. Between 2010 and 2017 population and units increased modestly in most neighborhoods. (See Figures 8 and 9 which compare the net change in population and housing units by neighborhood between 2010 and 2017, based on the latest available data from the American Community Survey (ACS)). Citywide, the population grew 5.5 percent while the housing stock increased by 3.7 percent. Over the same period, the average household size increased from 2.64 to 2.67. The small number of neighborhoods with high rates of new development or conversions like Chelsea, Lower Manhattan, and Downtown Brooklyn, had substantial growth in both population and housing units.
Other neighborhoods did not. A handful of neighborhoods lost both population and housing, including parts of the Upper East Side, Upper West Side, Windsor Terrace, and Chinatown. This likely results from both declining household sizes and the net impact of demolitions and the combining of multiple units into single units outpacing the addition of newly built units.
Neighborhoods that were downzoned, like Bay Ridge, have had limited housing growth and little to no population growth. Meanwhile, many neighborhoods in southern Brooklyn and southeastern Queens, such as Bensonhurst, Bath Beach, Jamaica, and Ozone Park, have had population increases that far exceed the growth in their housing stock.
Finally, population growth occurred without development in other areas, suggesting the neighborhoods had falling vacancy rates, may have experienced increasing rates of illegal conversions not reflected in Census data, or experienced growing average household sizes, which could result from doubling up or overcrowding.
Housing Production was Limited to Certain Types of Units
As New York City’s economy recovered from the Great Recession, high-rise housing accounted for an increasing share of newly constructed units. This was the product both of a development boom in neighborhoods like Downtown Brooklyn that were upzoned in the 2000s along with a steady decline in the number of low-rise buildings built in other areas of the city, many of which were downzoned.
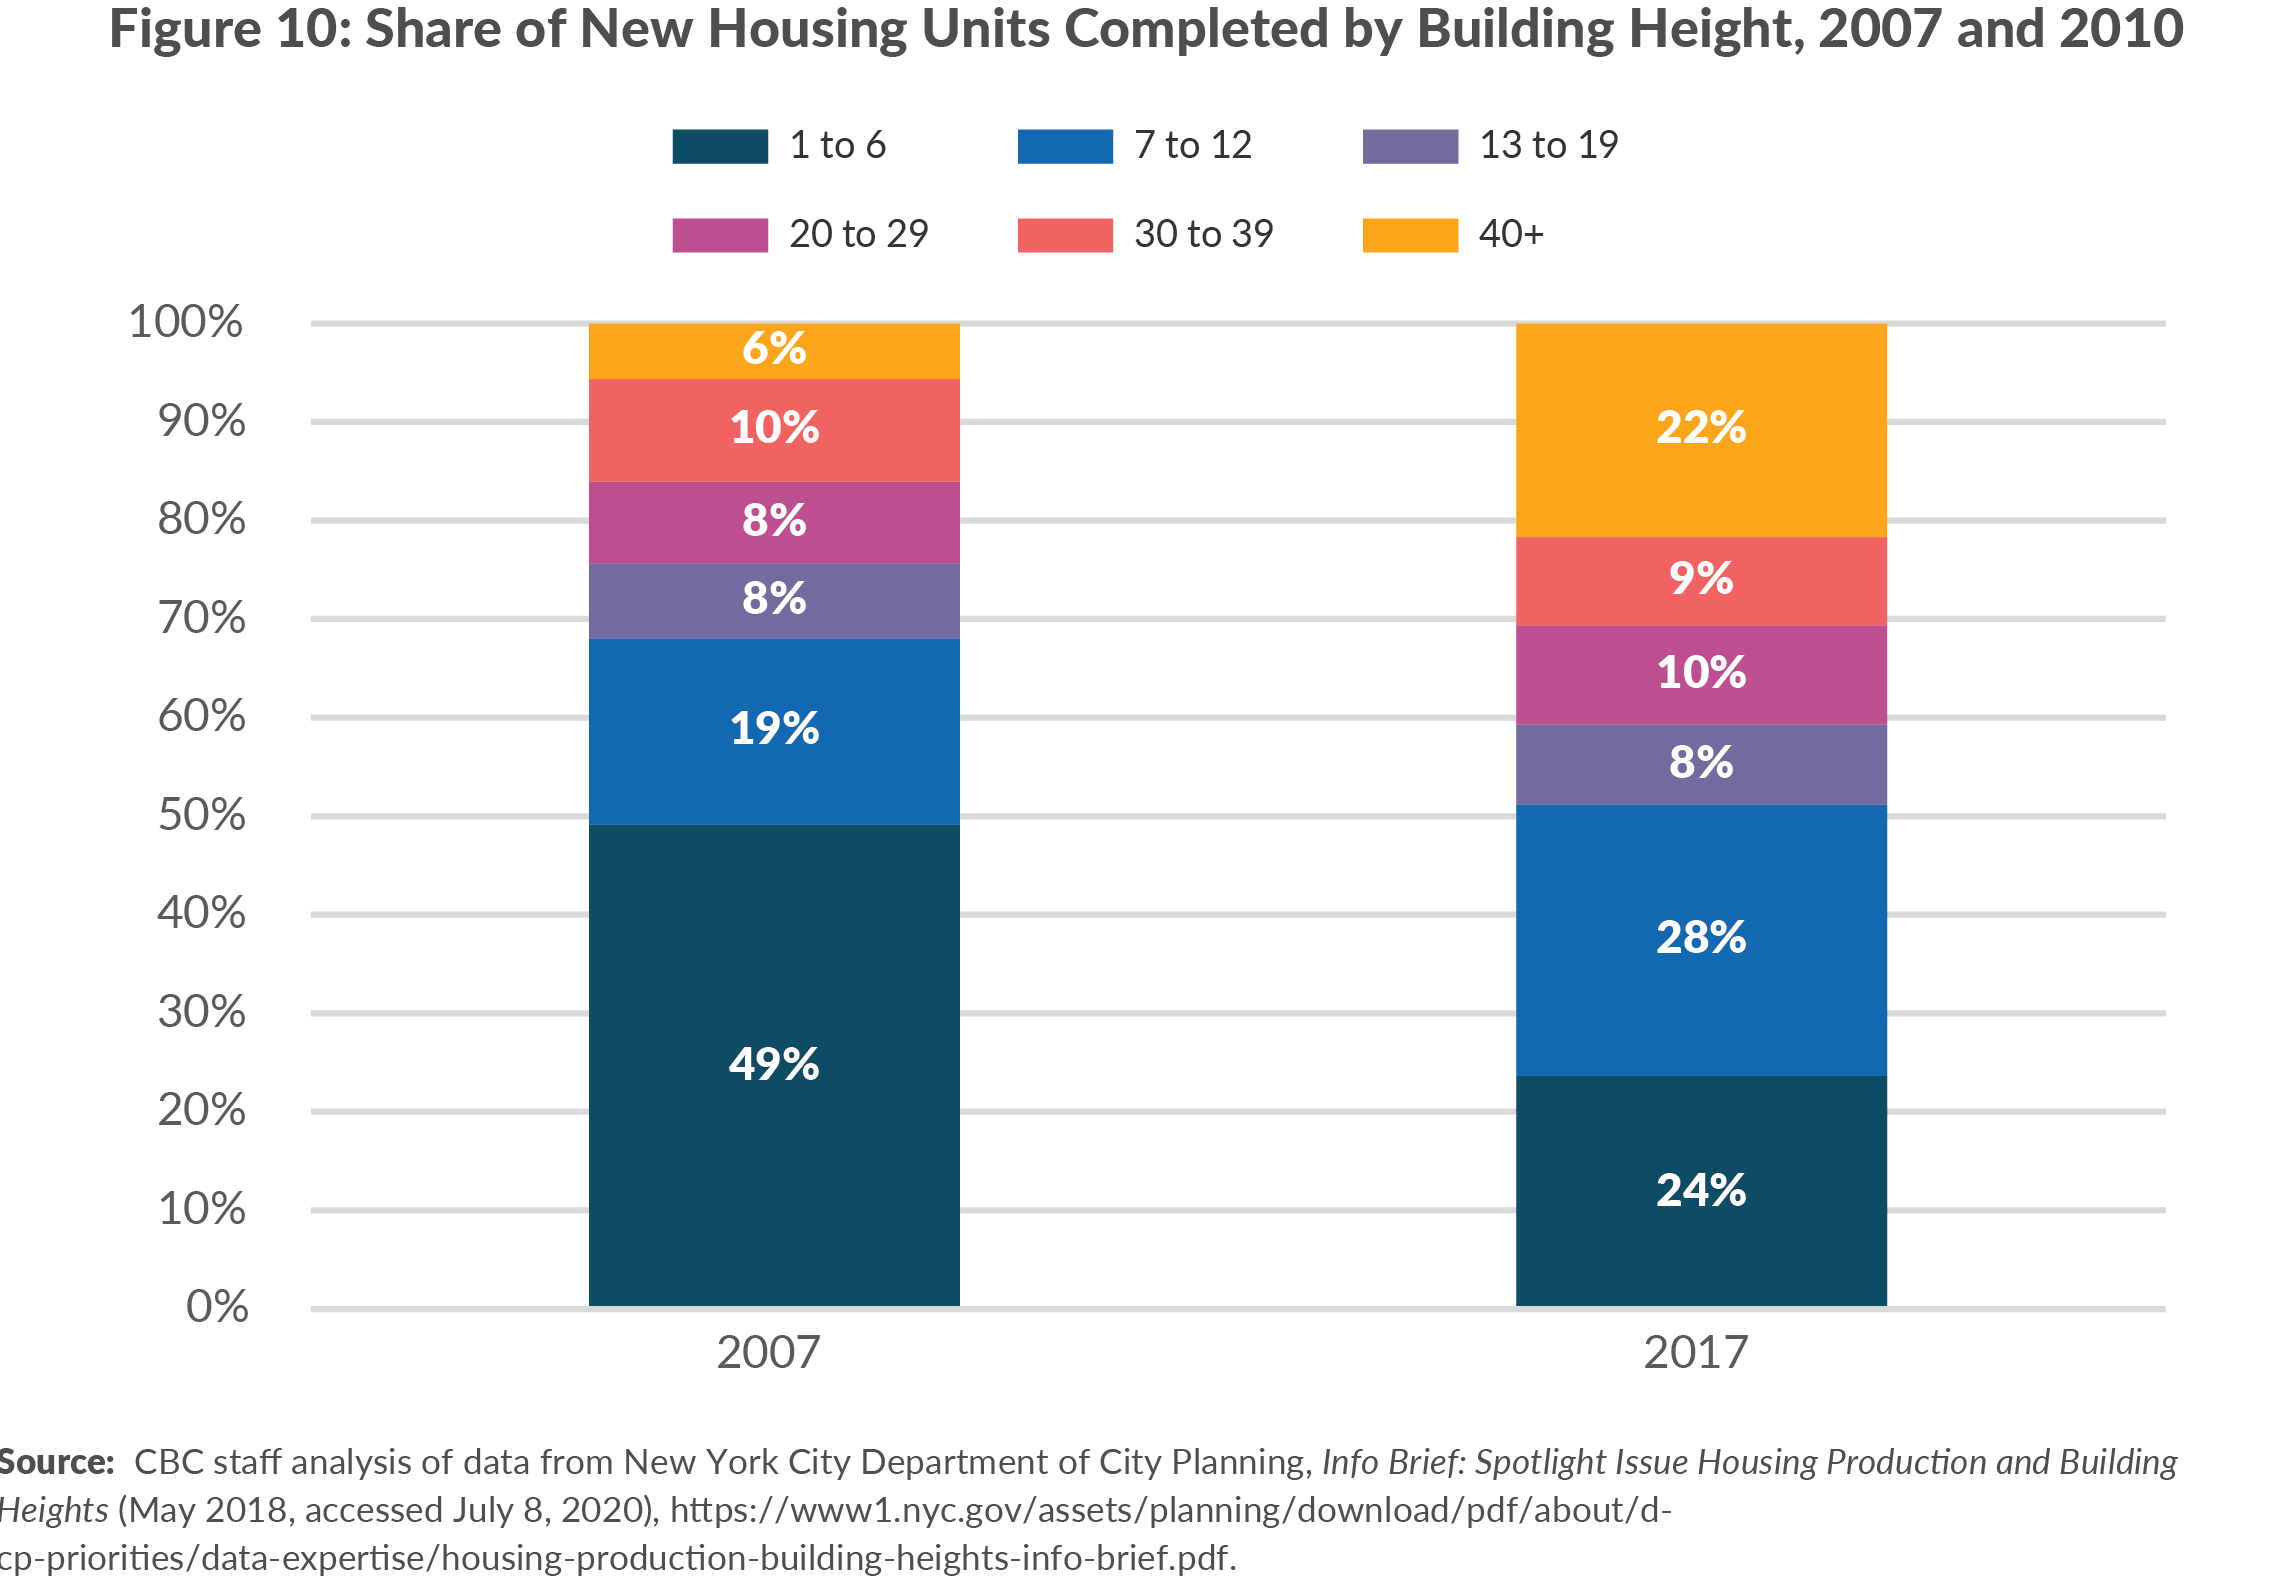
The New York City Department of City Planning (DCP) noted this trend in a recent report on regional housing and job growth, identifying a “post-Great Recession trend toward housing production in locations where land is more expensive, and in building types that are more costly to construct, with less housing production overall.”10 DCP’s analysis found that in 2007 approximately half of newly-built units were located in one- to six-story buildings; by 2017, on a similar overall volume of completions, that share had fallen to 24 percent. By contrast, buildings with 40 or more stories increased from approximately 6 percent of new completions to 20 percent.11 (See Figure 10.)
High-density development in upper-income neighborhoods fills a critical piece of the housing pipeline. These buildings absorb demand from households that would otherwise bid up rents elsewhere, while also helping the City meet its fair housing goals by generating affordable units in high-opportunity neighborhoods through the Affordable New York program (commonly known as 421-a) and inclusionary housing programs.12 However, as DCP notes, high-rise buildings are viable in neighborhoods where rents justify high construction costs and land prices. In many other areas of the city, low-rise and mid-rise buildings are the most financially feasible development option, but the rate of permitting and completions in these neighborhoods has declined, suggesting demand for some segments of the market is going unmet.
Rental Buildings Account for Majority of New Housing
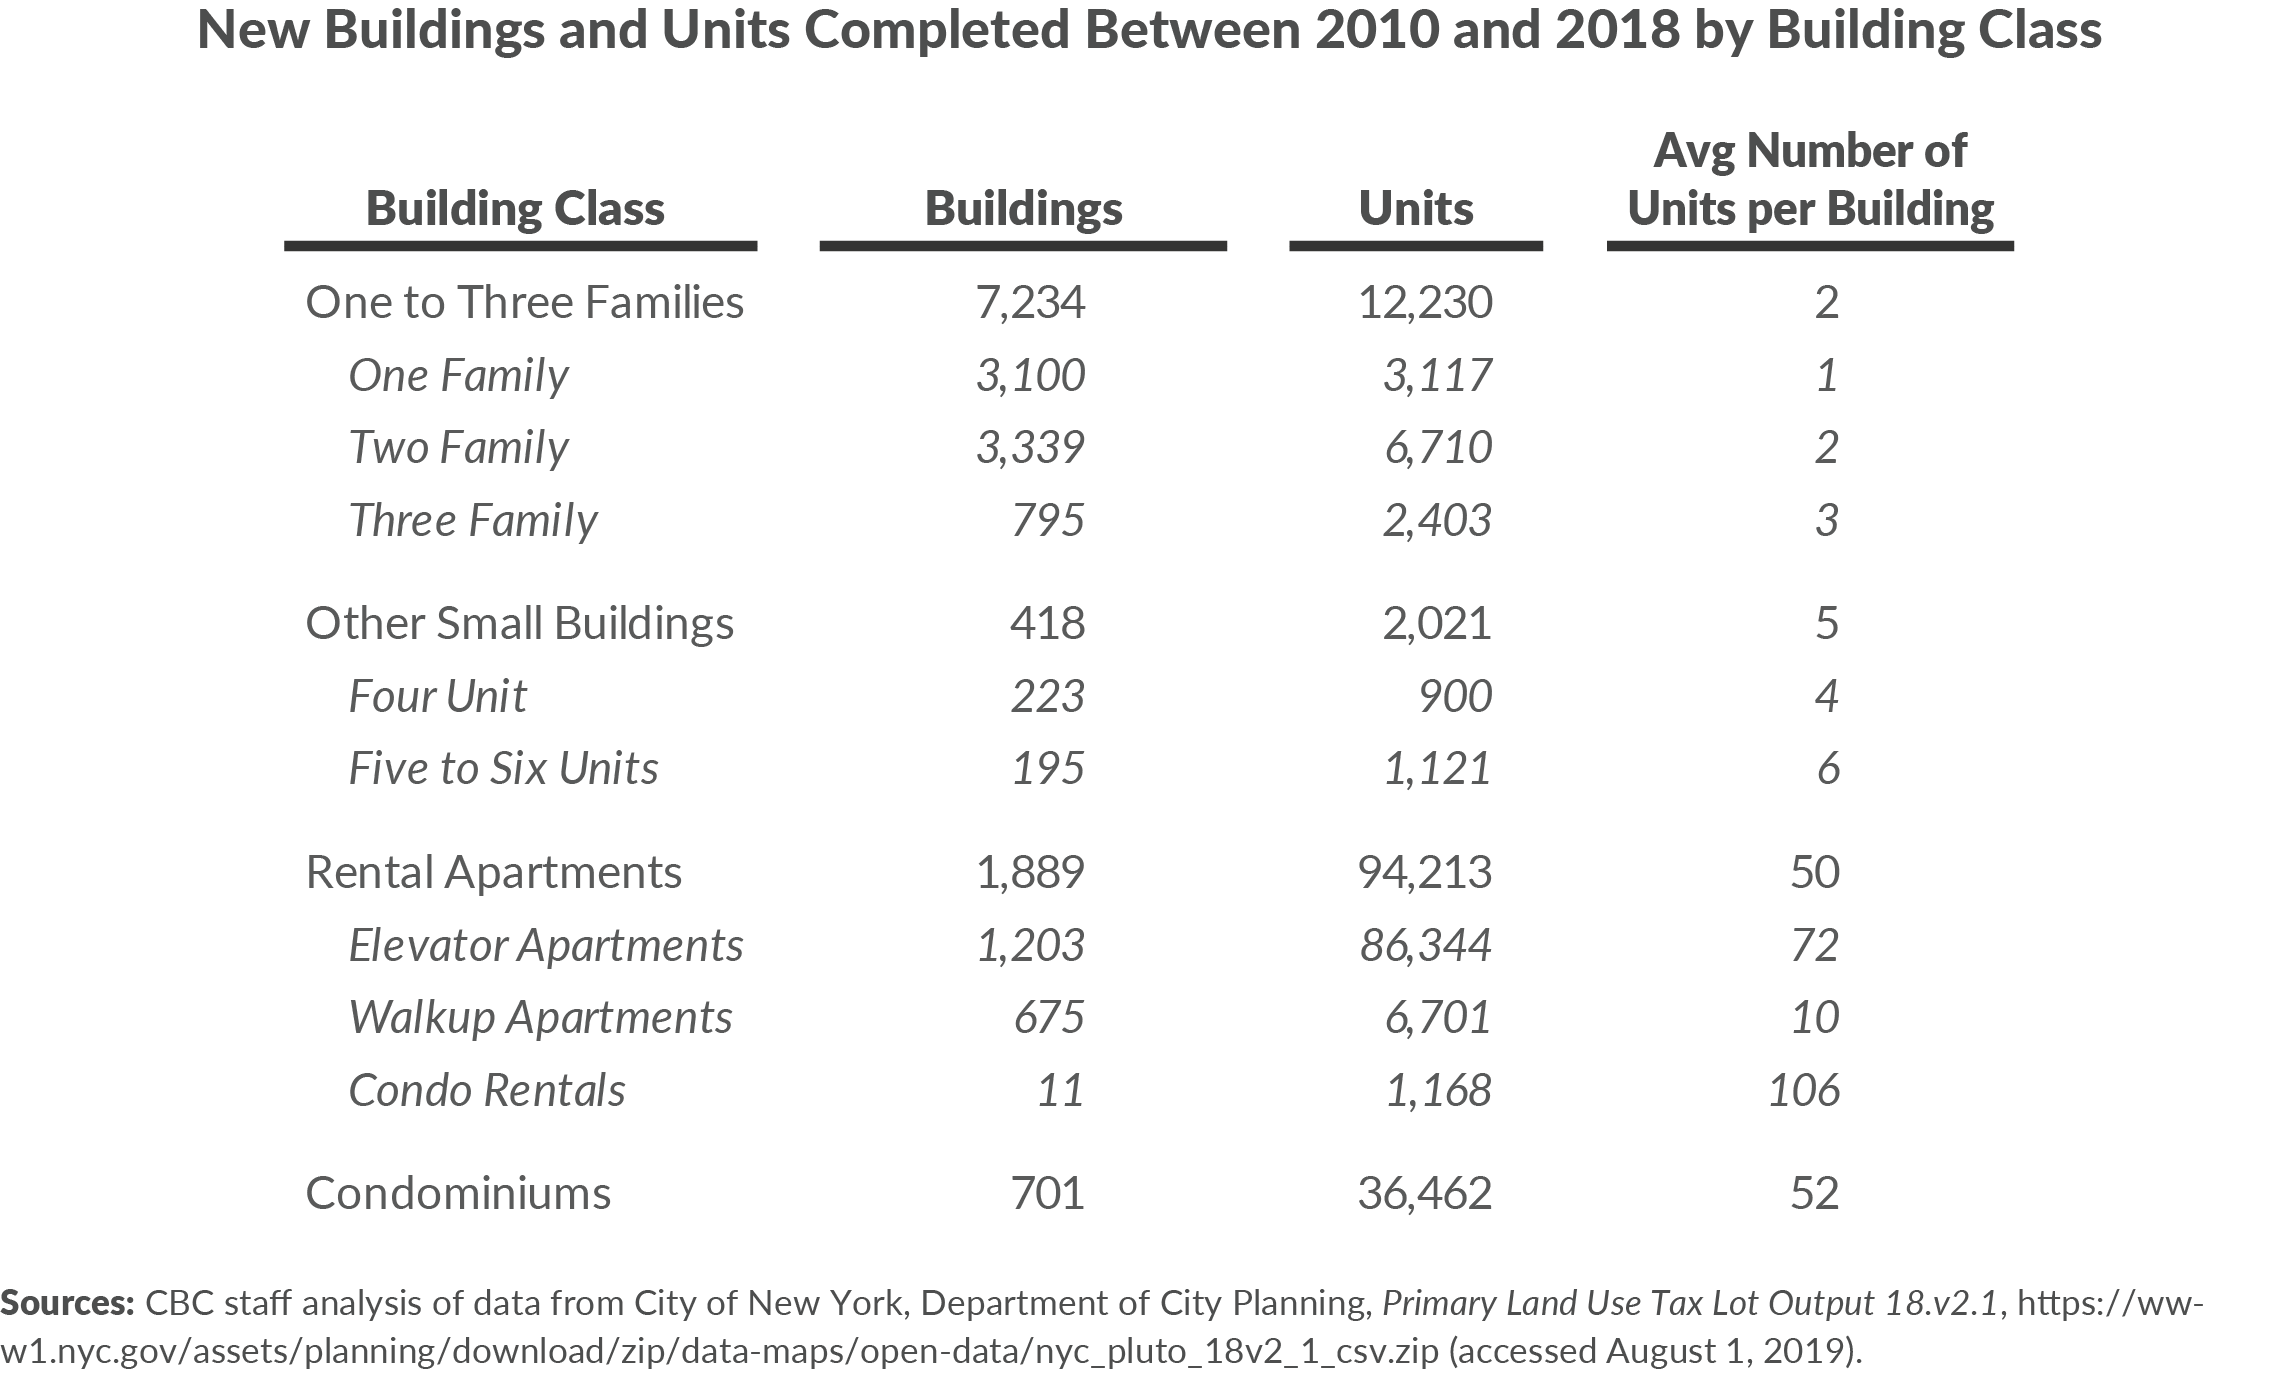
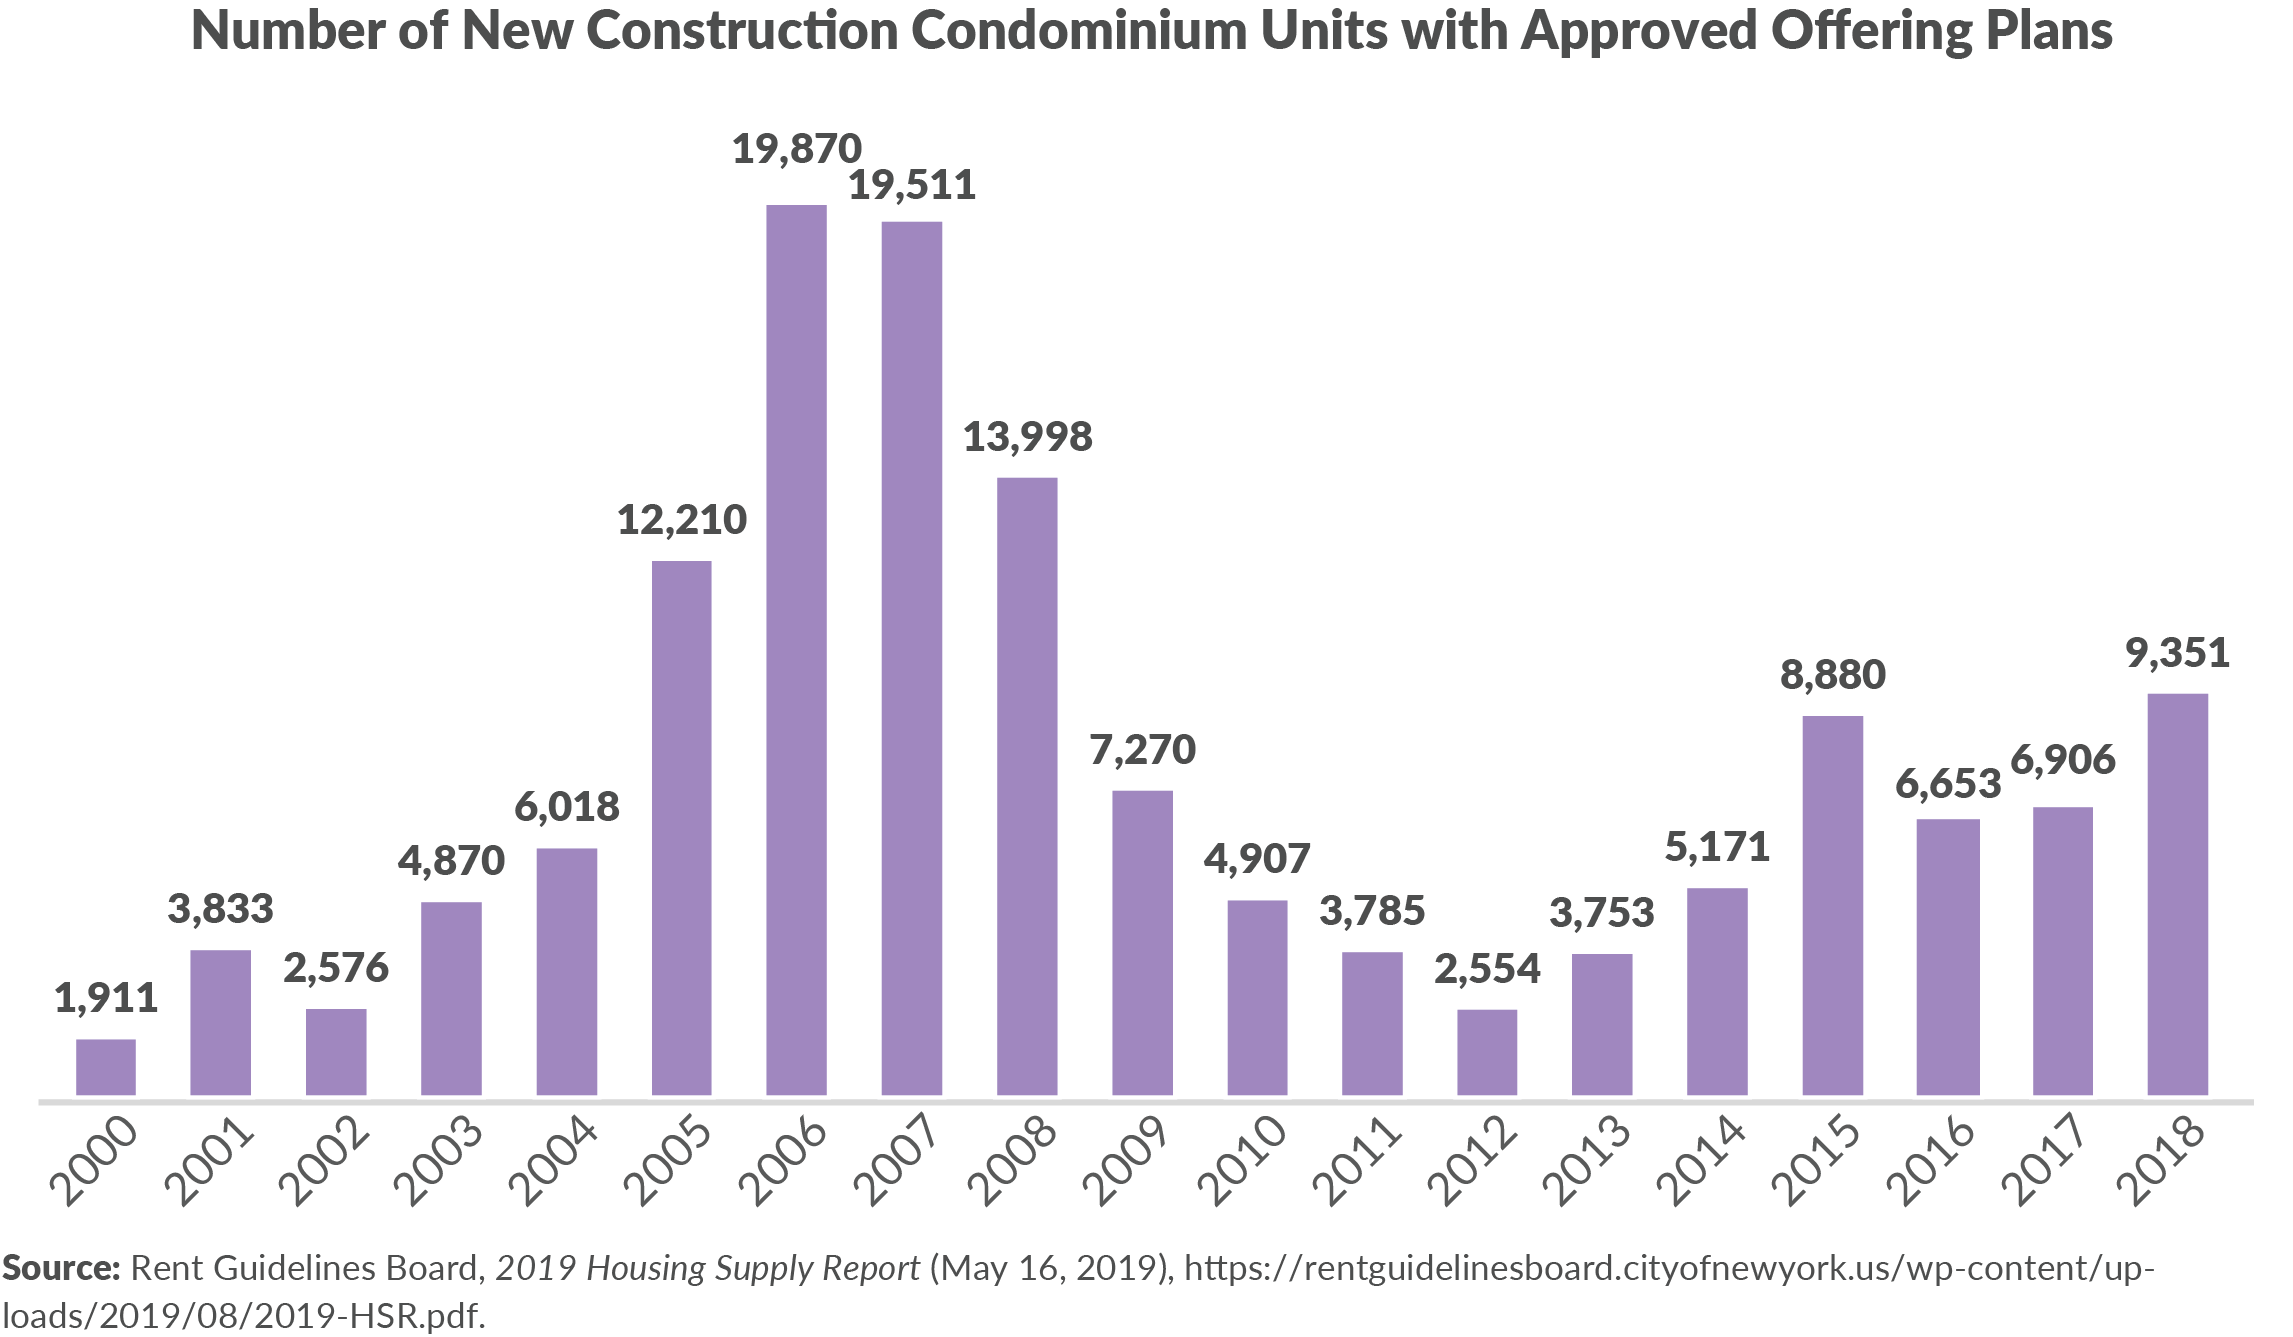
Despite the attention paid to the growing inventory of unsold condominium projects in Manhattan, rental buildings have accounted for most of the new construction activity in recent years. Over 94,000 new rental apartments were built between 2010 and 2018 as compared to 36,000 condominiums and 12,000 one- to three-family homes. In fact, the number of new construction condominium units with approved offering plans remains 50 percent below the pre-recession peak even as the overall number of units permitted in the 2010s was 10 percent less than that of the previous decade. (See Appendix D for more data on the types of housing built since 2010.)
Production Lags in the Downstate Suburbs
Housing supply is a regional issue. Robust regional housing production is needed to support mobility, accessibility, and affordability, and the New York City region’s extensive transit system can and should support a vibrant regional housing market. While some areas of the region, including areas of New Jersey and Connecticut, have taken advantage of this connectivity to build more housing to accommodate the region’s job growth, New York’s downstate suburbs have not.
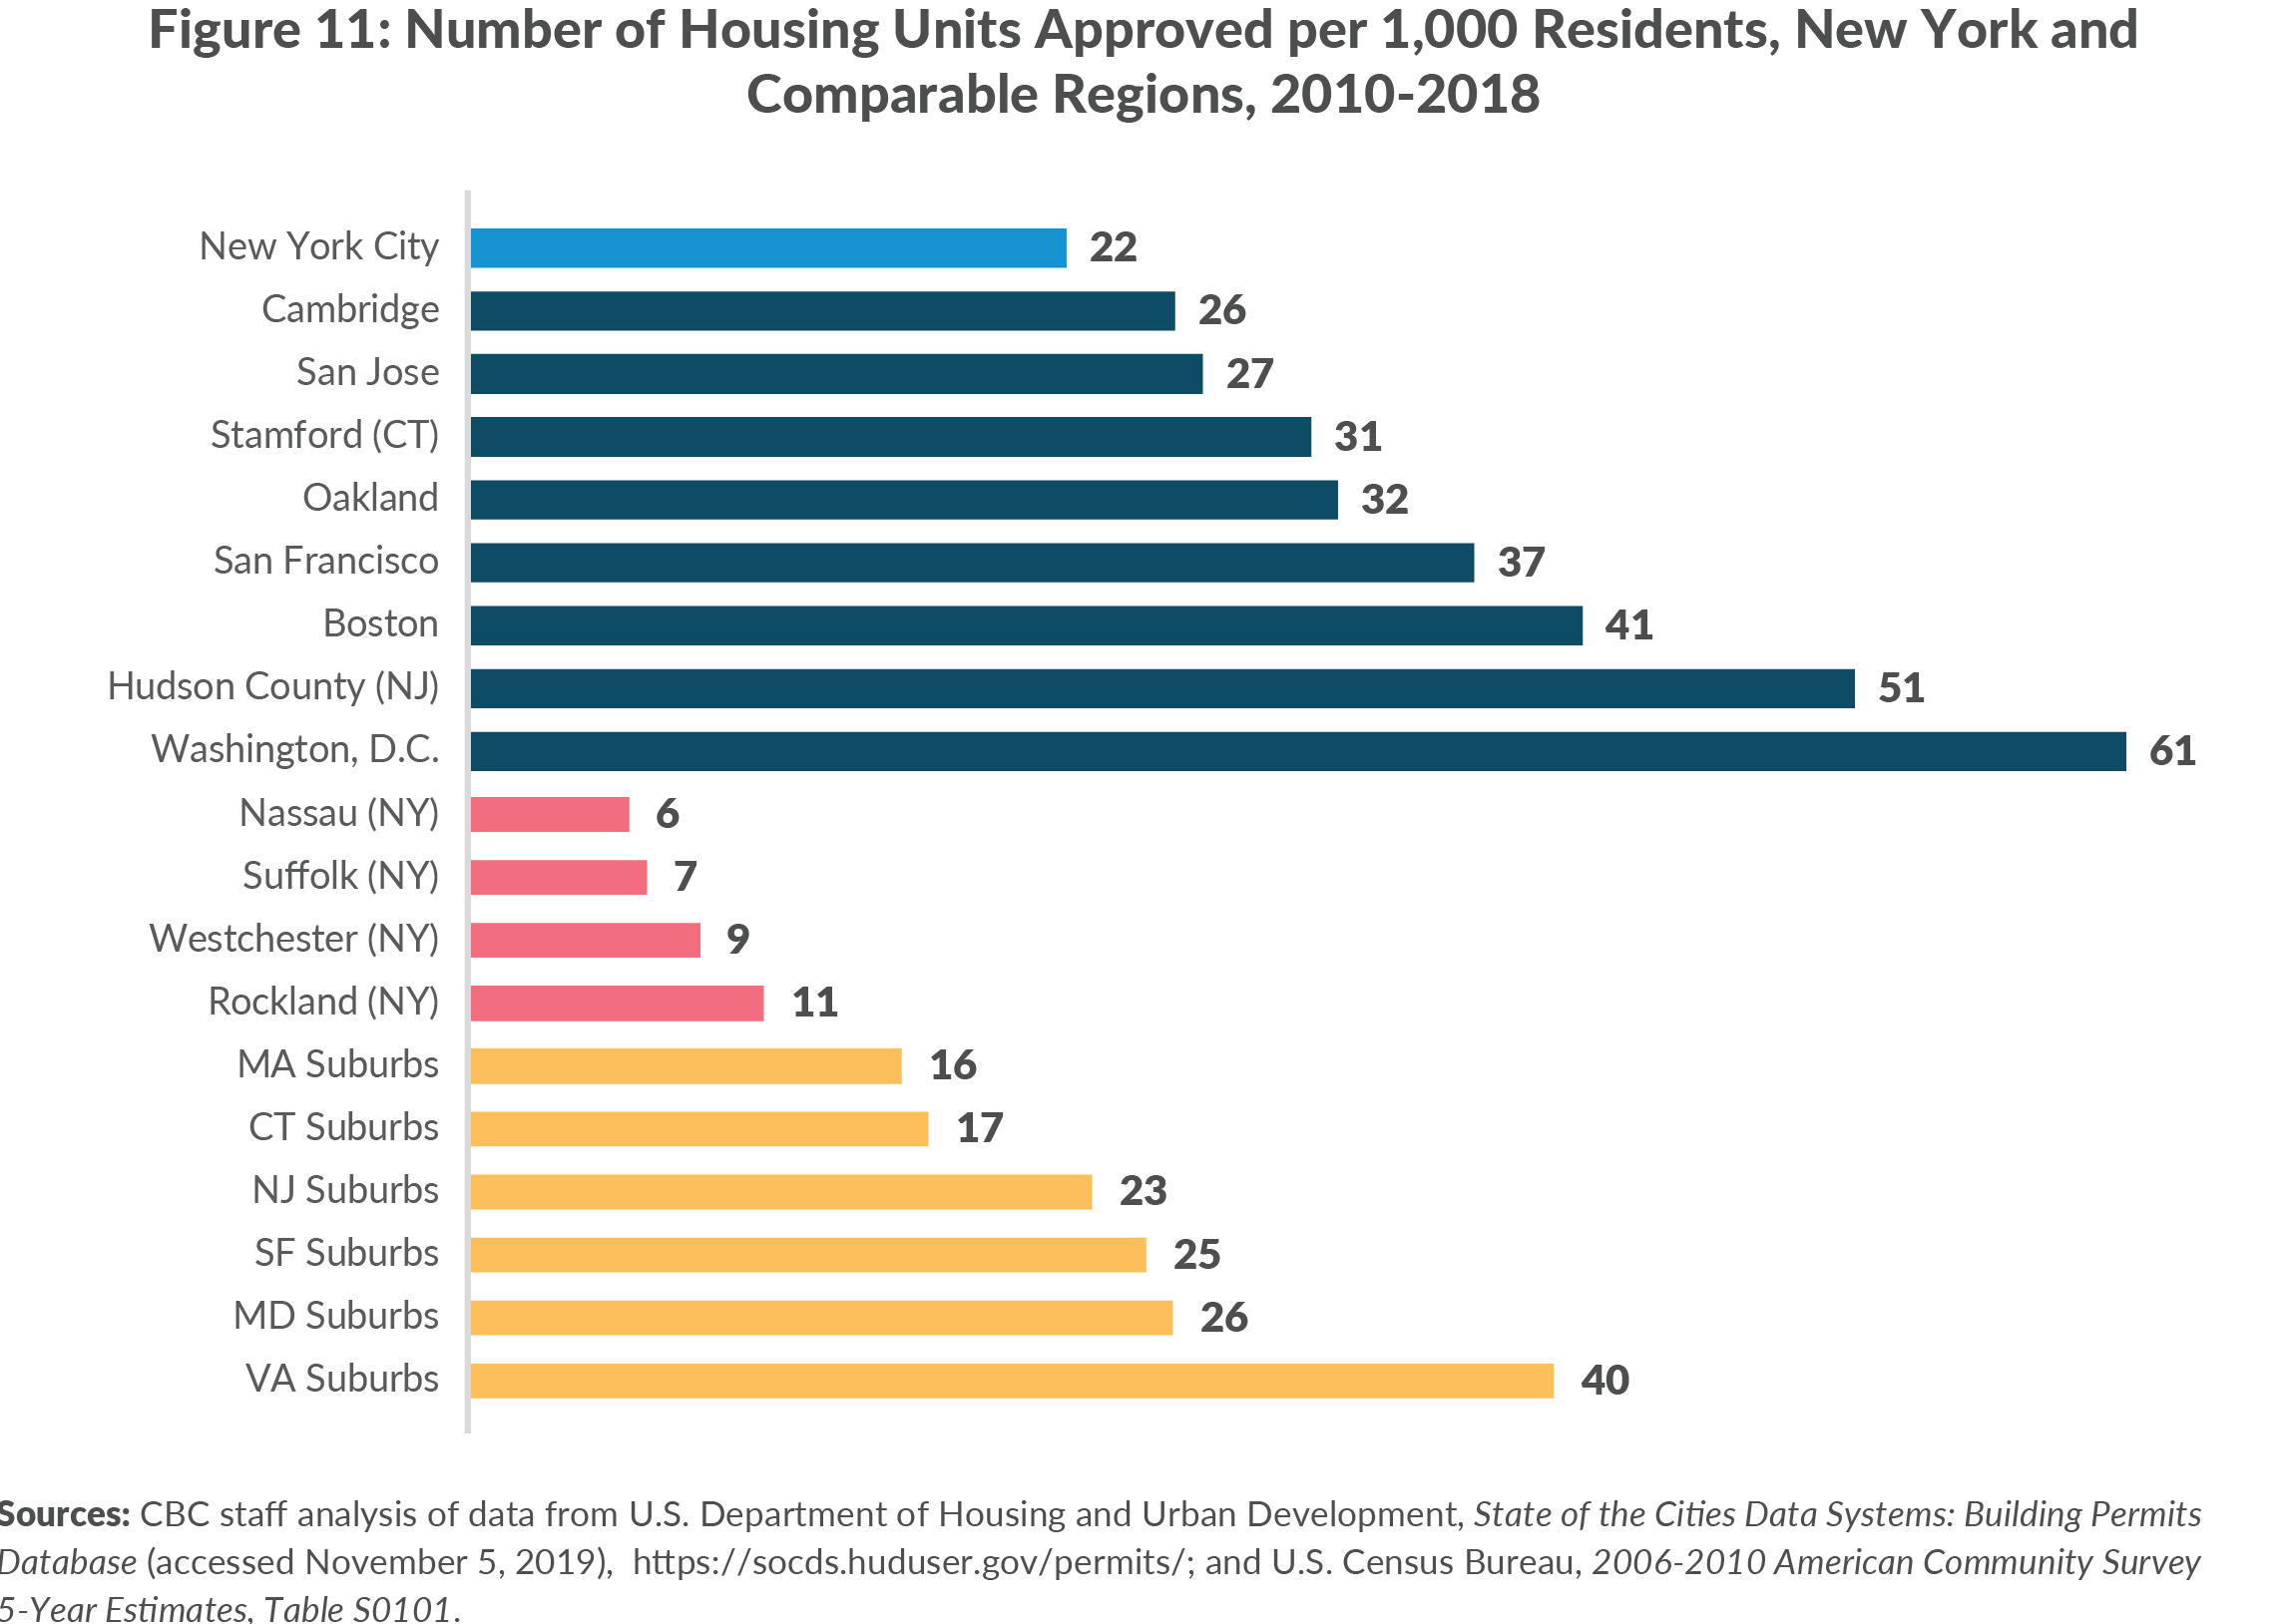
Housing production rates in the New York City suburbs of Westchester, Rockland, and Long Island are some of the lowest in the country, lagging behind not only comparable cities and suburbs in New Jersey and Connecticut, but also the suburbs of other prosperous metropolitan regions. (See Figure 11.) Collectively, Rockland, Westchester, Nassau, and Suffolk Counties issued permits for half as many housing units per capita as Fairfield County, Connecticut; one-third of the housing built in suburbs of New Jersey, the Bay Area, or Maryland suburbs of Washington, D.C.; and less than one-fifth of the housing built in northern Virginia.
Similarly, in addition to lagging its peer cities nationally, New York City issued permits for half as many units as Hudson County, New Jersey, which is home to cities like Hoboken, Jersey City, Union City, and Bayonne, which face many of the same land constraints as neighborhoods in the five boroughs.
The result of demand exceeding supply has been rising home prices in New York City’s suburbs and an inability to attract and retain younger households who would otherwise prefer to reside in or live on their own in the suburbs.13 For example, in Nassau County the number of county residents between the ages of 20 and 44 has fallen 9.3 percent since 2000, and more than 44 percent of residents between the ages of 25 and 34 live with their parents.14 Residents of Long Island and Westchester are also the most likely of any residents in the New York region to be rent burdened: 55 percent of renter households in Long Island and 53 in Westchester and Rockland pay at least 30 percent of their income in rent, as compared to 51 percent in New York City, 50 percent in Connecticut, and 49 percent in Northern New Jersey.15
While many areas of the country fail to produce enough housing, the problem of underproduction is distinctly worse in New York City and the downstate suburbs.
REASONS FOR NEW YORK CITY’S LAGGING HOUSING PRODUCTION
New York City’s housing production has lagged peer cities for many reasons. Some are beyond the direct influence of State and local government. Development in New York City is constrained by its water borders; short of creating new land, there are fewer opportunities to build new housing as there are in regions that can continue to grow outward through annexation and suburbanization or in less dense cities like Austin or Denver.
New York City’s low housing growth rate, however, is not the result of a lack of demand. Between the end of the Great Recession and the onset of the Covid-19 pandemic, the City’s economy added jobs at a record-setting rate, while rents continued to rise and vacancy rates remained low.16 Rather, it is the product of decades of policy choices by City and State officials– some deliberate, others unintended–that have slowed the pace of new construction in many neighborhoods. There are three problems that contribute to New York’s underproduction of housing.
1. Shortage of Potential Development Sites
Land in New York is scarce, and new development in New York comes from building up rather than from sprawling out. However, the City’s existing zoning regulations offer limited opportunities to add units through as-of-right development, which is the fastest, least expensive, and most certain way to increase production and to build more housing.
The Benefits of As-of-Right Development
A city’s zoning ordinance should translate planning goals into a legal framework that sets the ground rules for growth and development. The zoning code regulates the size of buildings, how buildings are used (residential, commercial, or manufacturing), and how they relate to the street and surrounding built environment.
In New York City, the zoning resolution establishes these guidelines through a variety of tools: floor area ratios (FAR, or the ratio of a building’s total built square footage to its lot area) control bulk; minimum lot sizes, setbacks, and coverage ratios dictate the footprint of buildings on their lots; height limits cap the size of buildings; dwelling factors cap the number of units that can be built on a lot; and parking minimums set a floor for how much parking buildings must provide.
Projects that conform to the zoning code can be built as-of-right, meaning that they require only administrative approvals from City officials. As-of-right development offers certainty to both property owners and neighbors. Projects that deviate significantly from the zoning code must secure discretionary approvals through the City’s Uniform Land Use Review Procedure (ULURP), which entails a period of negotiations with DCP and an environmental assessment, followed by six months of advisory reviews by Community Boards and Borough Presidents, culminating in approvals from the City Planning Commission and the City Council. These discretionary land use reviews ensure that the public has adequate opportunity to review proposed zoning changes, but they can be expensive, time-consuming, and introduce uncertainty into the development process. In general, as-of-right development is the fastest, most certain, and least expensive way to add housing.
Most residential development in New York City is built as-of-right. Since 2010 80 percent of new housing units built in New York City were as-of-right developments, and a growing number of these units were built in neighborhoods like Downtown Brooklyn and Williamsburg that were rezoned to promote development in the mid-2000s. Only one in five new units citywide required discretionary approvals.17
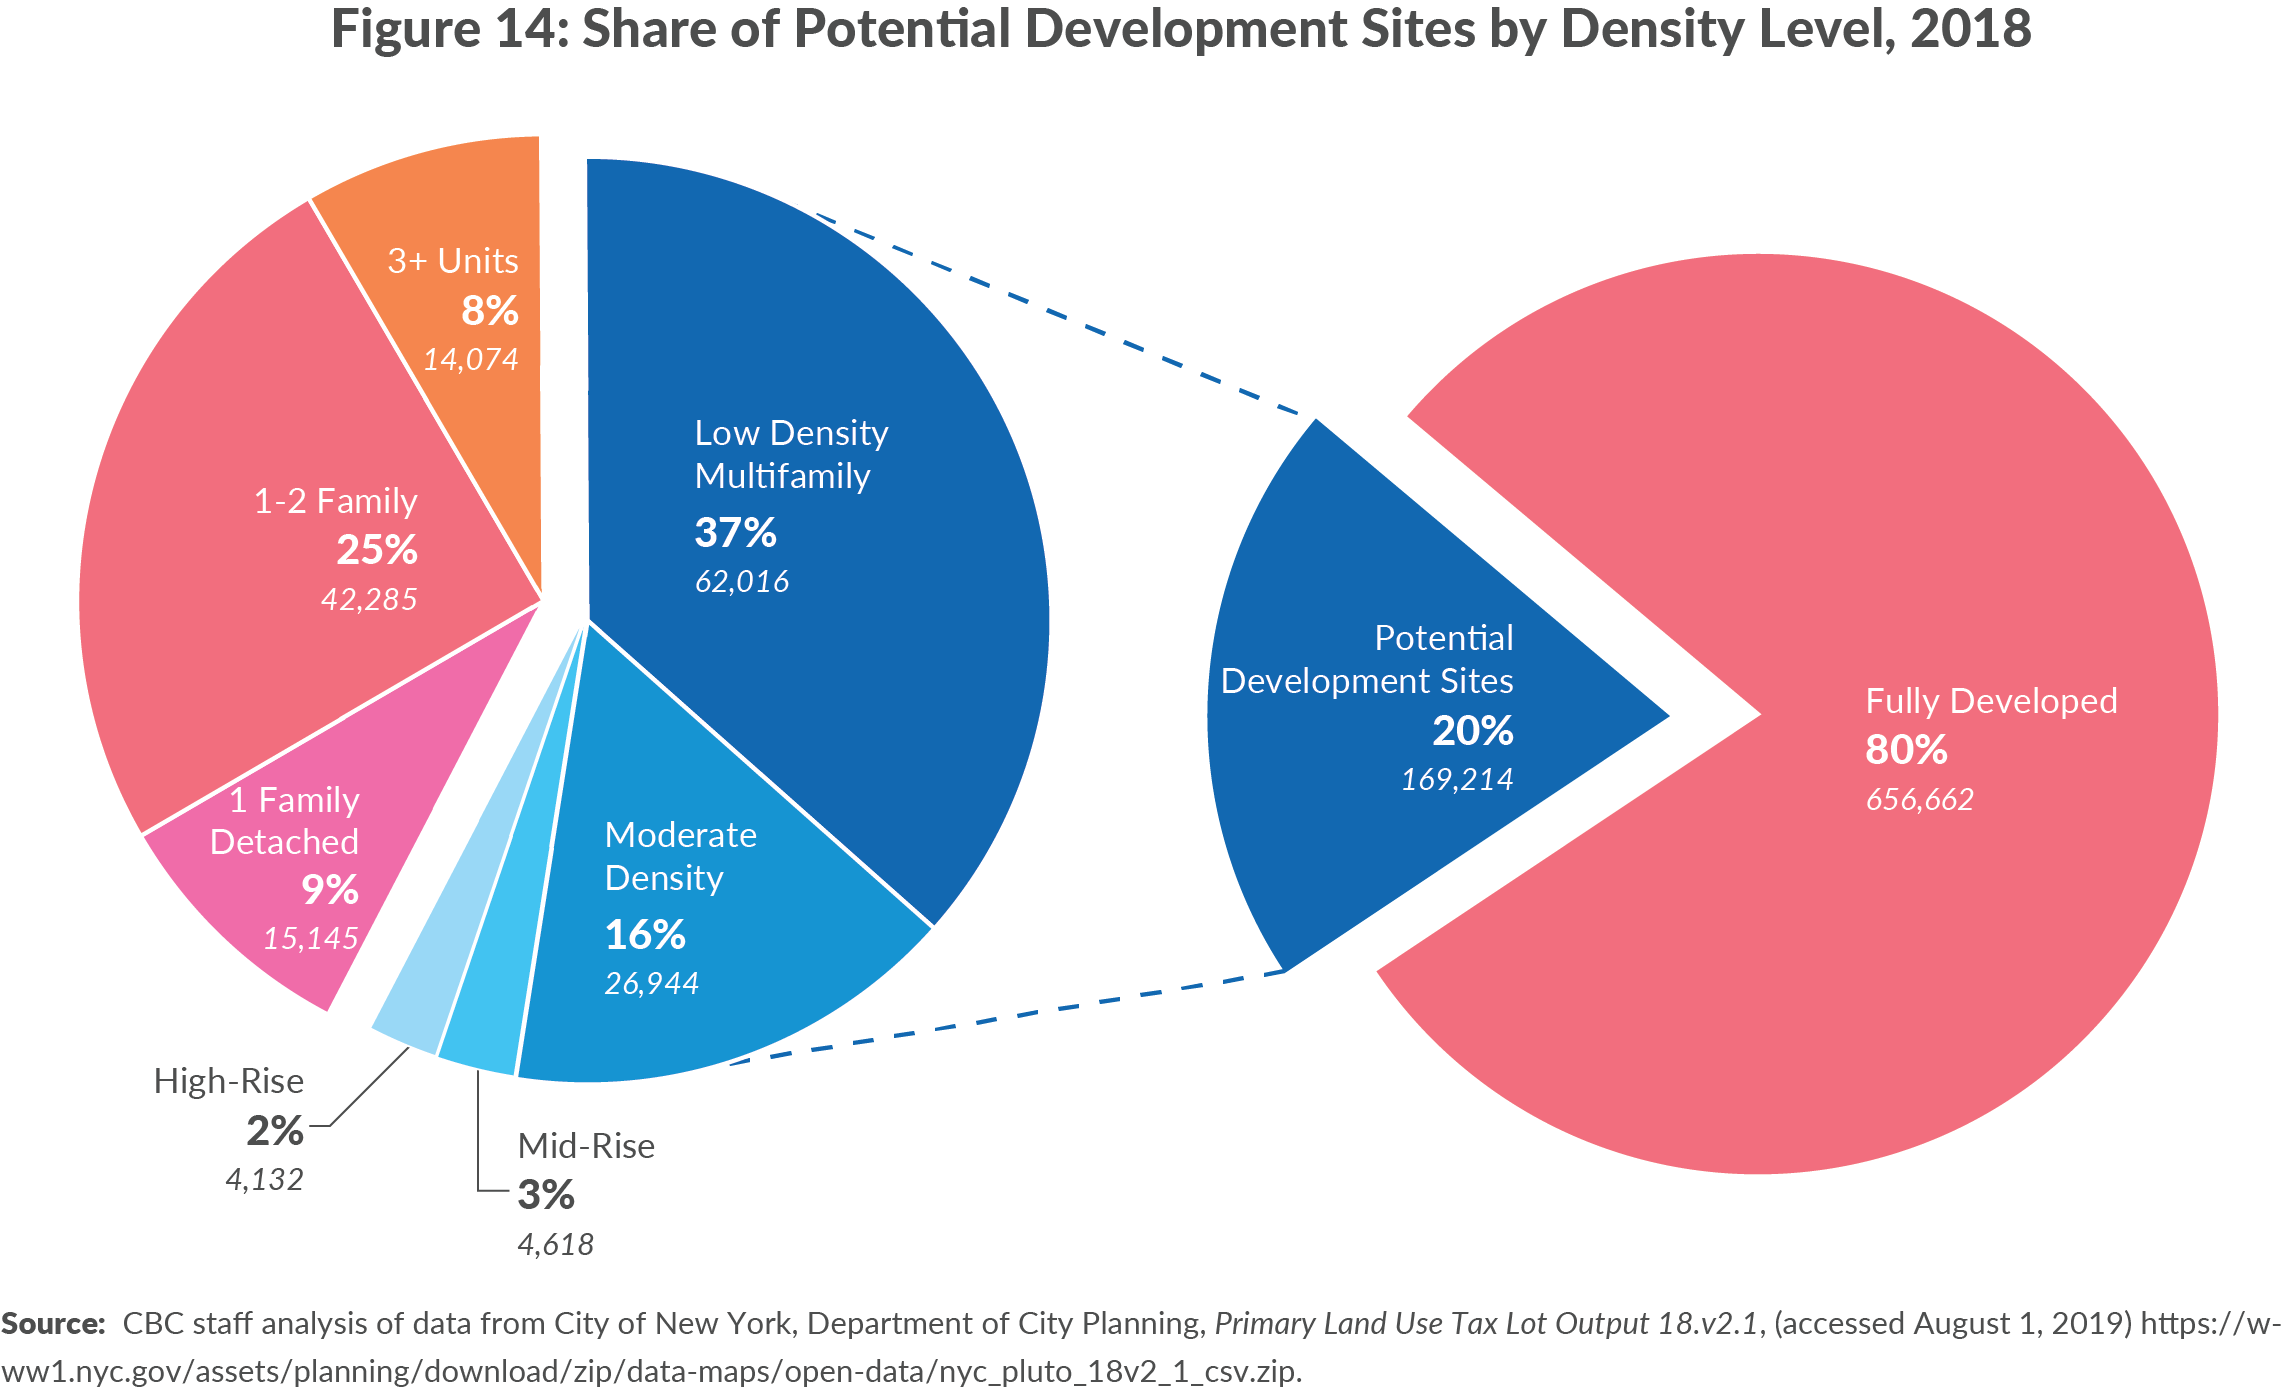
As the neighborhoods that were upzoned got built out, however, the availability of as-of-right development sites declined; most residentially zoned lots exceed or are near the maximum density allowed under the City’s zoning code. As of 2018 825,876 zoning lots in New York City allowed for residential uses.18 Of those approximately 20 percent, or 169,000, were potential as-of-right development sites under existing zoning rules. This left nearly 80 percent of residentially zoned lots sites already built at or near the maximum density levels allowed in their zoning districts.
METHODOLOGY
For the purposes of this analysis, lots are considered potential development sites if they are built to less than 50 percent of the maximum allowable density allowed under current zoning and are not individually landmarked. This is consistent with the methodology used by DCP and other housing researchers in New York City for identifying sites that have the potential to be redeveloped in the future.[19]
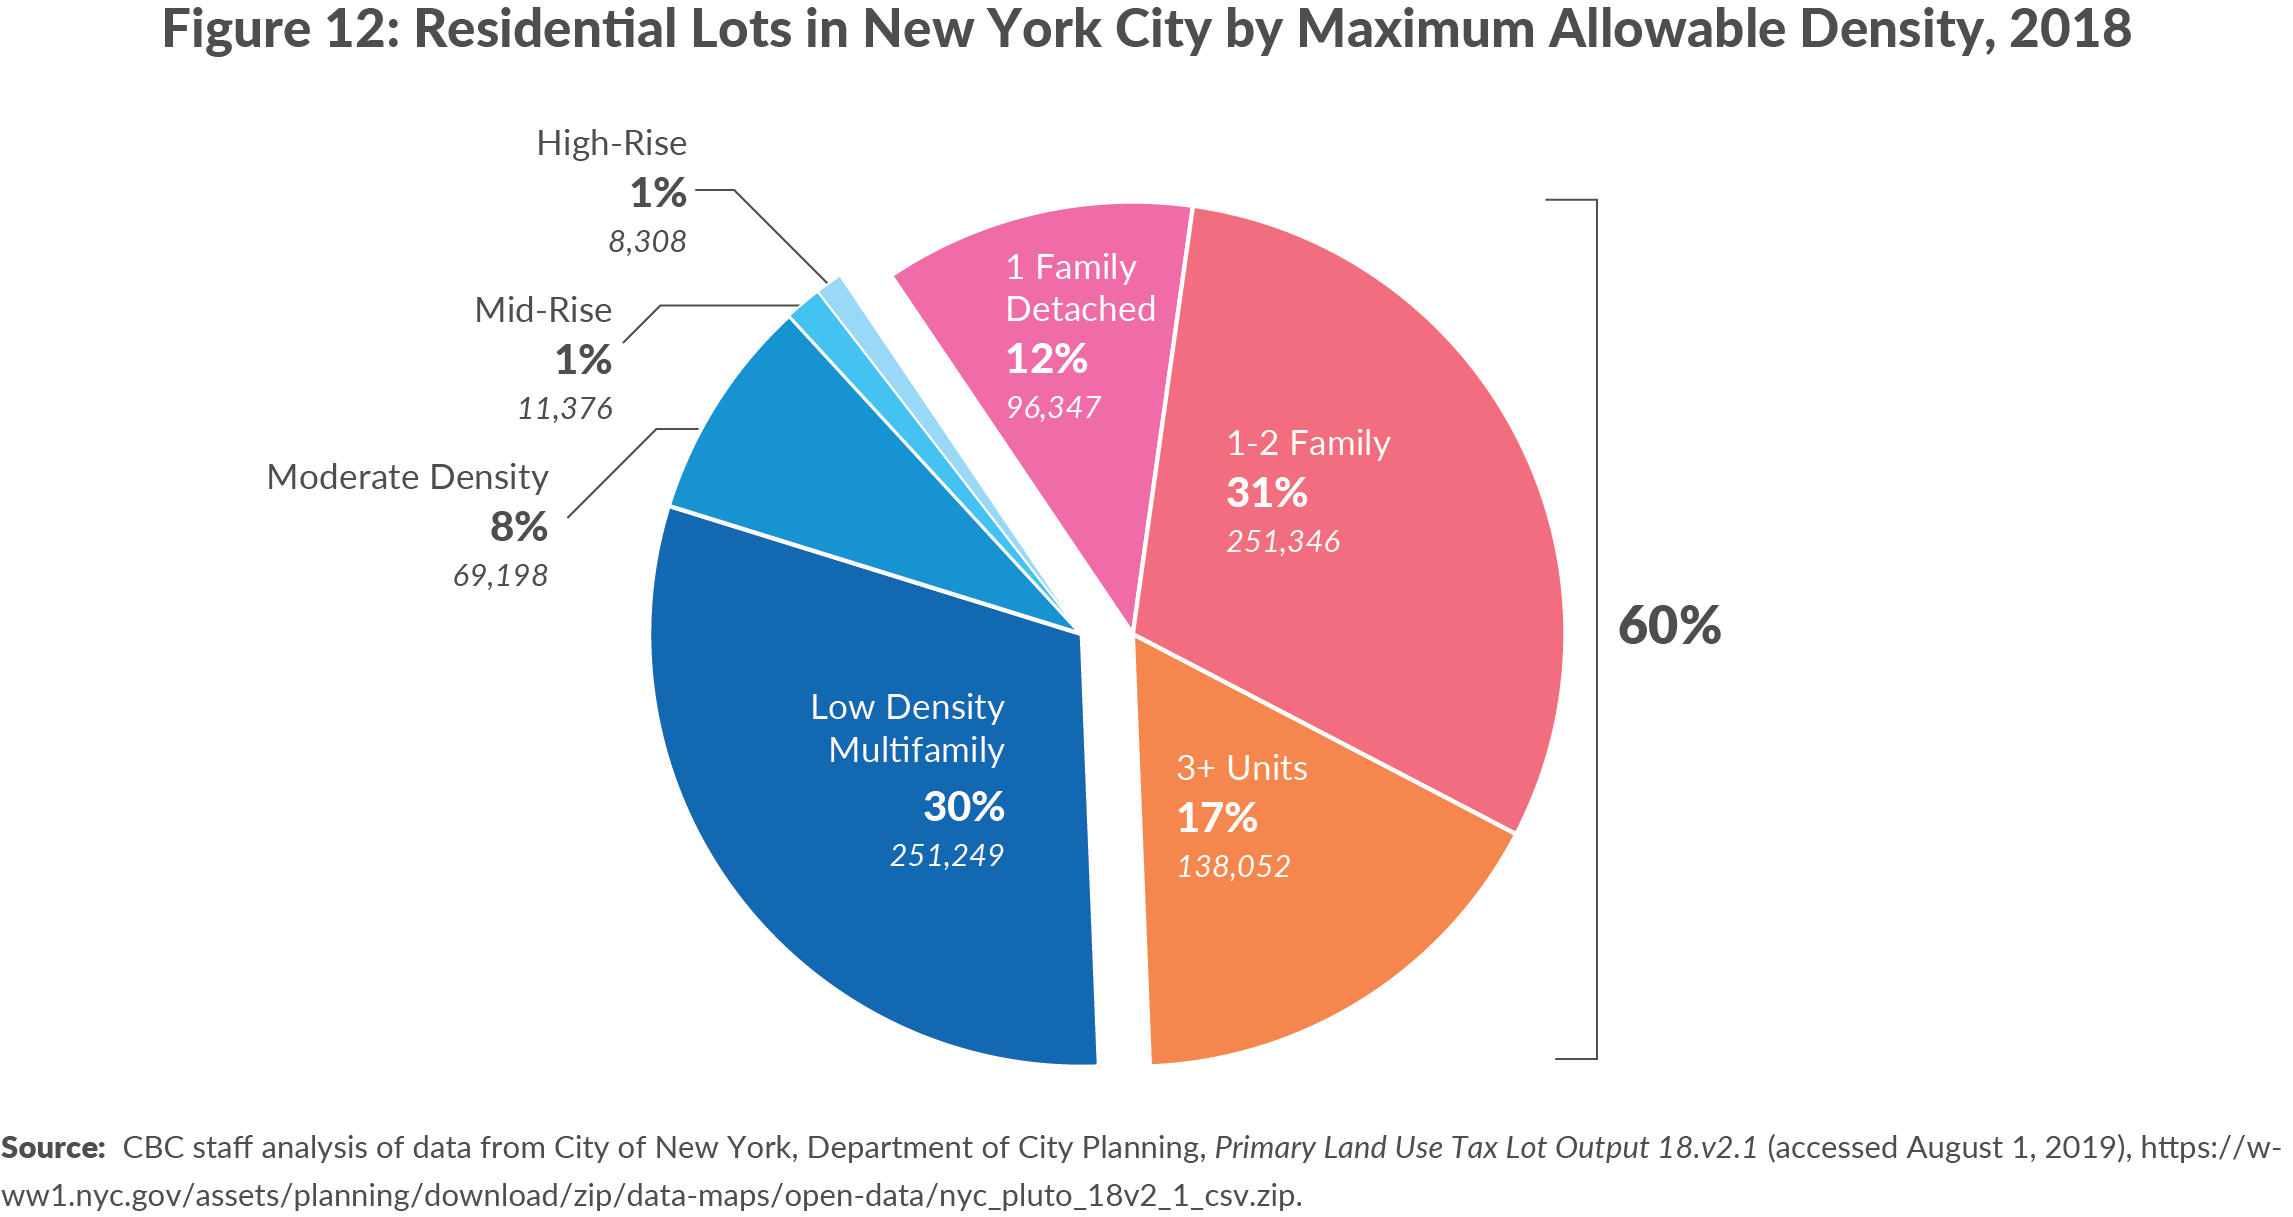
While some of this is due to the size of existing buildings, the more pressing reason is few residentially zoned lots in New York City are zoned for dense development. Almost 60 percent of the city’s residential land is located in the lowest-density zoning districts, which allow developers to build housing ranging from single family homes to semi-attached duplexes to very small multifamily buildings. Most of these lots allow only single family detached homes (12 percent) or no more than 2 units (31 percent). Very small multifamily buildings area allowed on 17 percent of lots. Another 30 percent of lots are zoned for lower-density multifamily buildings. Only 10 percent of lots are zoned for moderate-to-high density multifamily buildings. (See Figure 12.)
Not all lots that are built to less than the maximum allowable density may be economically feasible to develop. Even a 50 percent increase in density may not justify the costs of development, particularly in cases where properties have existing buildings or where lots are small, oddly shaped, or face other development constraints.
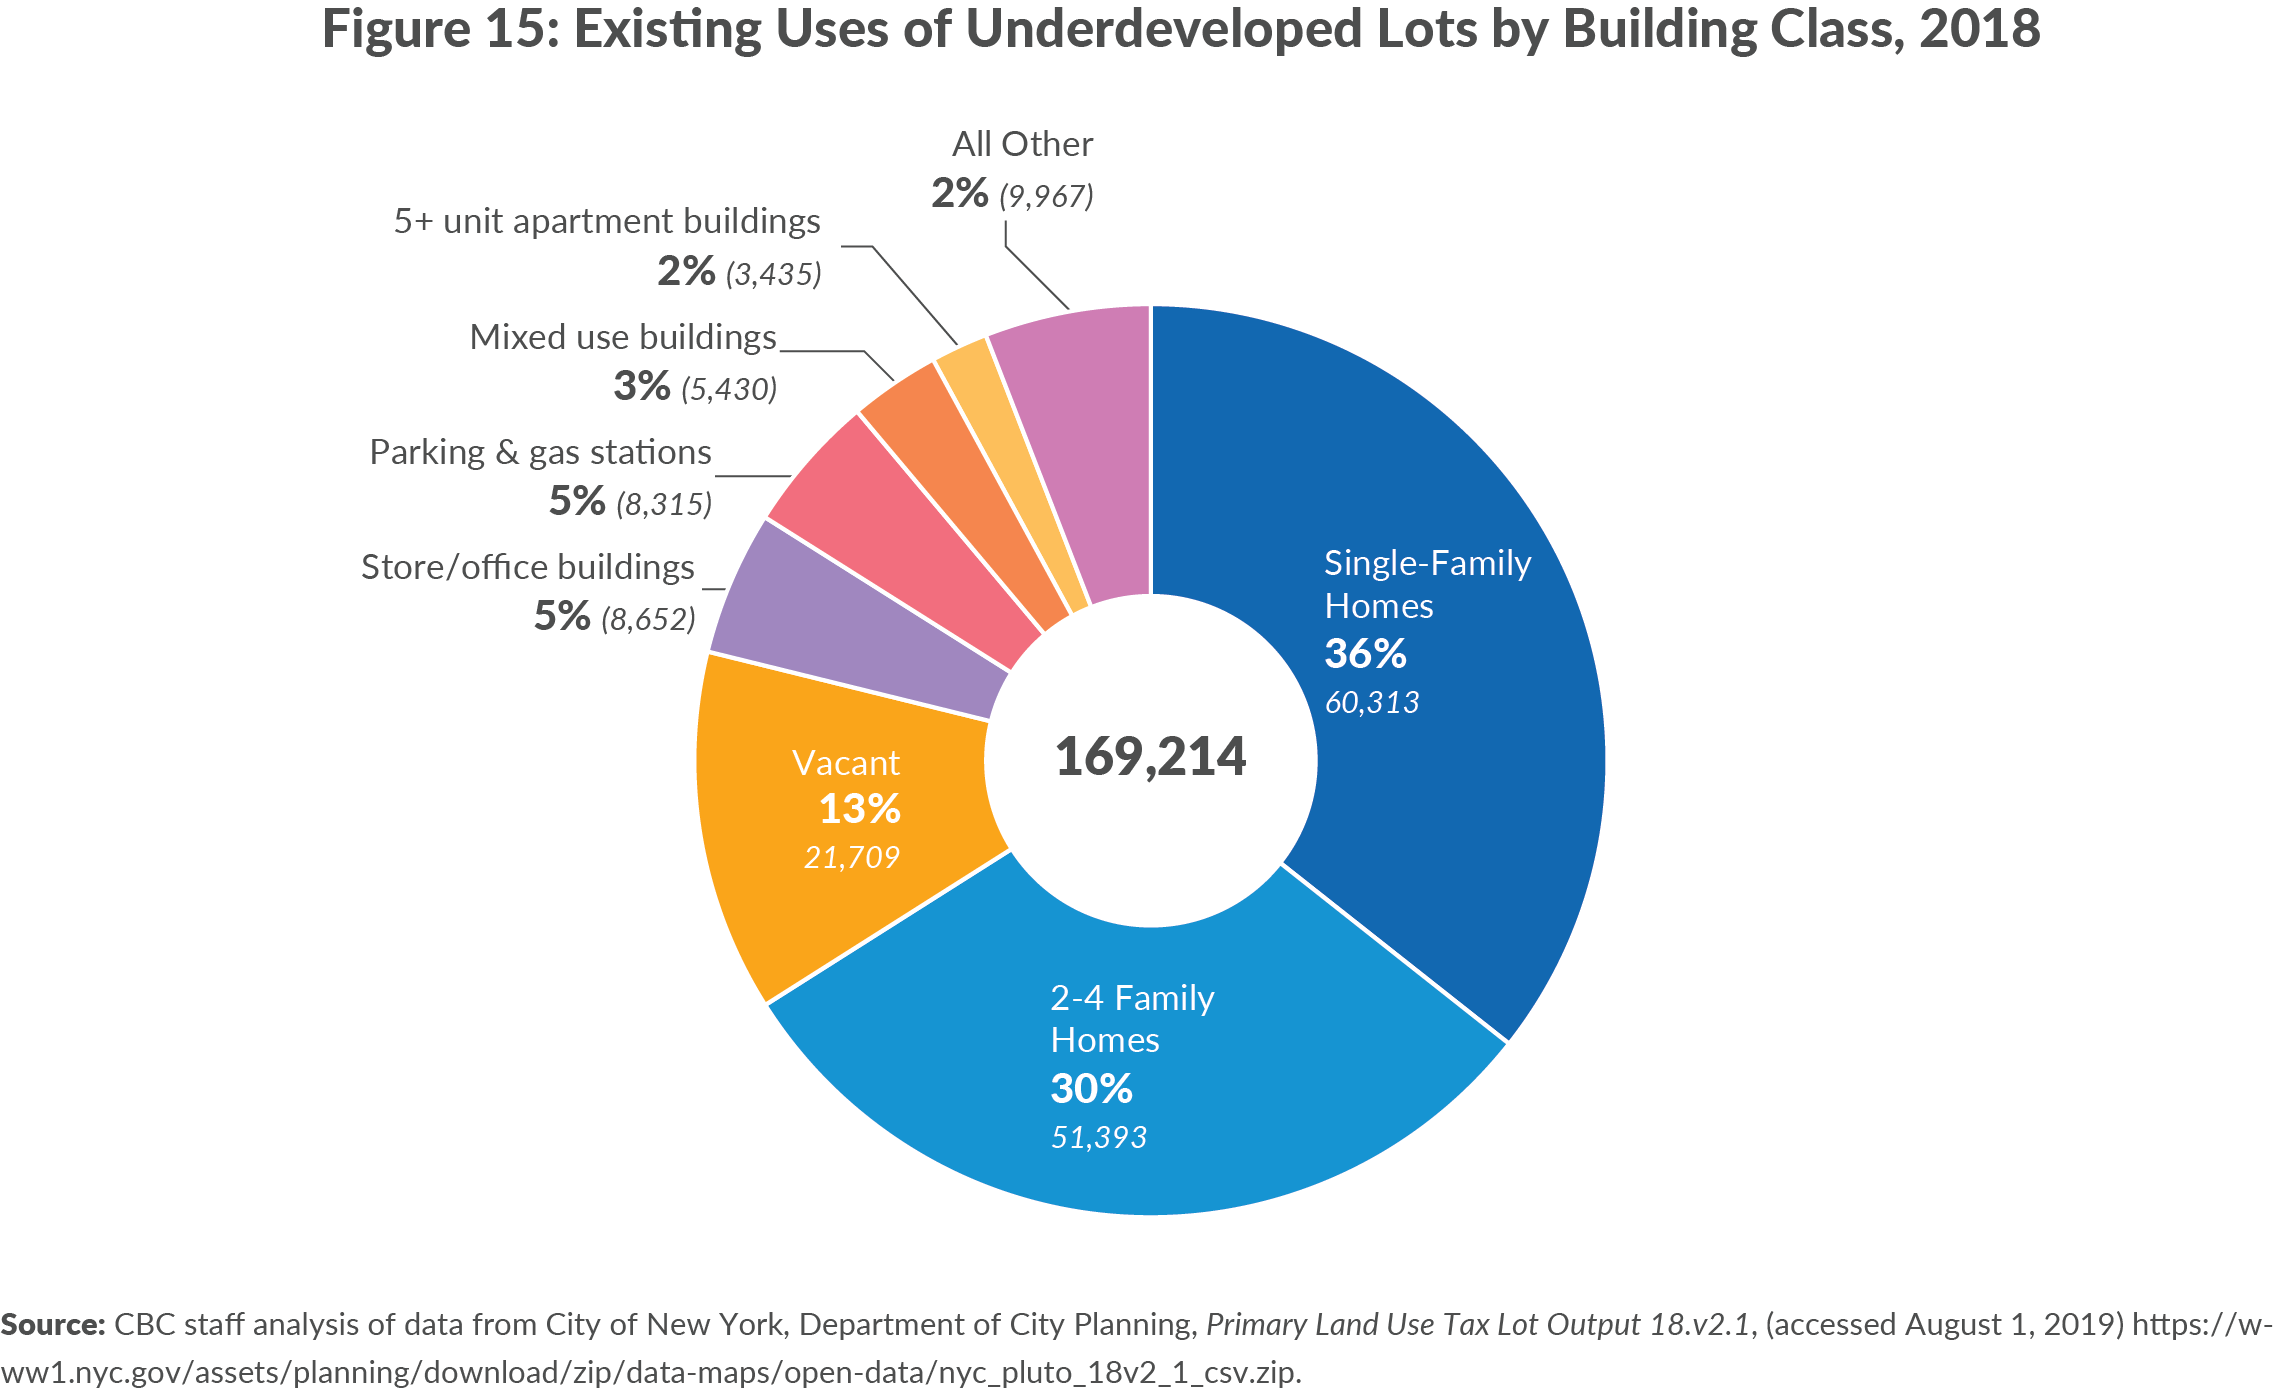
As more of the City’s vacant land gets developed, an outsized share (87 percent) of potential development sites are properties with existing structures or uses. Thirty-six percent of development sites are currently occupied by single family homes, and another 30 percent by two- to four-family homes. Just 13 percent of potential development site are vacant. (See Figures 14 and 15.) Apartment buildings make up a small portion of potential development sites, though they are difficult to redevelop, particularly if they contain rent regulated units.
Vacating and demolishing existing buildings prior to development is an expensive and time-consuming process and is in addition to the high cost of new construction. If the future value of a new building is less than a property’s existing value, after accounting for construction costs, property owners will not redevelop their lots.
Uneven Distribution of Potential Development Sites
There is also a wide disparity in zoning capacity among neighborhoods in New York City. Many middle-income and high-income neighborhoods have few potential as-of-right development sites, which is a major contributor to the city’s uneven development patterns. The scarcity of potential development sites in high-income neighborhoods like Park Slope or Greenwich Village resulted in low rates of new development and has likely increased prices for existing homes in these neighborhoods—costs that are ultimately passed onto renters and home buyers. (See Appendix C for a full list of the share of residentially zoned lots in each community district that are potential development sites.)
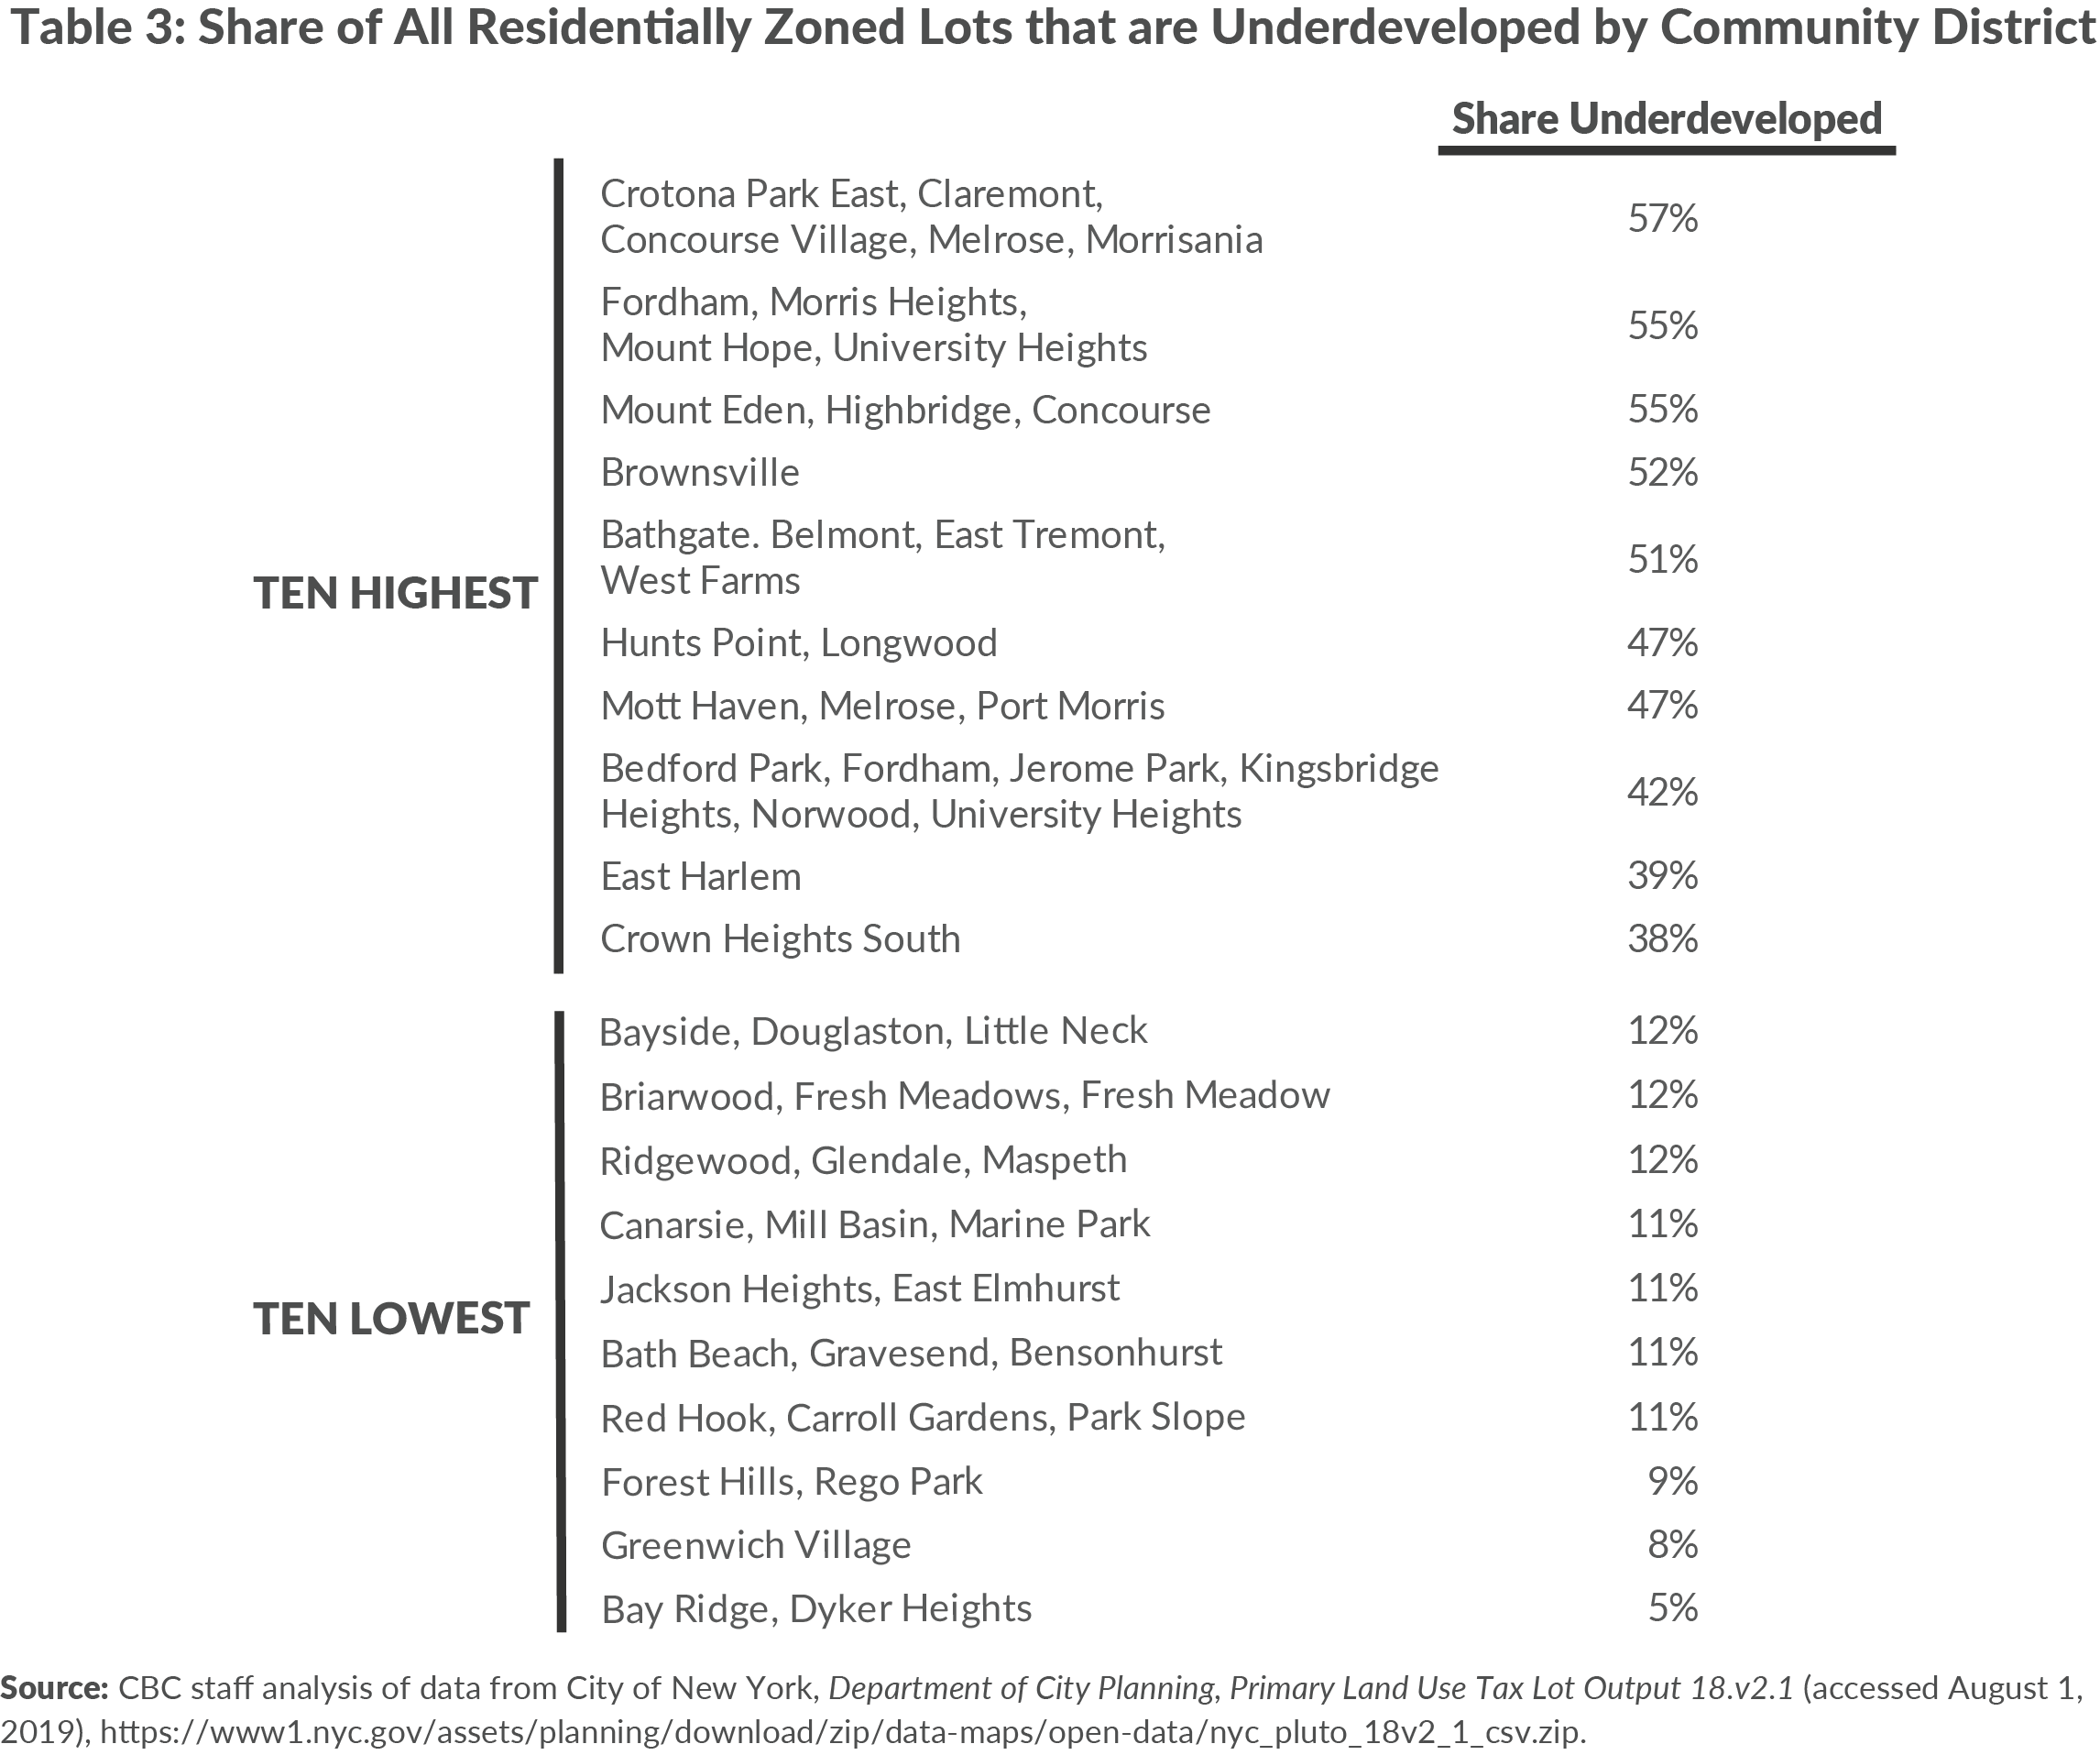
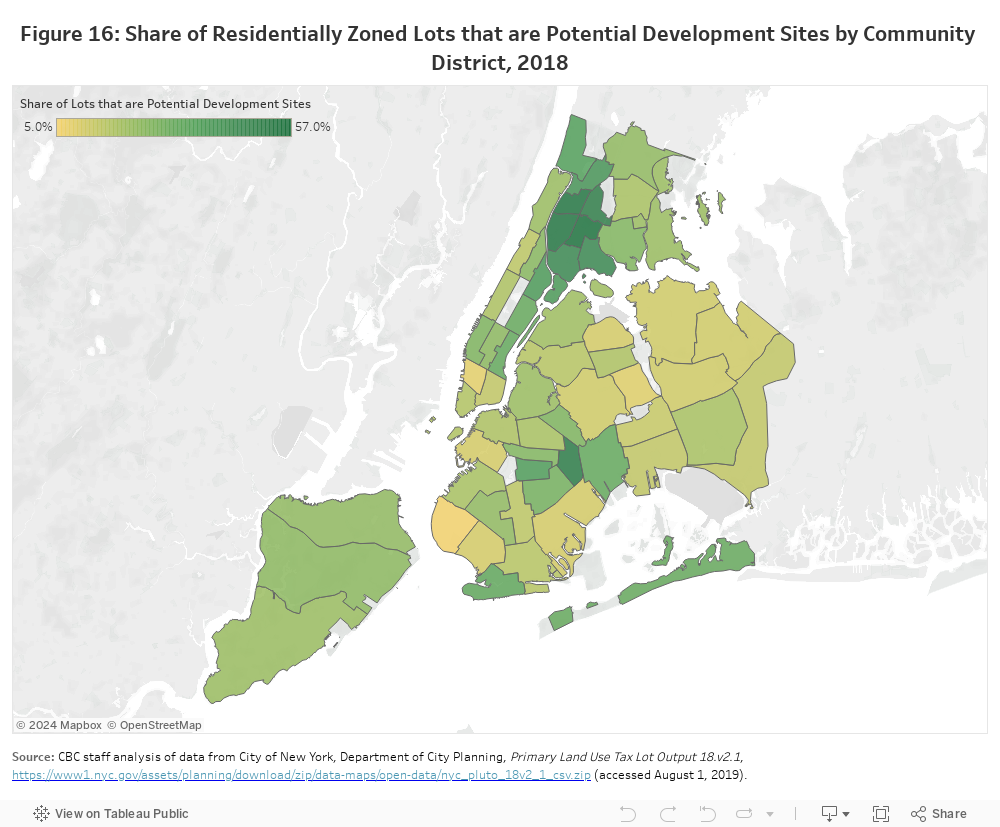
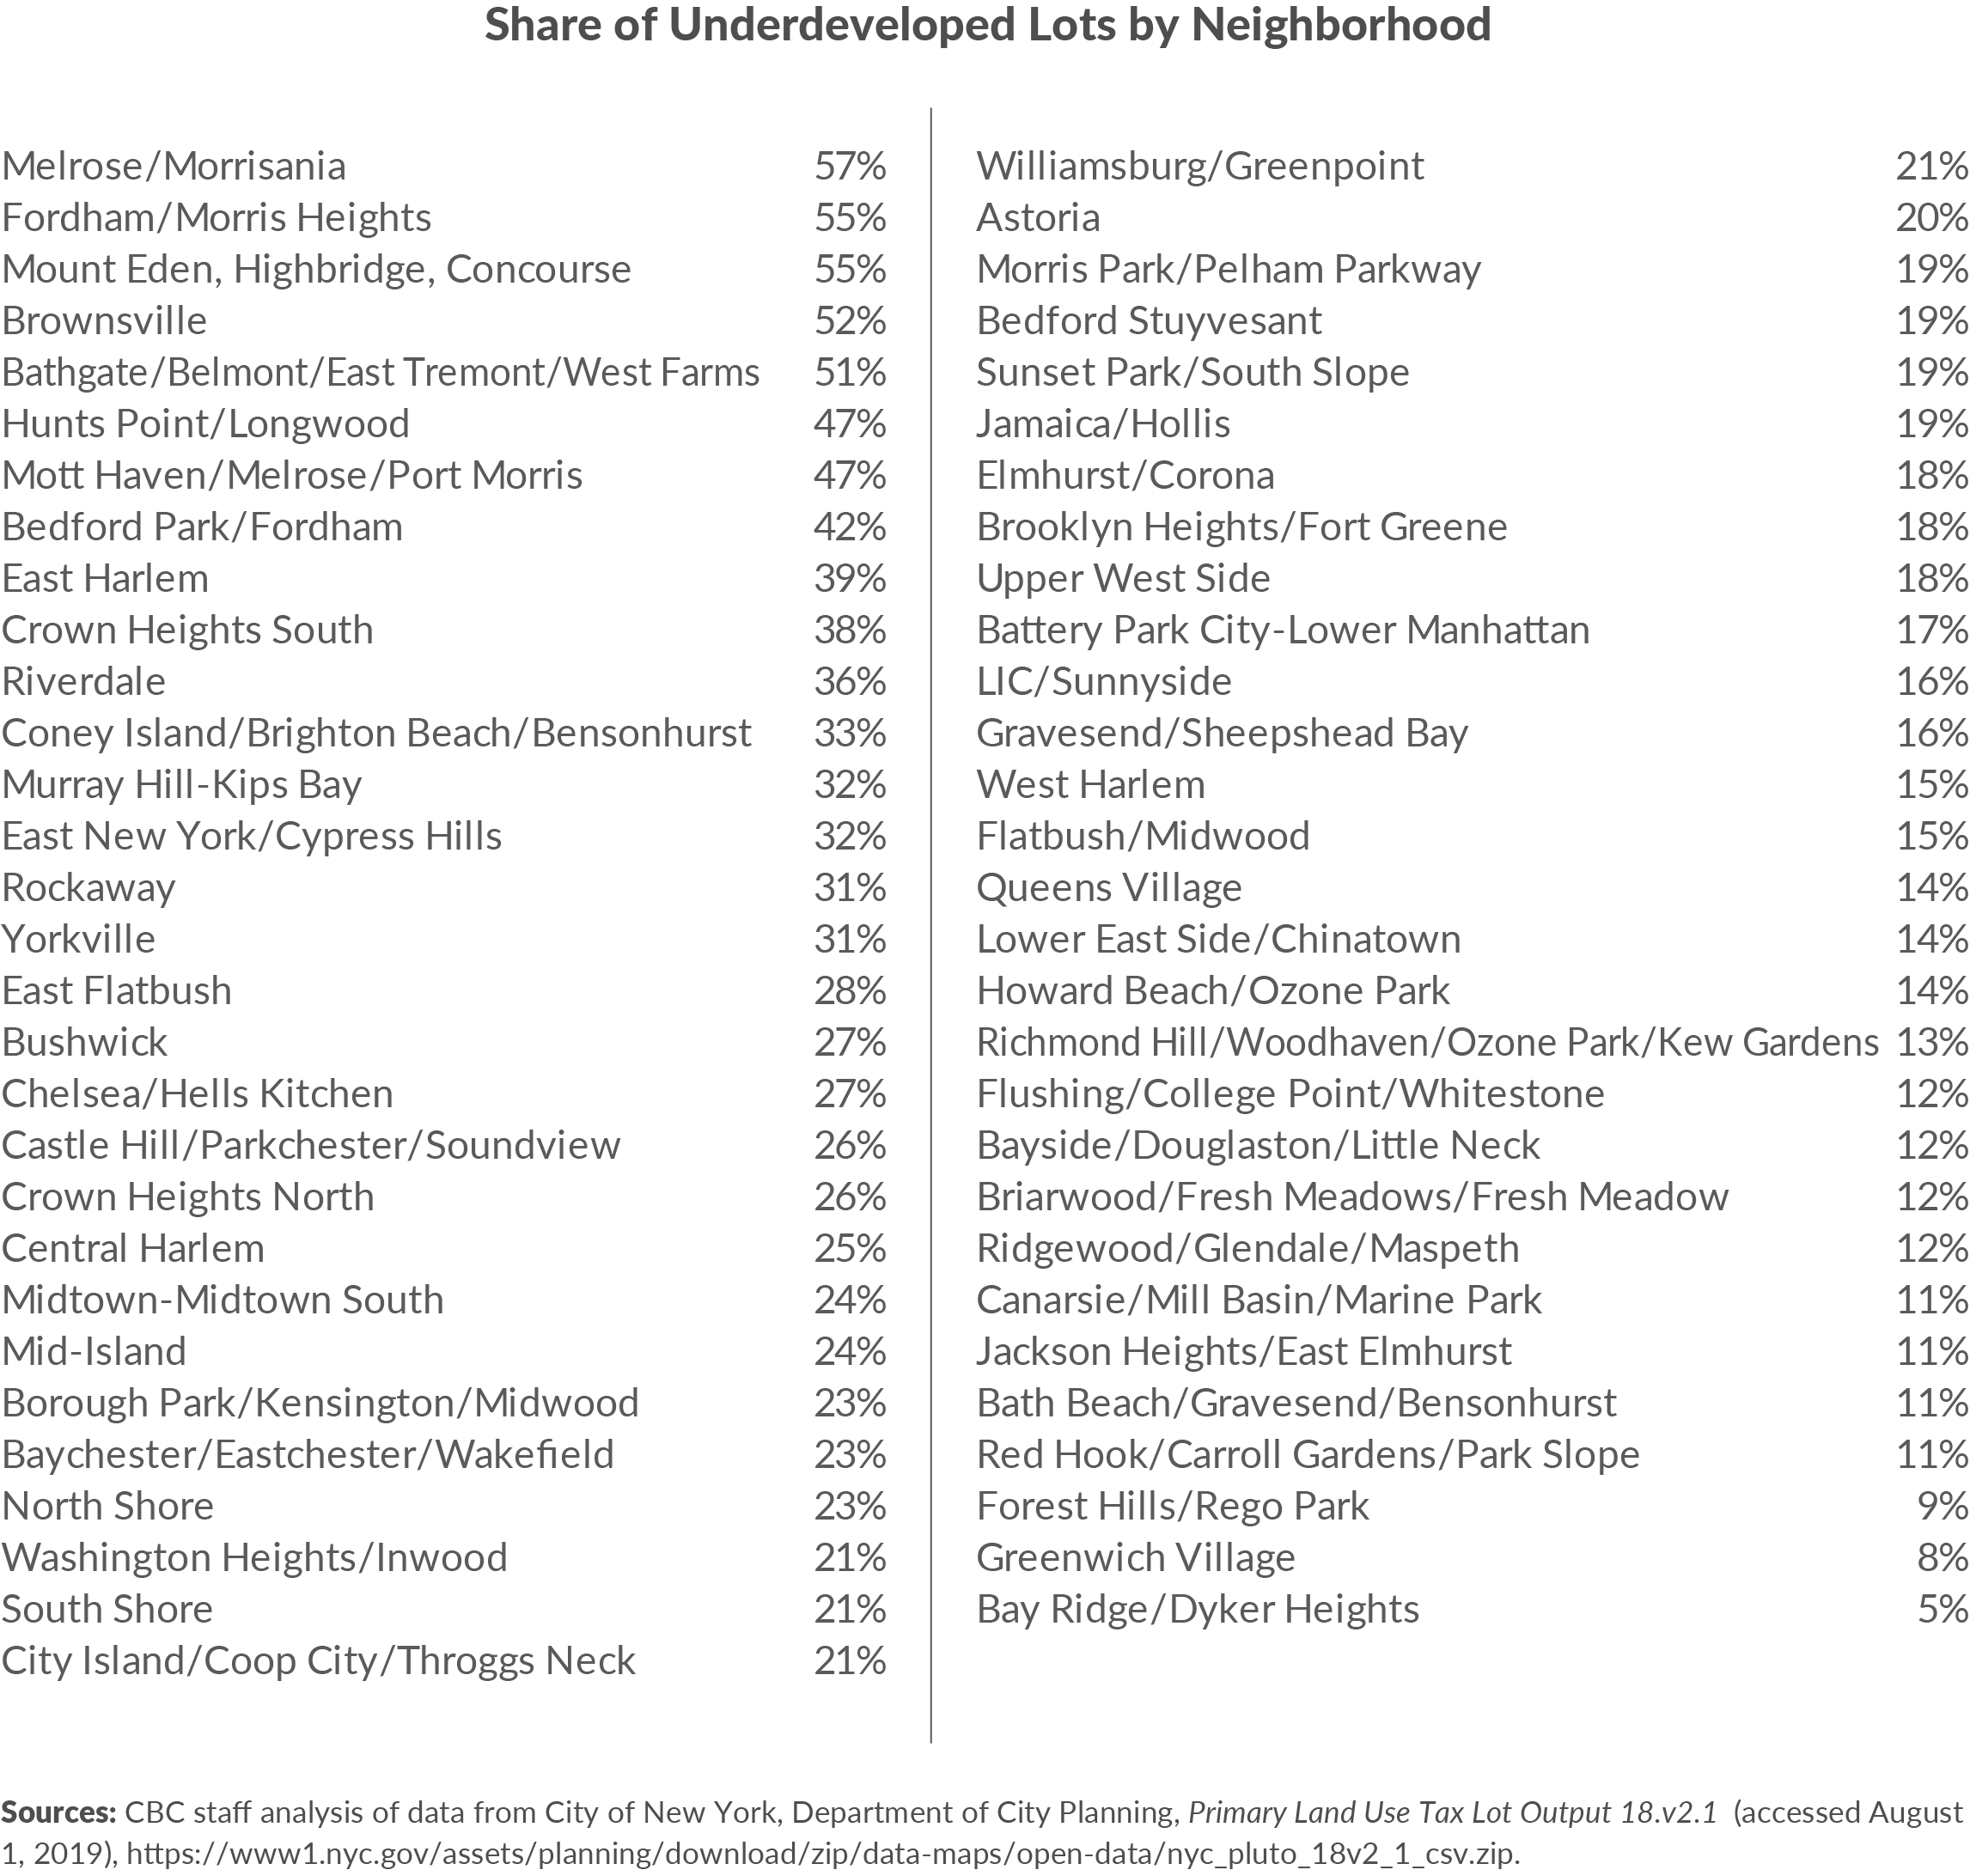
In contrast, the neighborhoods with the most potential development sites are concentrated in neighborhoods in the Bronx and Brooklyn. In these areas as many as half of all residential lots are underdeveloped. In the lowest-ranking community districts approximately only 1 in 10 residential lots is a potential development site under current zoning rules. (See Table 3 and Figure 16.)
Lots are Small or Oddly Shaped
Lot assembly is another significant impediment to development, particularly in areas of the city zoned for dense development. More than 20 percent of underdeveloped lots are irregularly shaped, which DCP defines as anything other than rectangular.20 Other underdeveloped lots, particularly in higher-density zoning districts, are too small to accommodate a dense building even if it is allowed as-of-right. These small or oddly shaped lots need to be combined with adjacent lots to become large enough to develop, a process that can costly and time consuming if a developer has to purchase lots from multiple owners. (The 2016 Zoning for Quality and Affordability reforms make it easier to build on small and irregular lots, though it is too soon to tell whether these changes have led to more development.)
High density development, in particular, requires large lot sizes and building footprints, but many potential development sites in these areas are too small to build on. In the highest density zoning districts, the average underdeveloped lot size is 5,766 square feet, while existing buildings built at comparable density levels have average lot sizes of over 15,000 square feet.21
This gap exists in part because of regulations that make it difficult to build dense residential buildings on small lots, including the zoning code’s rules about setbacks and open space and New York State’s longstanding law that limits residential buildings to a maximum FAR of 12. This effectively caps the height and density of apartment buildings in New York City. Many developers turn to zoning lot mergers, which transfer density from one zoning lot to an adjacent development site in order to yield enough density on the receiving development site to make new development economically feasible. These lot mergers emerged as an alternative to lot assembly partly in response to restrictions like the State’s FAR cap.
Increasing Prevalence of Historic Districts
Another factor that contributes to the lack of development sites is the increasing prevalence of historic districts. As of 2018 there were 149 historic districts throughout the city, containing approximately 4 percent of the city’s residentially zoned lots. The designation of historic districts reduces new construction activity in part because redevelopment projects in these districts must secure discretionary approvals from the Landmarks Preservation Commission even if they can be built as-of-right. 22
However, in many historic districts, there are few potential as-of-right development sites despite these additional restrictions. Residential lots located in historic districts are significantly less likely to be potential as-of-right development sites than lots located outside districts: only 12 percent of residential lots within historic districts are underbuilt relative to their underlying zoning districts as compared to 21 percent of lots located outside historic districts. In many of the largest historic districts, the rate is even lower. For example, only 4 percent of residential lots in the Park Slope Historic District, and 6 percent of lots in the Greenwich Village Historic District are potential development sites. The zoning often matches the scale of the existing housing stock in these districts.
Failure to Increase Zoning Capacity to Keep Up with the Rising Demand for Housing
The City’s zoning rules are the framework upon which the city’s future growth lie and should ensure housing stock keeps pace with population and economic growth. In most of the city, the prevalence of low-density zoning districts dates back to 1961, when the current zoning resolution was introduced. City officials have passed some citywide zoning changes since then, most notably with the passage of the Quality Housing program in 1987 and the recent Zoning for Quality and Affordability (ZQA) update in 2016. However, over the last three decades, most changes to the zoning text and map have taken the form of neighborhood-level rezonings.
Most of these neighborhood-level zoning changes occurred during the Bloomberg Administration. Between 2002 and 2013 City officials approved 120 zoning actions that rezoned 37 percent of the city’s land area.23 Even so, the net impact of these neighborhood-level changes is that the City’s zoning code failed to keep pace with the needs of a growing city. The New York University Furman Center found 17.7 percent of the City’s land area was rezoned between 2003 and 2007, but residential capacity in those neighborhoods increased by only 1.7 percent.24 This period included most of the Bloomberg Administration’s signature zoning actions, including those that accommodated most of the residential growth in the following decade. Most rezoned areas were previously underutilized commercial districts or industrial waterfront areas.
Some rezonings were intended to modernize outdated zoning provisions or to promote development in areas where uses allowed as-of-right were outdated (such as the rezoning of manufacturing zones on the far west side of Manhattan and Williamsburg to allow for residential development). Other zoning actions decreased development capacity (“downzonings”) or made changes with the effect of limiting properties’ development potential even if they did not reduce a site’s theoretical development capacity (“contextual rezonings”).25
DCP and elected officials frequently supported these downzonings as efforts to stop what they considered to be out-of-context development or to preserve the existing single-family character of a neighborhood.26 Neighborhoods that secured downzonings and contextual rezonings also had higher rates of homeownership than neighborhoods where the City sought to increase density or that remained unchanged.27
These zoning changes affected where developers chose to build. Over the last decade, residential development has largely followed the pattern set by Bloomberg-era rezonings: neighborhoods zoned for growth captured new development, while those rezoned to stop development saw development activity fall off.
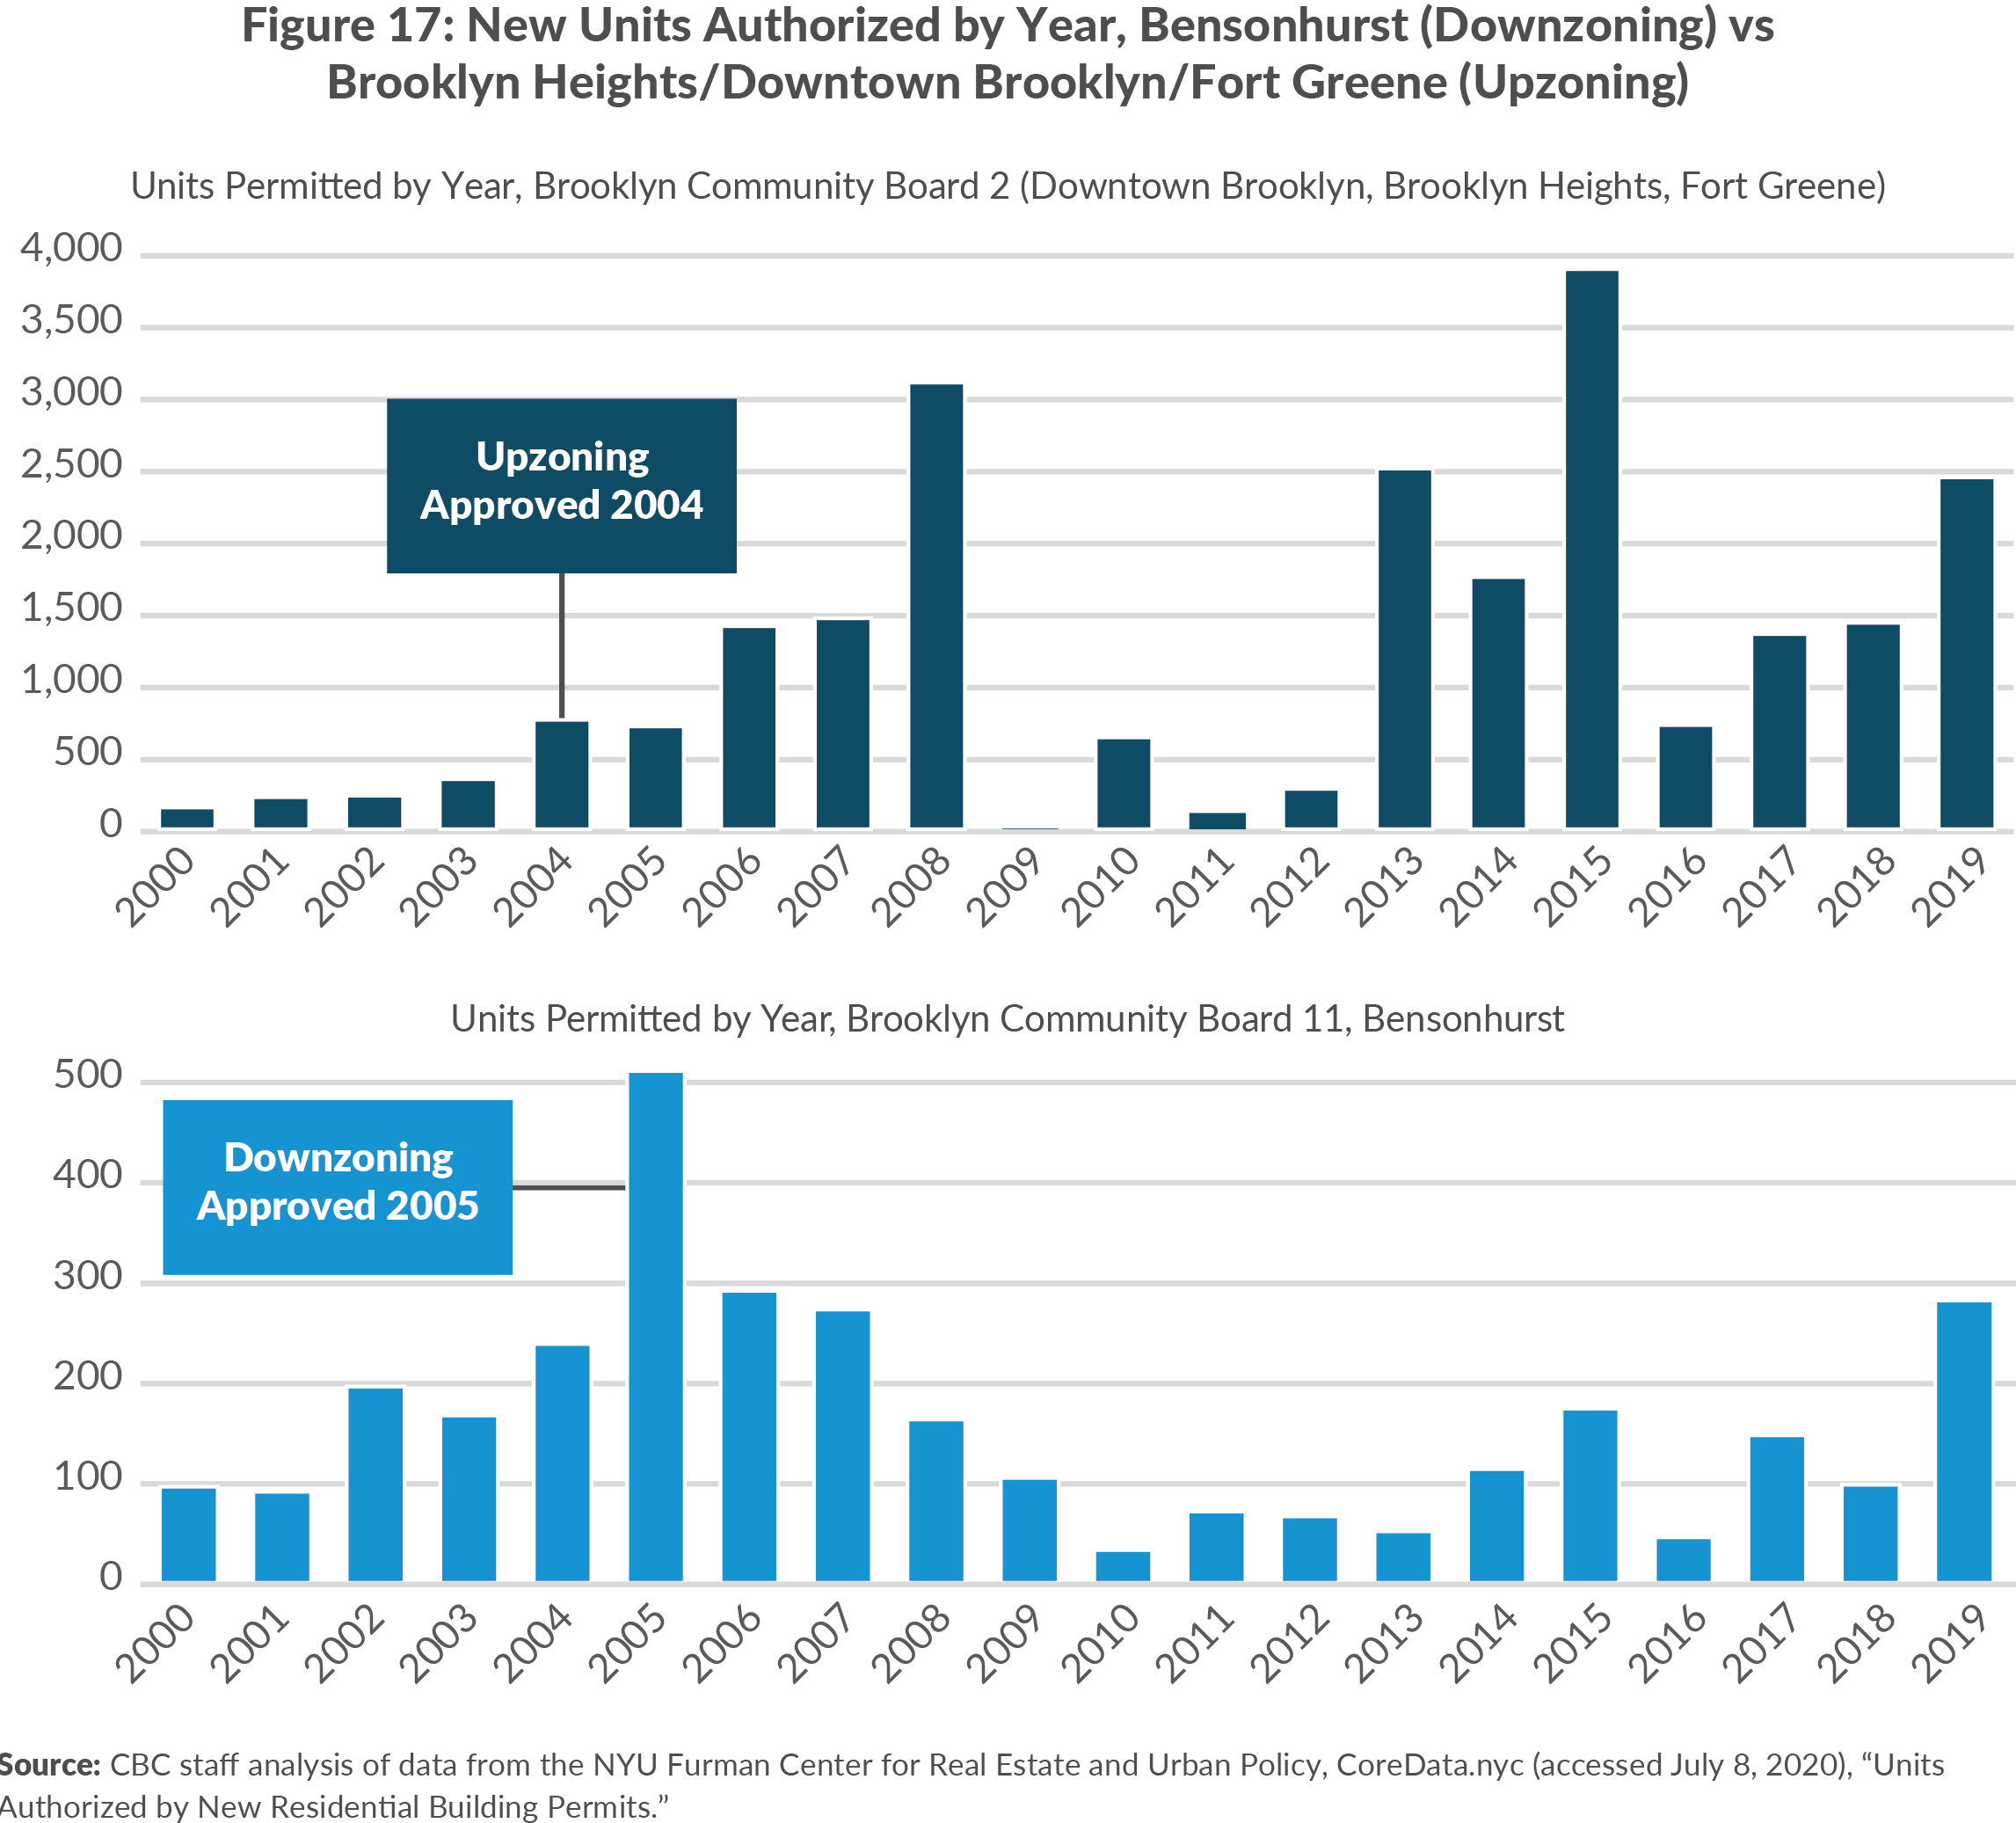
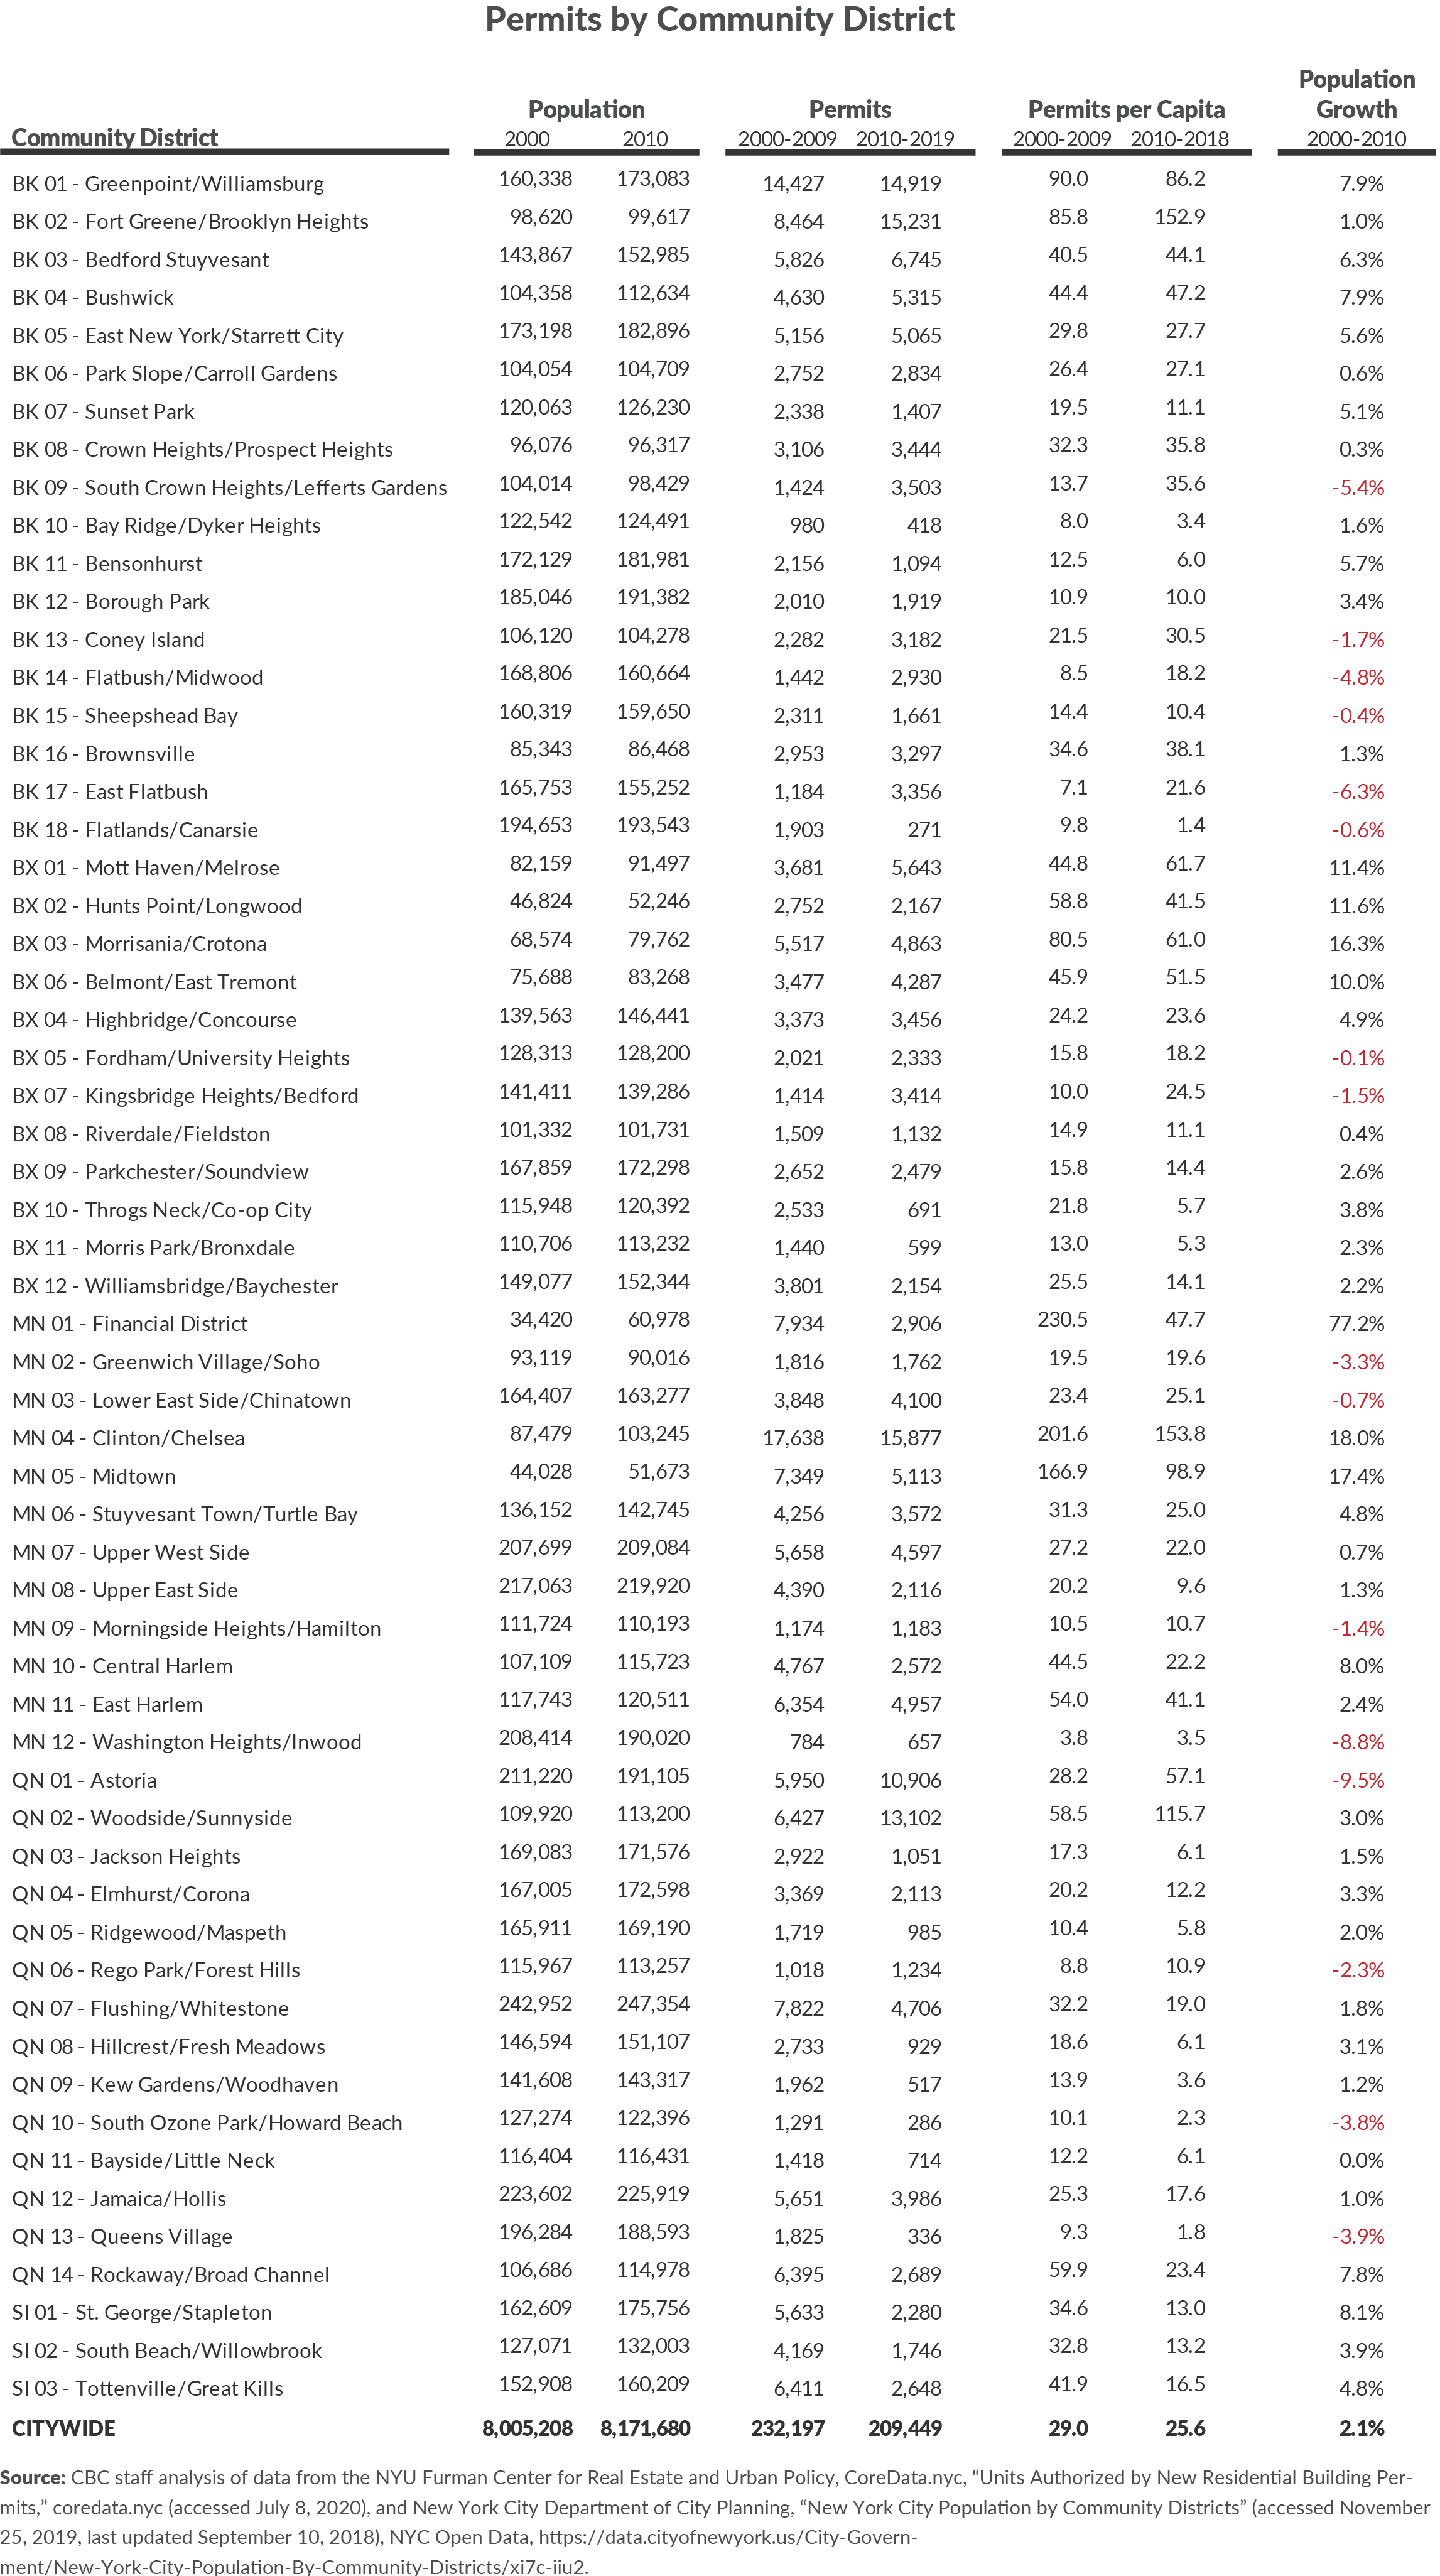
These trends are visible in the neighborhood-level permitting activity. Neighborhoods like Downtown Brooklyn that were rezoned for growth saw significant new development, while downzoned neighborhoods like Bensonhurst, which had a roughly equivalent volume of permitting activity as Downtown Brooklyn in the early 2000s before both neighborhoods were rezoned, experienced significant reductions in the already low number of new units permitted. (See Figure 17 and Appendix B for a comparison of housing production rates by community district between 2000-2009 and 2010-2019.)
These policy choices matter because zoning changes set the stage for the City’s future; actions taken today shape the growth of the city for decades to come. While the rezonings of Downtown Brooklyn, Jamaica, and other neighborhoods in the mid-2000s allowed tens of thousands of new units to be built, concurrent downzonings in places like Bensonhurst counteracted most of the increases in zoning capacity gained elsewhere.
Under the de Blasio Administration, the pace of rezonings has slowed significantly. The City Council has passed just six housing-focused neighborhood rezonings since 2014, all of which have focused on rezoning commercial land in lower-income neighborhoods with transit access to allow for the development of new affordable housing. And while the Administration halted the practice of downzoning neighborhoods, it has yet to rezone any higher-income neighborhoods to encourage the development of housing in high opportunity neighborhoods where there are currently few opportunities to build new housing.
As the neighborhoods rezoned for growth during the mid-2000s are increasingly built out, the lack of rezonings to boost capacity—particularly in highly desirable neighborhoods with the least existing capacity—will likely worsen the current supply crunch as the city’s economy recovers from the current recession.
2. High development costs
All aspects of development in New York City are expensive. The scarcity of as-of-right development sites and limitations on FAR in an already land-constrained city increases land prices. Complex regulatory and permitting rules add to legal fees and design costs.
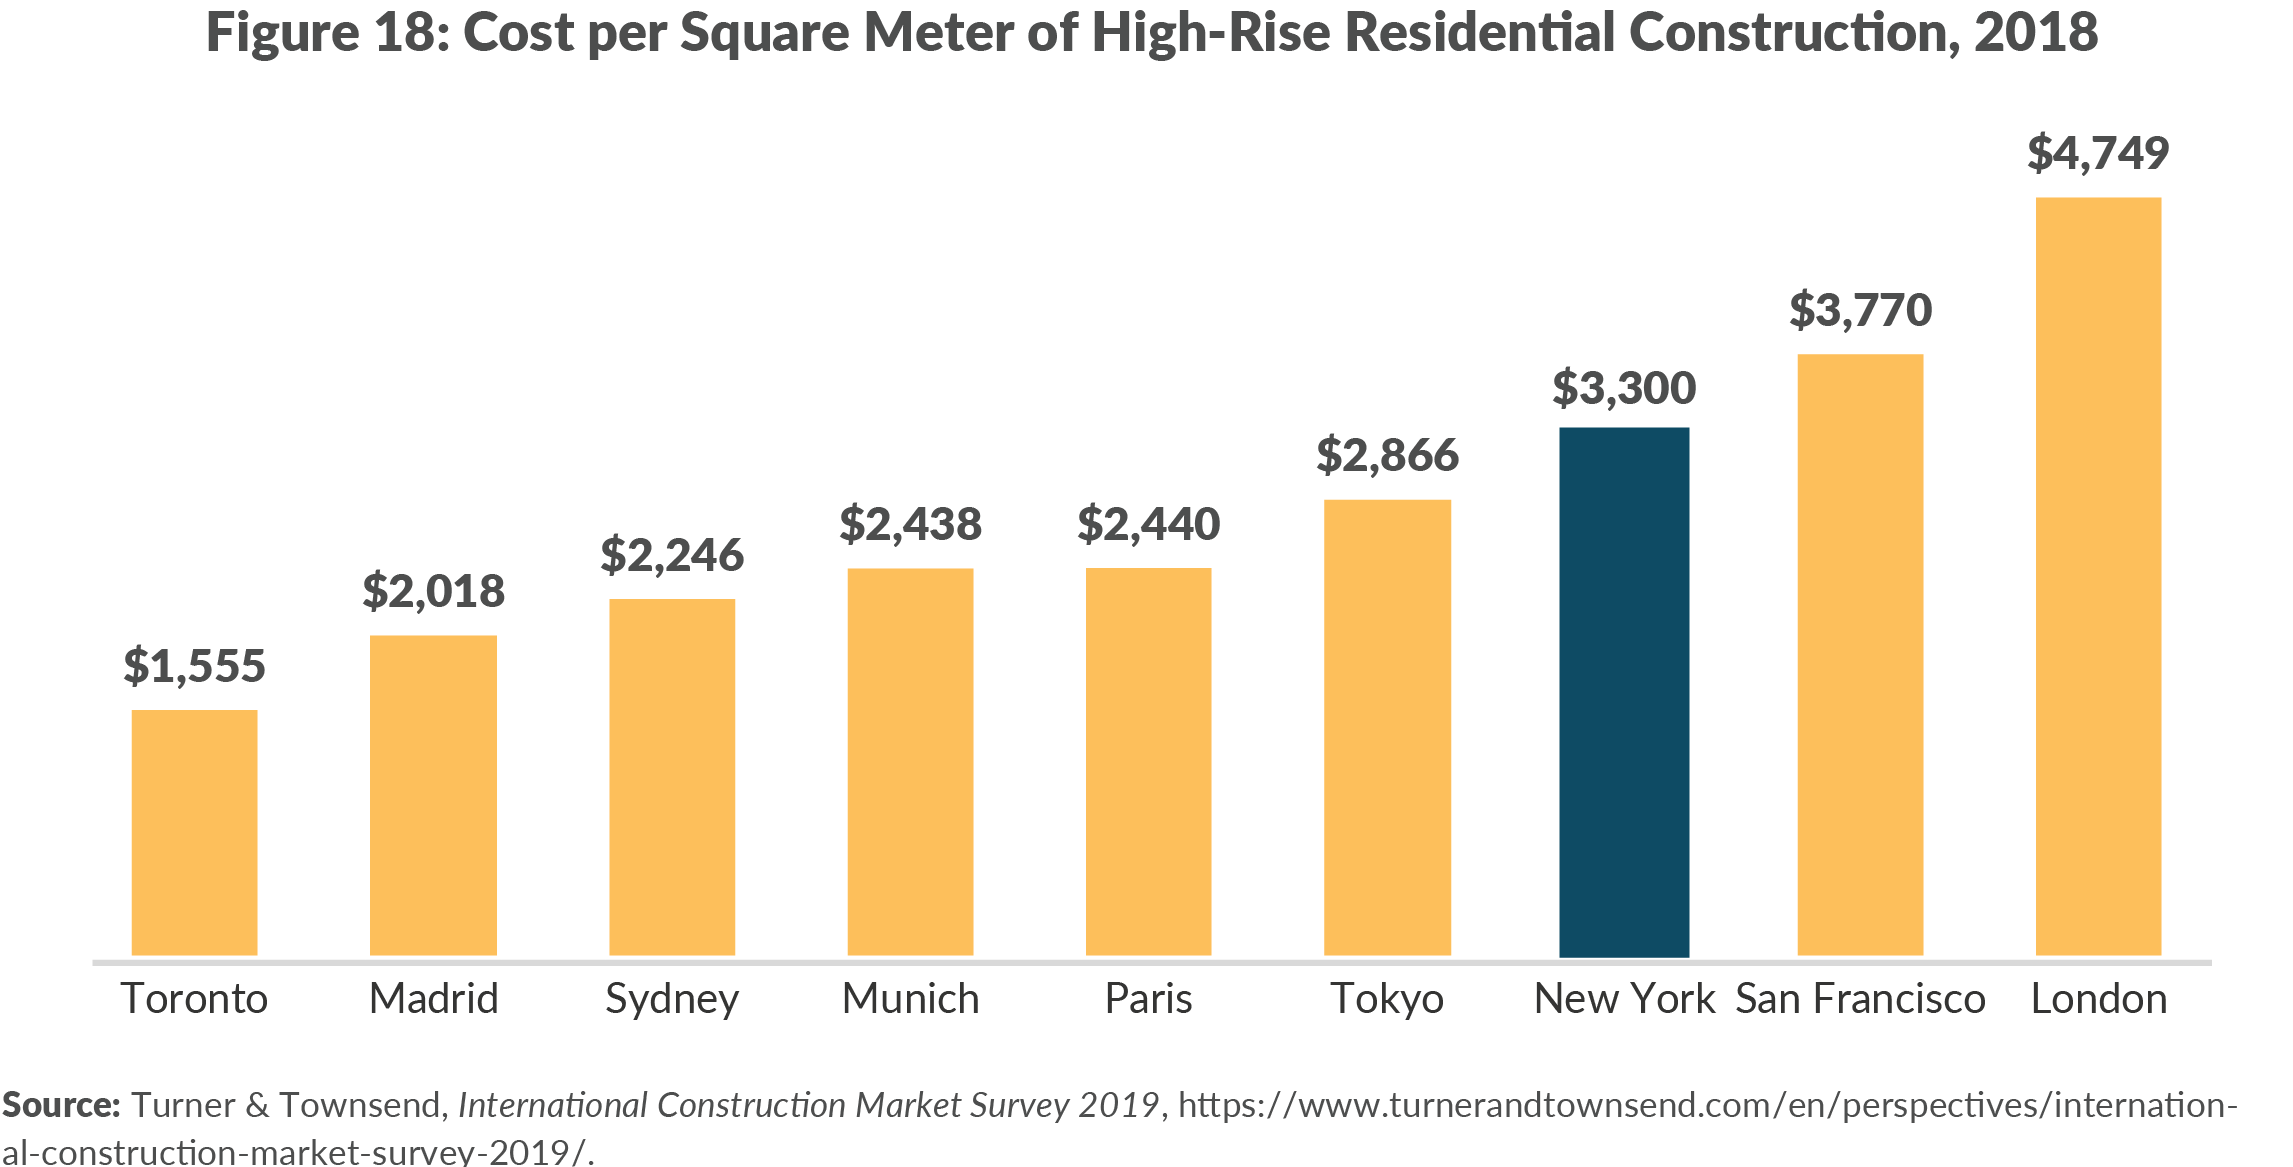
The cost of labor and materials in New York City, commonly referred to as hard costs, are among the highest among global cities.28 New York’s construction costs for high-rise residential development are a third higher than European cities like Paris and Munich and more than double Toronto. It trails only San Francisco and London, both of which require extensive design review and discretionary approvals for new residential projects. (See Figure 18.)
In addition, New York’s costs continue to increase at roughly 3 percent annually despite significant changes in the construction industry over the last decade.29 Non-union labor and open-shop construction now account for between half and two-thirds of development in the residential sector, and have increased significantly in recent years.30 Building code reforms and more plan reviewers at the Department of Buildings (DOB) have reduced the time it takes DOB to approve permits.31 The reforms passed under Zoning for Quality and Affordability reduced parking requirements in many areas of the City, particularly for affordable housing developments, and modernized many aspects of the zoning code to bring them in line with contemporary architectural trends.
A share of New York City’s high cost is attributable to the City’s construction codes. The City’s building code includes a near-prohibition on the use of wood-frame multifamily construction commonly used in other cities. The plumbing code largely conforms to international standards, but City legislation has modified these standards in ways that add costs, such as prohibiting use of plastic piping in buildings of six or more stories.32 New York City is one of six cities that require the use of metal piping in mid- or high-rise residential buildings.33 The electrical code requires the use of rigid metallic electrical conduits. Some of these requirements were initially well-intended but now may be outdated due to advancements in building materials and methods. All increase the cost of labor and materials.
In other cases, unique regulations significantly increase costs. New York State’s “Scaffold Law,” which assigns strict liability to the contractor for all gravity-related workplace injuries—unlike the comparative liability standard use in all other states—increases the cost of liability insurance. One study found that the law may increase total development costs by as much as 7 percent.34 The State’s Multiple Dwelling Law, which applies to buildings with three or more residential units, imposes requirements on small buildings that often make it uneconomical to build small apartment buildings or to add units to one or two family homes. The City’s building code also regulates multiple dwellings differently from one and two-family units.
Additionally, recent changes to the rent stabilization laws that limit owners’ ability to increase rents in line with expenses may also make it less attractive to build new market-rate rental housing in some neighborhoods. The current iteration of the Affordable New York 421-a tax incentive program requires all new market-rate units to be rent stabilized if their initial rents fall below a high-rent threshold (currently $2,816); units above the threshold rent are not subject to rent regulation. Rent regulation’s limits on rent increases may dissuade some development in middle-income neighborhoods where free-market rents are below the threshold but still high enough to justify new construction. Other recent changes to the rent regulation laws may also make it more difficult to redevelop buildings that contain rent regulated units.
3. Distortionary Property Tax System
The third factor in New York’s lagging housing production is that the City’s opaque and inequitable property tax system, which taxes multifamily rental properties at a significantly higher effective tax rate than single-family homes, condominiums, and cooperatives. According to an analysis conducted by the Lincoln Land Institute, New York City’s classification ratio, or the difference between the effective tax rates on apartments and single-family homes, is 2.55, which is the second highest among large cities in the United States.35
The high effective tax rate on multifamily rental properties—and particularly on buildings of 11 or more units—requires that a significant share of a building’s income goes toward paying taxes. Depending on a building’s size, age, and amenities, property taxes make up one-quarter to one-third of many buildings’ annual operating expenses before reserves, debt service, and profit.36 The high tax rate also makes it more difficult to finance new buildings, particularly in moderate-income neighborhoods where the market may not support the rents needed to justify new construction projects.
To compensate for the high tax rate for multi-family buildings, the City offers property tax breaks to encourage the development of new rental buildings. Given the high cost of construction and the high tax rate, rental properties outside of the Manhattan core often are not financially feasible without tax incentives.37
The most commonly used program, Affordable New York (421-a), allows developers to secure tax exemptions of up to 35 years for qualified new rental buildings with six or more units. Exemptions are granted in exchange for setting aside a portion of the units as affordable housing, with the share and level of affordability dependent on a project’s location and size. Some small condominium projects also qualify for more limited tax benefits.38
While 421-a yields a significant number of affordable units, promotes mixed-income communities, and helps mitigate displacement pressures, it also increases land prices. Previous studies on the 421-a program have found that the tax benefits are capitalized into the value of land, which increases total development costs.39
The 421-a program also includes significant inclusionary housing requirements. To receive property benefits, most rental properties must set aside a certain share of units as affordable housing. This means that the rent from market-rate units (along with the tax break) subsidize units that developers are required to lease at below-market rents. This cross-subsidy can increase market-rate rents by at least 15 percent, depending on the share and level of affordability.40 (These affordable requirements are also factored into land values. A portion of the increased value in land created by the tax breaks helps pay for affordable set-asides.) Given that an increasing share of new units are built in mid-rise and high-rise rental buildings, this upward pressure on market-rate rents puts an increasingly large share of units out of reach for most households.
The 421-a incentive comes at a high price to taxpayers. Since exemptions last for decades, the cost of the program compounds over time. In fiscal year 2019 71,095 exemptions cost $1.6 billion in foregone City tax revenue.[41] That was equal to approximately 15 percent of the net tax levy billed to rentals, condominiums, and cooperatives in fiscal year 2019.[42]
The 421-a program also sunsets every five years, contributing to a boom-bust development cycle, in which developers rush to get projects approved under the current iteration of the program before it expires. As a result, new residential development often starts in response to changes in tax policy rather than market demand. For example, the spike in new building permits in 2015 was caused in part because 421-a was set to expire at the end of that calendar year.
These incentives also distort the housing market by encouraging certain types of housing production that qualify for tax benefits while discouraging projects that do not. Changes to City’s tax code, for example, have made it less attractive to develop two- and three-family homes. The 421-b tax incentive, which offered a partial property tax exemption for new owner-occupied single-family and two-family homes, expired in 2011, while the minimum size for 421-a projects increased from three to four units in December 2007 and later was increased to six units.
Combined with the City’s downzonings and contextual rezonings, these tax policy changes may have contributed to a significant drop in the development of two- to four-unit unit properties. Between 2000 and 2009 units in these buildings represented 28 percent of all permitted units. Since 2010 that share has fallen to 7 percent. Developers are also significantly less likely to build four- to six-unit properties than either one- to three-unit properties or larger buildings, as the addition of a fourth unit bumps a building from Class 1 to Class 2, which has a significantly higher tax rate. Adding a third unit also triggers additional requirements under the Multiple Dwelling Law.
RECOMMENDED NEW YORK CITY AND STATE ACTIONS
New York needs more housing of all types and at all scales in both the city and in the suburbs. While, there is no single policy that can simultaneously boost housing production and moderate housing price increases, the City and State can implement a number of policy changes to increase the supply of housing.
City actions
1. Plan for Growth with a Comprehensive, Citywide Housing Strategy
Like peer cities that build more housing, New York City should have a comprehensive citywide plan that quantifies the city’s current and future housing needs at all market segments, identifies the gap between these needs and existing zoning capacity, and sets ambitious but achievable citywide production goals, including by market segment. While various strategic planning documents have discussed the importance of housing supply, there have been few comprehensive efforts to translate the strategic planning goals into action.
New York City should create a housing plan based on a citywide housing needs assessment that includes production and preservation targets for all segments of its housing market. The plan should identify production goals for both market-rate and income-restricted housing and identify strategies for ensuring that all neighborhoods, including those that currently have few potential development sites, can help meet the citywide need.
Boston and Washington, D.C., both of which built housing at a faster rate than New York despite facing similar constraints, have issued housing plans with ambitious production goals grounded in market analysis for every segment of the housing market and include steps necessary for implementation. The plans embrace the need for growth but focus on setting the terms on which it would occur.
Boston’s Housing a Changing City: Boston 2030 plan, which was first released in 2014 and has been updated annually, set a goal of building 53,000 new units, including targets for low-income households, middle-income households, market-rate units, senior housing, and student housing. It also had separate strategies for preserving existing affordable housing, reinvesting in public housing, and protecting vulnerable renters. Boston officials increased the goal to 69,000 new units in 2018 after the city’s population began to grow faster than anticipated. Through October 2019 Boston approved more than 30,000 new housing units under the 2030 plan, of which 20 percent were income restricted. This rate of growth helped keep rental prices flat over the previous 18 months.43 Rather than retreating from new development, Boston officials devised a plan to accommodate growth while also addressing affordability concerns.44
In May 2019 Washington, D.C. released Housing Framework for Equity and Growth, a plan to build 36,000 new residential units through 2025, with 12,000 reserved for low-income residents.45 It also called for the preservation of an additional 7,200 existing affordable units. Recognizing the rapid pace of development, District officials instead devised a strategy to ensure that the city would continue to grow within a framework that ensured that growth would be orderly, fair, and equitable.
Unlike Boston and Washington, New York City historically has not undertaken housing needs assessments, translated them into market-wide production goals, and followed through with an implementation strategy that lived up to strategic planning goals. Both the Bloomberg and de Blasio Administrations’ affordable housing programs and long-range strategic plans identified the importance of increasing housing supply to accommodate population growth and address affordability concerns but fell short of quantifying how many units needed to be produced and at which market segments to accommodate the city’s growth. For example, the de Blasio Administration’s Housing New York plan set an ambitious goal of building or preserving 300,000 units of affordable housing but did not establish targets for how many market-rate units would be needed to accommodate future growth, or how those new units should be distributed throughout the city.
2. Zone for Growth by Updating the Zoning Code to Increase Capacity
The citywide housing plan should recommend revisions to the zoning code that the City needs to meet its housing production goals. A housing plan is only as good as its implementation strategy, and the City will not be able to reach higher production targets without zoning changes. The limited and uneven capacity for as-of-right development in New York City – both in terms of the number of potential development sites and the limitations on what can be built on those sites – is a primary contributor to the city’s lagging production rate. Increasing the pace of development will require a fundamental shift in the City’s approach to rezonings.
Over the past two decades, most residential upzonings have focused on allowing residential development in a limited number of underutilized commercial districts or on promoting the redevelopment of vacant land and buildings. To increase housing production, future rezonings will need to allow for incremental increases in density in a wider range of residential neighborhoods–including those occupied primarily by single-family homes and those that currently have few potential development sites.
The City also should reconsider contextual zoning districts. The two-decade long trend of trading increases in density for decreases in density has had the effect of cancelling out the gains in capacity realized elsewhere. Many of these downzonings had the intention of blocking the development of two- to four-unit buildings and small multifamily properties in predominantly one and two-family neighborhoods. These small multifamily units are affordable to moderate- and middle-income households and are needed to meet the demand for housing in the city. Given the high proportion of lots that allow no more than one- or two-family homes, this would require City officials to revisit zoning provisions that protect single-family neighborhoods.
In recent years, other cities have adopted citywide policies to encourage growth. Minneapolis passed a comprehensive plan that would allow for the development of three-unit buildings on all residential lots.46 Seattle increased density in 27 transit-accessible “neighborhood hubs,” many of which previously allowed only single family homes, and increased allowable densities in neighborhoods that already allowed dense development.47 Los Angeles took advantage of a state law that legalized accessory dwelling units to increase ADU production 30 fold, primarily in single family neighborhoods; ADUs now comprise 20 percent of the city’s housing production.48 While it is too soon to evaluate some of these initiatives, each of these cities that passed policies to boost supply were already producing more housing on a per-capita basis than New York.
While not without controversy, citywide approaches avoid the contentious, expensive and time-consuming neighborhood-by-neighborhood rezoning strategy, in which some neighborhoods make room for new development while others maintain zoning rules that block growth. In addition, a citywide strategy avoids New York City’s custom of giving deference to Councilmembers on zoning changes in their districts, which has allowed individual Councilmembers to block projects and discourage proposals, including those that would have substantial citywide benefits.
Implementing similar ideas in New York City would require the City to leverage multiple strategies to increase production, such as: increasing density near transit and along commercial corridors; modifications to contextual zoning districts to allow for incremental growth and development; limitations on the use of historic district designations to limit as-of-right development; and regulatory changes to make it easier to build three-plus unit buildings as-of-right in all zoning districts citywide.
3. Modernize Outdated Building Code Provisions
The City should continue to revise outdated or unique code requirements that increase costs and adopt strategies to encourage construction industry innovation. Many of its building and construction codes are out of step with national standards, and New York City has been slow to allow construction methods and innovative materials and processes used in other cities.
State actions
1. Pass Laws to Encourage Municipalities to Zone for Growth
State lawmakers possess considerable, though rarely exercised, power over the laws that allow local governments to establish zoning and land use regulations. State governments in New Jersey, California, Oregon, and elsewhere have passed laws to combat restrictive zoning ordinances and to require local governments to zone for different types of housing. New York State lawmakers could require municipalities to zone for more housing, including multifamily residences, particularly in areas near commuter rail stations, or accessory dwelling units.
New Jersey has a state agency, the Council on Affordable Housing, which requires local governments to zone for growth and to meet fair share affordable housing goals established by the state.49 Its fair share housing law is one of the primary reasons why New Jersey suburbs build more housing than comparable towns in Westchester, Rockland, or Long Island. Oregon recently passed a law that would require most cities to allow two- to four-family homes on all residential lots.50 California has passed laws to legalize accessory dwelling units like backyard cottages or garage apartments in single-family neighborhoods, to make it significantly harder for local governments to downzone neighborhoods, and to streamline the approval process for affordable housing developments in cities that historically have used the land use review process to slow or stop otherwise viable projects.51
New York could adopt many of these policies to compel local governments, and especially the downstate suburban towns, to build more housing. Options for doing so could include establishing binding fair share housing goals; mandating that local governments zone for multifamily development near commuter rail stations; and requiring towns to allow duplexes, triplexes, or accessory dwelling units as-of-right.
2. Reform Laws that Disincentivize Housing Production
Some New York State laws unnecessarily increase the cost to build new housing. Amending the Scaffold Law to move from an absolute liability standard to a comparative liability standard for contractors’ liability insurance would bring New York in line with the other 49 states. Repealing the law that established a maximum residential floor area ratio would eliminate an arbitrary cap on building heights and density and would have the effect of creating additional land for development in the densest areas of New York City. Revising the Multiple Dwelling Law could make it easier to build small multifamily buildings in neighborhoods where regulations now incentivize developers to build one- or two-family homes.
Other policy changes can make it easier to convert existing buildings into housing. Recent proposals have identified the changes to zoning regulations and the multiple dwelling laws needed to legalize existing basement apartments and allow for second and third units to be added in existing one- and two-family homes.52 Others have called for changes to zoning rules and the State Multiple Dwelling Law to allow for the conversion of hotels into housing units and for the relaxation of restrictions on unit sizes to allow for more micro-housing and single-room occupancy units.53
Legislators also must monitor the impacts of recent changes to the rent regulation laws on new development activity, especially in middle income neighborhoods where market-rate rents fall below the high-rent threshold that subjects them to rent stabilization rules, to ensure that the changes do not have a counterproductive effect on new development.
Along with other actions, these actions would make it more feasible to build multifamily housing and reduce the per-unit subsidies needed to build affordable housing.
3. Pass Property Tax Reform
Albany should pass reforms to make the City’s property tax system more equitable and efficient. CBC supports reforms to the City’s property tax system that would reduce inequities and boost the supply of housing. In the past, CBC has proposed moving condominiums and cooperatives to Class 1 with one- to three-family homes and reducing the tax rate on Class 2 rental apartment buildings so that they are taxed at lower rates than utilities and commercial buildings.
These changes would make the property tax system more equitable and allow lawmakers to reform tax incentive programs like 421-a to make the incentives more efficient and better targeted.
CONCLUSION
Housing availability and affordability are important to New York City’s long-term competitiveness. Too many New Yorkers struggle to find housing that meets their needs; the region’s housing shortage has been one reason for the affordability crisis.
Enacting policies to encourage more housing production for more people in every area of the New York metropolitan region should be a high priority of City and State lawmakers. The underproduction of housing and continued uneven regional development patterns are the product of policy choices that constrain New York’s ability to keep pace with demand. The result is that New York City builds less housing on a per capita basis and relative to its economic growth than nearly every other large city in America, while the downstate suburbs build substantially less than tows in neighboring New Jersey and Connecticut. The current approach to planning and development in New York is not up to the task of meeting the region’s housing needs.
City and State lawmakers should continue to look for solutions to boost housing production by: ensuring that zoning and building codes match the needs of a growing region; reforming New York City’s property tax system to make it easier to build rental housing without the need for substantial subsidies; and finding ways to incentivize the suburbs to build sufficient housing to meet the regional demand.
Appendix A
Methodology and Alternative Measures of Housing Production
Building permits are one of several metrics that can be used to assess housing growth. This report primarily relies on permits because the Census Bureau collects data on building permits from local permitting jurisdictions, which allows for standardized comparisons of development activity across jurisdictions and over time.
Two other metrics commonly used to study housing production are completions and changes in net supply. Completions give a more accurate depiction of production than permits, as not all permitted units are ultimately built. Data on completions is available at the national level, but there is no reliable source of local-level data that allows for comparisons among cities or counties. NYU’s Furman Center tracks completions in New York City by measuring the issuance of new certificates of occupancy.
The net change in the number of units takes into account not only completions but also nets out units removed from the housing stock due to renovations or demolitions. Data from the Census Bureau allows for an approximation of changes in supply.
This analysis also can vary depending on the base year selected to normalize the production data. Looking at one year’s worth of permitting provides an incomplete snapshot, while looking at a longer time horizon can obscure changes in policy. For example, New York ranks slightly better in a look back to 2000 instead of 2010 because it produced more housing in the 2000s—New York ranked fifteenth in permits per capita among peer cities between 2000 and 2009.
There are also alternative ways to control for population, density, economic growth, and geographic scale. In addition to measuring permits per capita, it is possible to measure permits per existing housing unit or to measure housing starts or completions per net new job created during a time period. Each measure something different. Comparing new construction permitting activity per housing unit takes into account existing supply. This helps distinguish tighter housing markets like New York from those that have higher vacancy rates, either because they have fewer supply constraints, like Houston, or less market demand, like Detroit.
It is also possible to compare housing growth to employment growth. City planners frequently measure “jobs-housing balance,” or the ratio of jobs within a geographic area to the number of employed residents, to track whether cities provide housing that is proportional to their job base and to track whether housing production has kept pace with economic growth. Building enough housing near job centers also allows workers to live closer to their jobs, reduces vehicle miles traveled, and keeps housing cost appreciation in check.54 At a regional level, job creation and housing production should be balanced, though jobs-housing imbalances frequently exist at the local level, most famously in California’s Silicon Valley. Some job-rich jurisdictions place limits on residential development, often through restrictive zoning, which forces other jurisdictions to bear the burden of accommodating residential growth. Regional imbalances of jobs and housing – and low-income housing, in particular—can make it more difficult for residents to access job opportunities.
Historically, New York City has ranked well among American cities for its balance of jobs and housing. Thanks to its geographic size and large existing housing stock, New York has roughly one job within its city limits for every employed resident.55
In recent years, however, New York has added jobs at a faster rate than it has added housing. Between 2007 and 2017, New York’ jobs-housing balance widened by 21 percent—a faster increase than every large city except Detroit. By contrast, most other cities saw their jobs-housing balance remain steady or tilt in the favor of housing. This suggests that New York did not build enough housing to ensure that its housing stock kept pace with job growth or to accommodate growing demand for central city housing.
Appendix B
Appendix C
Appendix D
Footnotes
- Vicki Been, Ingrid Gould Ellen, and Katherine O’Regan, “Supply Skepticism: Housing Supply and Affordability,” New York University Furman Center for Real Estate and Urban Policy (August 20, 2018), https://furmancenter.org/files/Supply_Skepticism_-_Final.pdf.
- Brian J. Asquith, Evan Mast, and Davin Reed, “Supply Shock Versus Demand Shock: The Local Effects of New Housing in Low-Income Areas” WE Upjohn Institute for Employment Research (December 19, 2019), https://research.upjohn.org/cgi/viewcontent.cgi?article=1334&context=up_workingpapers.
- City of New York, Where We Live NYC (January 2020), https://wherewelive.cityofnewyork.us/wp-content/uploads/2020/01/Where-We-Live-NYC-Draft-Plan.pdf.
- One exception was 2015, when the City issued building permits for 56,528 new housing units in response to the looming expiration of the 421-a program. This was the largest number of new permits issued since 1962, and only the fourth time that the City approved more than 40,000 units in a year since 1960.
- Vicki Been, Stephanie Rosoff, and Jessica Yager, “2017 Focus: Changes in New York City’s Housing Stock”, New York University Furman Center for Real Estate and Urban Policy (June 2018), https://furmancenter.org/files/sotc/SOC_2017_FOCUS_Changes_in_NYC_Housing_Stock_1JUN2018.pdf.
- The cities selected for comparison were the largest in the United States by population as of 2018, with the exception of Charlotte, NC, for which permit data was not available. The baseline for per-capita housing permitting activity in this report is each city’s population in the 2010 decennial census unless otherwise noted.
- Note that the neighborhood-level permit data is derived from city building permit filings, as compiled by the Furman Center for Real Estate and Urban Policy and differ slightly from the permit data reported to HUD shown in Figures 1 and 2.
- City of New York, Mayor’s Office of Operations, Preliminary Mayor’s Management Report, Fiscal 2020: Housing New York, https://www1.nyc.gov/assets/operations/downloads/pdf/mmr2019/housing_new_york.pdf.
- Community district data count new construction units financed since January 1, 2014 and exclude 763 units classified in the dataset as “confidential.” These units are individual homeowner assistance grants or are placements of victims of domestic violence. CBC staff analysis of data from New York City Department of Housing Preservation and Development, “Housing New York Units by Building” (accessed July 22, 2020 last updated April 30, 2020), https://data.cityofnewyork.us/Housing-Development/Housing-New-York-Units-by-Building/hg8x-zxpr/data.
- New York City Department of City Planning, The Geography of Jobs: NYC Metropolitan Region Economic Snapshot, Second Edition (October 2019), https://www1.nyc.gov/assets/planning/download/pdf/planning-level/housing-economy/nyc-geography-jobs2-1019.pdf
- City of New York Department of City Planning, Info Brief: Housing Production and Building Heights (May 2018), https://www1.nyc.gov/assets/planning/download/pdf/about/dcp-priorities/data-expertise/housing-production-building-heights-info-brief.pdf.
- Brian J. Asquith, Evan Mast, and Davin Reed, “Supply Shock Versus Demand Shock: The Local Effects of New Housing in Low-Income Areas” WE Upjohn Institute for Employment Research (December 19, 2019), https://research.upjohn.org/cgi/viewcontent.cgi?article=1334&context=up_workingpapers.
- Long Island Index, 2018 Indicators Report (April 5, 2018), http://www.longislandindex.org/wp-content/uploads/2018/04/2018_Index_report_full_040518.pdf.
- Office of the Nassau County Comptroller, This is Nassau: Modernizing “The Deal” of Living in Nassau County (December 2019), https://opennassau.nassaucountyny.gov/stories/s/qvmk-25p7.
- City of New York, Where We Live NYC (January 2020), p. 152, https://wherewelive.cityofnewyork.us/wp-content/uploads/2020/01/Where-We-Live-NYC-Draft-Plan.pdf
- Data compiled by the Furman Center found that the median gross rent increased 31 percent between 2000 and 2016 while the median renter household income grew only 3.6 percent. Over that period, the share of newly available rental units that were affordable to households earning at least 80 percent of the area median income fell 24 percent. Similarly, vacancy rates remained steady at 3.6 percent, and rates of overcrowding have crept up. See: Vicki Been, Stephanie Rosoff, and Jessica Yager, “2017 Focus: Changes in New York City’s Housing Stock, New York University Furman Center for Real Estate and Urban Policy (June 2018), https://furmancenter.org/files/sotc/SOC_2017_FOCUS_Changes_in_NYC_Housing_Stock_1JUN2018.pdf.
- City of New York Department of City Planning, Info Brief: How Much Housing is Built As-of-Right? (March 2019), https://www1.nyc.gov/assets/planning/download/pdf/about/dcp-priorities/data-expertise/how-much-housing-is-built%20as-of-right.pdf.
- CBC staff analysis of data from City of New York, Department of City Planning, Primary Land Use Tax Lot Output 18.v2.1, https://www1.nyc.gov/assets/planning/download/zip/data-maps/open-data/nyc_pluto_18v2_1_csv.zip.
- For example, a 2,500 square foot lot with a maximum residential FAR of 3 allows the construction of a building of up to 7,500 square feet. The lot would be considered underdeveloped if the existing building on the lot were no greater than 3,750 square feet. Zoning lots classified by the Department of City Planning as water lots, as well as those that are individual landmarks too narrow to accommodate a building, are excluded. Lots zoned for commercial uses that also permit residential development are included as potential residential development sites.) See: Vicki Been, Ingrid Gould Ellen, Josiah Madar, and Simon McDonnell, “Underused Lots in New York City” Lincoln Institute of Land Policy (2009), https://www.lincolninst.edu/sites/default/files/pubfiles/1682_896_been_1_final.pdf.
- CBC staff analysis of data from City of New York, Department of City Planning, Primary Land Use Tax Lot Output 18.v2.1, https://www1.nyc.gov/assets/planning/download/zip/data-maps/open-data/nyc_pluto_18v2_1_csv.zip.
- CBC staff analysis of data from City of New York, Department of City Planning, Primary Land Use Tax Lot Output 18.v2.1, https://www1.nyc.gov/assets/planning/download/zip/data-maps/open-data/nyc_pluto_18v2_1_csv.zip.
- Vicki Been, Ingrid Gould Ellen, Michael Gedal, Edward Glaeser, Brian J. McCabe, “Preserving History or Hindering Growth? The Heterogeneous Effects of Historic Districts on Local Housing Markets in New York City” New York University Furman Center for Real Estate and Urban Policy (September 2014), https://furmancenter.org/files/NYUFurmanCenter_HistoricDistricts_2014.pdf.
- Ford Fessenden and others, “Reshaping New York,” New York Times (August 18, 2013), http://www.nytimes.com/newsgraphics/2013/08/18/reshaping-new-york/index.html.
- Amy Armstrong and others, “How Have Recent Rezonings Affected the City’s Ability to Grow?” New York University Furman Center for Real Estate and Urban Policy (March 2010), https://furmancenter.org/files/publications/Rezonings_Furman_Center_Policy_Brief_March_2010.pdf.
- These contextual changes include increased set back requirements, reduced height limits, increased parking requirements, or disallowing rowhouses or apartment buildings.
- The 2005 rezoning of Bay Ridge, for example, was to “provide protections against out-of-scale development… and would triple the number of blocks on where only detached homes would be permitted.” It further noted that despite a previous downzoning in 1978, “multi-family and attached housing can be developed in place of single-family, detached homes in parts of the district. With increasing frequency, single-family homes on large lots have been replaced with multi-family residences. As a result, there is growing community concern about the potential for eroding the character of some blocks within the special district. The proposed zoning changes would better preserve neighborhood scale and character by replacing many of the underlying zoning districts with lower density and contextual zoning districts, and by retaining certain provisions of the existing special district.” See: City of New York Department of City Planning, Special Bay Ridge District Rezoning Overview, https://www1.nyc.gov/assets/planning/download/pdf/plans/bay-ridge/bay_ridge.pdf.
- Amy Armstrong and others, “How Have Recent Rezonings Affected the City’s Ability to Grow?” New York University Furman Center for Real Estate and Urban Policy (March 2010), https://furmancenter.org/files/publications/Rezonings_Furman_Center_Policy_Brief_March_2010.pdf.
- Turner & Townsend, International Construction Market Survey 2019, https://www.turnerandtownsend.com/en/perspectives/international-construction-market-survey-2019/.
- Engineering News-Record, Construction Cost Index 2019, https://www.enr.com/economics.
- There is little data on the mix of union and non-union labor working in the residential construction sector. See: Laura Kusisto, “Construction Unions’ Grip on New York Begins to Show Cracks,” Wall Street Journal (April 15, 2016), https://www.wsj.com/articles/construction-unions-grip-on-new-york-begins-to-show-cracks-1460759134; and Max Parrott, "The battle for Hudson Yards,” City and State (September 4, 2018), https://www.cityandstateny.com/articles/policy/labor/battle-hudson-yards.html.
- The average number of days to complete a first plan review for new buildings fell from 5.6 days in 2017 to 4.4 days in 2019. See: City of New York, Mayor’s Office of Operations, Preliminary Mayor’s Management Report, Fiscal 2020: Department of Buildings, https://www1.nyc.gov/assets/operations/downloads/pdf/pmmr2020/dob.pdf; and City of New York Department of Buildings, Building One City: A Blueprint for Fundamental Transformation at the New York City Department of Buildings (January 2015), https://www1.nyc.gov/assets/buildings/pdf/building_one_city.pdf.
- Local Laws of the City of New York for the Year 2020: Local Law No. 14 of 2020 (January 10, 2020), https://legistar.council.nyc.gov/LegislationDetail.aspx?ID=3903498&GUID=764045A3-C49A-4BD9-B6FA-F9B605B35B8F&Options=ID|Text|&Search=1481-a.
- Jake Blumgart, “Changes to plumbing code expected to sharply reduce Philly construction costs,” WHYY (September 28, 2018), https://whyy.org/articles/changes-to-plumbing-code-expected-to-sharply-reduce-philly-construction-costs/.
- Michael R. Hattery, R. Richard Geddes, and David L. Kay, “The Costs of Labor Law 240 on New York’s Economy and Public Infrastructure,” The Nelson A. Rockefeller Institute of Government (December 31, 2013), https://verticalaccessllc.files.wordpress.com/2014/03/2014-02-study-the-costs-of-labor-law-240-on-new-york-economy-and-public-infrastructure.pdf.
- Aaron Twait and Adam H. Langley, “50-State Property Tax Comparison Study for Taxes Paid in 2018,” Lincoln Institute of Land Policy and Minnesota Center for Fiscal Excellence (June 2019), https://www.lincolninst.edu/sites/default/files/pubfiles/50-state-property-tax-comparison-for-2018-full__3.pdf.
- City of New York Rent Guidelines Board, 2019 Income and Expense Study (April 4, 2019), https://rentguidelinesboard.cityofnewyork.us/wp-content/uploads/2019/08/2019-IE.pdf.
- Eric Stern, Mark Willis, and Josiah Madar, “The Latest Legislative Reform of the 421-a Tax Exemption: A Look at Possible Outcomes,” New York University Furman Center for Real Estate and Urban Policy (November 9, 2015), https://furmancenter.org/files/NYUFurmanCenter_421aOutcomesReport_9Nov2015.pdf.
- 421-a benefits are limited to condominium units in buildings located outside of Manhattan with fewer than 35 units and an assessed value of no more than $65,000 upon their first assessment following completion. Benefits are available only to owners who maintain their unit as their primary residence for at least the first five years of ownership.
- Eric Stern, Mark Willis, and Josiah Madar, “The Latest Legislative Reform of the 421-a Tax Exemption: A Look at Possible Outcomes,” New York University Furman Center for Real Estate and Urban Policy (November 9, 2015), https://furmancenter.org/files/NYUFurmanCenter_421aOutcomesReport_9Nov2015.pdf.
- Josiah Madar, “Inclusionary Housing Policy in New York City: Assessing New Opportunities, Constraints, and Trade-offs,” New York University Furman Center for Real Estate and Urban Policy (March 26, 2015), https://furmancenter.org/files/NYUFurmanCenter_InclusionaryZoningNYC_March2015.pdf.
- City of New York Department of Finance Division of Tax Policy, Annual Report on Tax Expenditures Fiscal Year 2019 (February 2019),https://www1.nyc.gov/assets/finance/downloads/pdf/reports/reports-tax-expenditure/ter_2019_final.pdf.
- City of New York Department of Finance Division of Tax Policy, Annual Report of the New York City Property Tax Fiscal Year 2019 (August 2019), https://www1.nyc.gov/assets/finance/downloads/pdf/reports/reports-property-tax/nyc_property_fy19.pdf.
- City of Boston Mayor’s Office, “Housing Plan Has Crossed the 30,000 Unit Mark, Including 6,000 Income Restricted Units” (press release, October 1, 2019), https://www.boston.gov/news/housing-plan-has-crossed-30000-unit-mark-including-6000-income-restricted-units.
- City of Boston, Housing A Changing City: Boston 2030 2018 Update (September 2018), https://docs.google.com/document/d/1WRWTkvId7_hAKiKz-_F8-J_HCq5mCrWKxBUeFOVgwaM/edit.
- District of Columbia, Housing Framework for Equity and Growth (May 2019), https://planning.dc.gov/page/housing-framework-equity-and-growth.
- Miguel Otarola, “Minneapolis moves forward by allowing triplexes citywide,” Minneapolis Star Tribune (November 8, 2019), https://www.startribune.com/minneapolis-moves-forward-with-allowing-triplexes-citywide/564664232/.
- Daniel Beekman, “Seattle upzones 27 neighborhood hubs, passes affordable-housing requirements,” Seattle Times (March 26, 2019), https://www.seattletimes.com/seattle-news/politics/seattle-upzones-27-neighborhood-hubs-passes-affordable-housing-requirements/
- Dan Bertolet and Nisma Gabobe, “LA ADU Story: How a State Law Sent Granny Flats Off the Chart,” Sightline Institute (April 5, 2019), https://www.sightline.org/2019/04/05/la-adu-story-how-a-state-law-sent-granny-flats-off-the-charts/.
- State of New Jersey Department of Community Affairs, Council on Affordable Housing, https://www.state.nj.us/dca/affiliates/coah/index.html
- Michael Andersen, “Oregon Just Voted to Legalize Duplexes on Almost Every City Lot,” Sightline Institute (June 30, 2019), https://www.sightline.org/2019/06/30/oregon-just-voted-to-legalize-duplexes-on-almost-every-city-lot/.
- Sophia Bollag, “Gavin Newsom signs granny flat, housing density laws that target California cities,” The Sacramento Bee (October 9, 2019), https://www.sacbee.com/news/politics-government/capitol-alert/article235955617.html.
- Kate Leach and Sarah Watson, “Hidden Housing,” Citizens Housing and Planning Council (2016), https://chpcny.org/assets/Hidden-Housing.pdf; Marcel Negret, Alanna Browdy, Melissa Kaplan-Macey, Moses Gates, Arvind Sindhwani, “Be My Neighbor,” Regional Plan Association (August 2020), https://rpa.org/work/reports/be-my-neighbor.
- Kathryn Wylde and Natasha Avanessians, “A Call for Action and Collaboration,” Partnership for New York City (July 2020), https://pfnyc.org/research/a-call-for-action-and-collaboration/.
- Robert Cervero and Michael Duncan, “Which Reduces Vehicle Travel More: Jobs-Housing Balance or Retail-Housing Mixing?” Journal of the American Planning Association, Vol. 72, No. 4 (Autumn 2006), https://escholarship.org/content/qt1s110395/qt1s110395.pdf.
- Smaller cities like Boston and Washington, DC, have higher ratios due to the large number of workers who commute into the city from the surrounding region, while primarily residential cities like San Jose, have more housing than jobs. Jobs-housing imbalances become more problematic at smaller levels of geography, as in much of Silicon Valley, where many cities zone for commercial development and rely on other jurisdictions to build housing for workers and fund municipal services those residents demand.