Taxis, Taxes, and the MTA Funding Gap
Since September 2014, when the Metropolitan Transportation Authority (MTA) proposed a five-year capital investment plan for its vital network of subway, bus, and commuter rail services, the region’s leaders have struggled to find the nearly $30 billion required. Thanks to efforts by MTA leadership to lower costs, Governor Andrew Cuomo has pledged additional funds (source not yet identified) and has called on Mayor Bill de Blasio to find the resources to fill the remaining gap which has now been reduced to $2.6 billion.
The Citizens Budget Commission (CBC) recommends that needed MTA capital funds be provided from additional motor vehicle cross-subsidies to help offset the negative externalities of automobile use. The CBC guideline proposes motor vehicle cross-subsidies increase to 25 percent of mass transit costs from the expected 11 percent in recent MTA financial plans. This policy brief assesses taxes on services regulated by New York City’s Taxi and Limousine Commission (TLC) as a potential source of MTA funding from motor vehicle cross-subsidies.
Overview of the Transportation Services Sector
The TLC is comprised of nine members appointed by the Mayor with the advice and consent of the City Council and is led by a Chairman who presides over day-to-day operations. The firms regulated by TLC provide, on average, 764,000 trips every day and generate about $4.4 billion in annual revenue.1 Four different types of services comprise these trips. (See Table 1.)

More than half of all trips are completed by yellow taxicabs, another 7 percent are completed by street hail liveries (also known as green cabs) and 14 percent are completed by community cars (also known as liveries) through prearranged service. The remaining quarter of all trips are completed by vehicles registered as black cars; these include vehicles servicing business accounts and newer Dispatch Service Providers (DSPs), such as Uber and Lyft, which serve individuals with pre-established accounts dispatched via mobile phone apps.2 Like liveries, black cars must prearrange service with customers and submit rate schedules to TLC for approval.
About 44 percent of the industry’s revenues are accounted for by yellow taxicabs and 5 percent by green taxis. Liveries generate about 8 percent and black cars 42 percent. The distribution of revenues and trips among sectors differs because of variations in rates; fares from trips by yellow taxicabs, green cabs, and liveries are typically lower than fares from black cars, including DSPs.
The current structure of this industry has evolved over a period spanning more than 100 years. Service resembling present-day taxicabs began in 1907. By the end of World War I, the City treated the taxicab industry as an urban utility, establishing rates of fare, inspecting meters, and breaking up private control of taxi stands. During the Great Depression, as unemployment soared, more drivers competed for fewer passengers and the price of a trip cratered, bankrupting fleets and drivers. In response in 1937 the City fixed the number of taxicab licenses, now known as medallions.3
Liveries emerged during the 1960s. As licensed taxicab drivers favored Manhattan’s central business district over the rest of the city, particularly minority-majority neighborhoods, unlicensed liveries began operating primarily in upper Manhattan and the other boroughs. Eventually sanctioned and regulated by the City in 1971, liveries are not permitted to accept street hails and must arrange service ahead of time.4
In the 1980s some taxicabs began carrying radios to receive dispatches for prearranged service. Drivers sought these assignments for the affluent customer base and steady fares they offered; however, passengers on the street had an increasingly difficult time hailing the limited number of taxis. To remedy a dearth of cruising cabs, the City required all medallion taxis to operate without radios and created a new type of service, black cars, to serve corporate accounts through prearranged service.5
In 2011 Uber began operating in New York City. Other DSPs followed, including Lyft in 2014. This service group has grown rapidly to constitute a significant share of the industry. In June 2015 DSPs accounted for an estimated 3.9 million trips, or 17 percent of total trips that month. While the City has regulated the services these companies provide as black cars, it introduced a new category of license for these companies in June 2015.
Trends in Tax Collections
The TLC services industry is subject directly to two taxes paid by riders—a per-ride tax and a sales tax.6
Per-Ride Tax
As part of a comprehensive plan to fund the MTA in 2009, the State instituted a 50-cent tax on taxicab trips originating in New York City and ending in the MTA service region. When green cabs were authorized in 2011, they were subject to this tax on metered rides as well.
Sales Tax
The fiscal year 2009-2010 State budget legislation applied state and local sales taxes (4 percent statewide and 4.5 percent additional in New York City) to fares collected by liveries, black cars, and other specialized vehicles, but not to yellow taxicab and green cab fares. For covered fares within the MTA service region, there is an additional tax of 0.3775 percent (to total 8.8775 percent) and that increment is dedicated to the MTA. The State exempted liveries from the tax later in 2009 owing to difficulties in collecting the tax from drivers or firms who were often paid in cash.
Based on estimated trip volumes and fare revenues in 2015, the two taxes will raise approximately $250 million, a 74 percent increase over 2011. The MTA will receive $94 million, of which $87 million is from the taxicab per-ride tax and $7 million is from its portion of the sales tax. The City will receive an estimated $84 million and the State an estimated $75 million from the sales tax in 2015. (See Table 2.)

Tax collections from the industry have changed notably in recent years owing to three trends that are likely to continue. First, total trips grew by an estimated 22 million from 2011 to 2015, or an average of 2.1 percent annually. The increase derives in part from demographic growth and economic expansion. More people are living, working, and vacationing in New York. The City added 315,946 residents from 2010 to July 2014, an increase of 3.9 percent.
More than three-fourths of this growth occurred in the Bronx, Brooklyn, and Queens— areas served more by liveries and DSPs than taxicabs.9 In addition, the city added 517,000 jobs since January 2011, a 14 percent increase, and continues to set records for domestic and international visitors, welcoming nearly 57 million in 2014, up 16 percent since 2010.8
Second, the number of liveries and black cars has increased significantly. At the beginning of 2011, TLC reported 37,782 liveries and black cars in New York City. By the end of 2014 that number reached 58,295.9 In 2011 New York City had 6.2 taxis, liveries, and black cars per 1,000 residents; by 2015 that figure reached 8.5.10
Third, taxicab trips fell 11 percent from 2011 to 2014 and are likely to decrease in 2015.11 This is partly owing to the growth in street hails by green cabs—approximately 54,500 trips per day.12 The growth in Uber and other DSPs is also likely reducing taxicab trips, although much of their business is derived from the growth in total number of trips.
Based on these trends, Table 3 presents projections of trips and tax collections for 2019 by vehicle type based on two scenarios. The first, a low-growth scenario, assumes total trips grow 1.1 percent annually (about half the recent trend) and all service types maintain their existing shares of total trips. The second, a high-growth scenario, assumes recent trends continue; that is, total trips grow 2.1 percent annually and the number of DSPs continues to increase rapidly, doubling their number of trips by 2019.
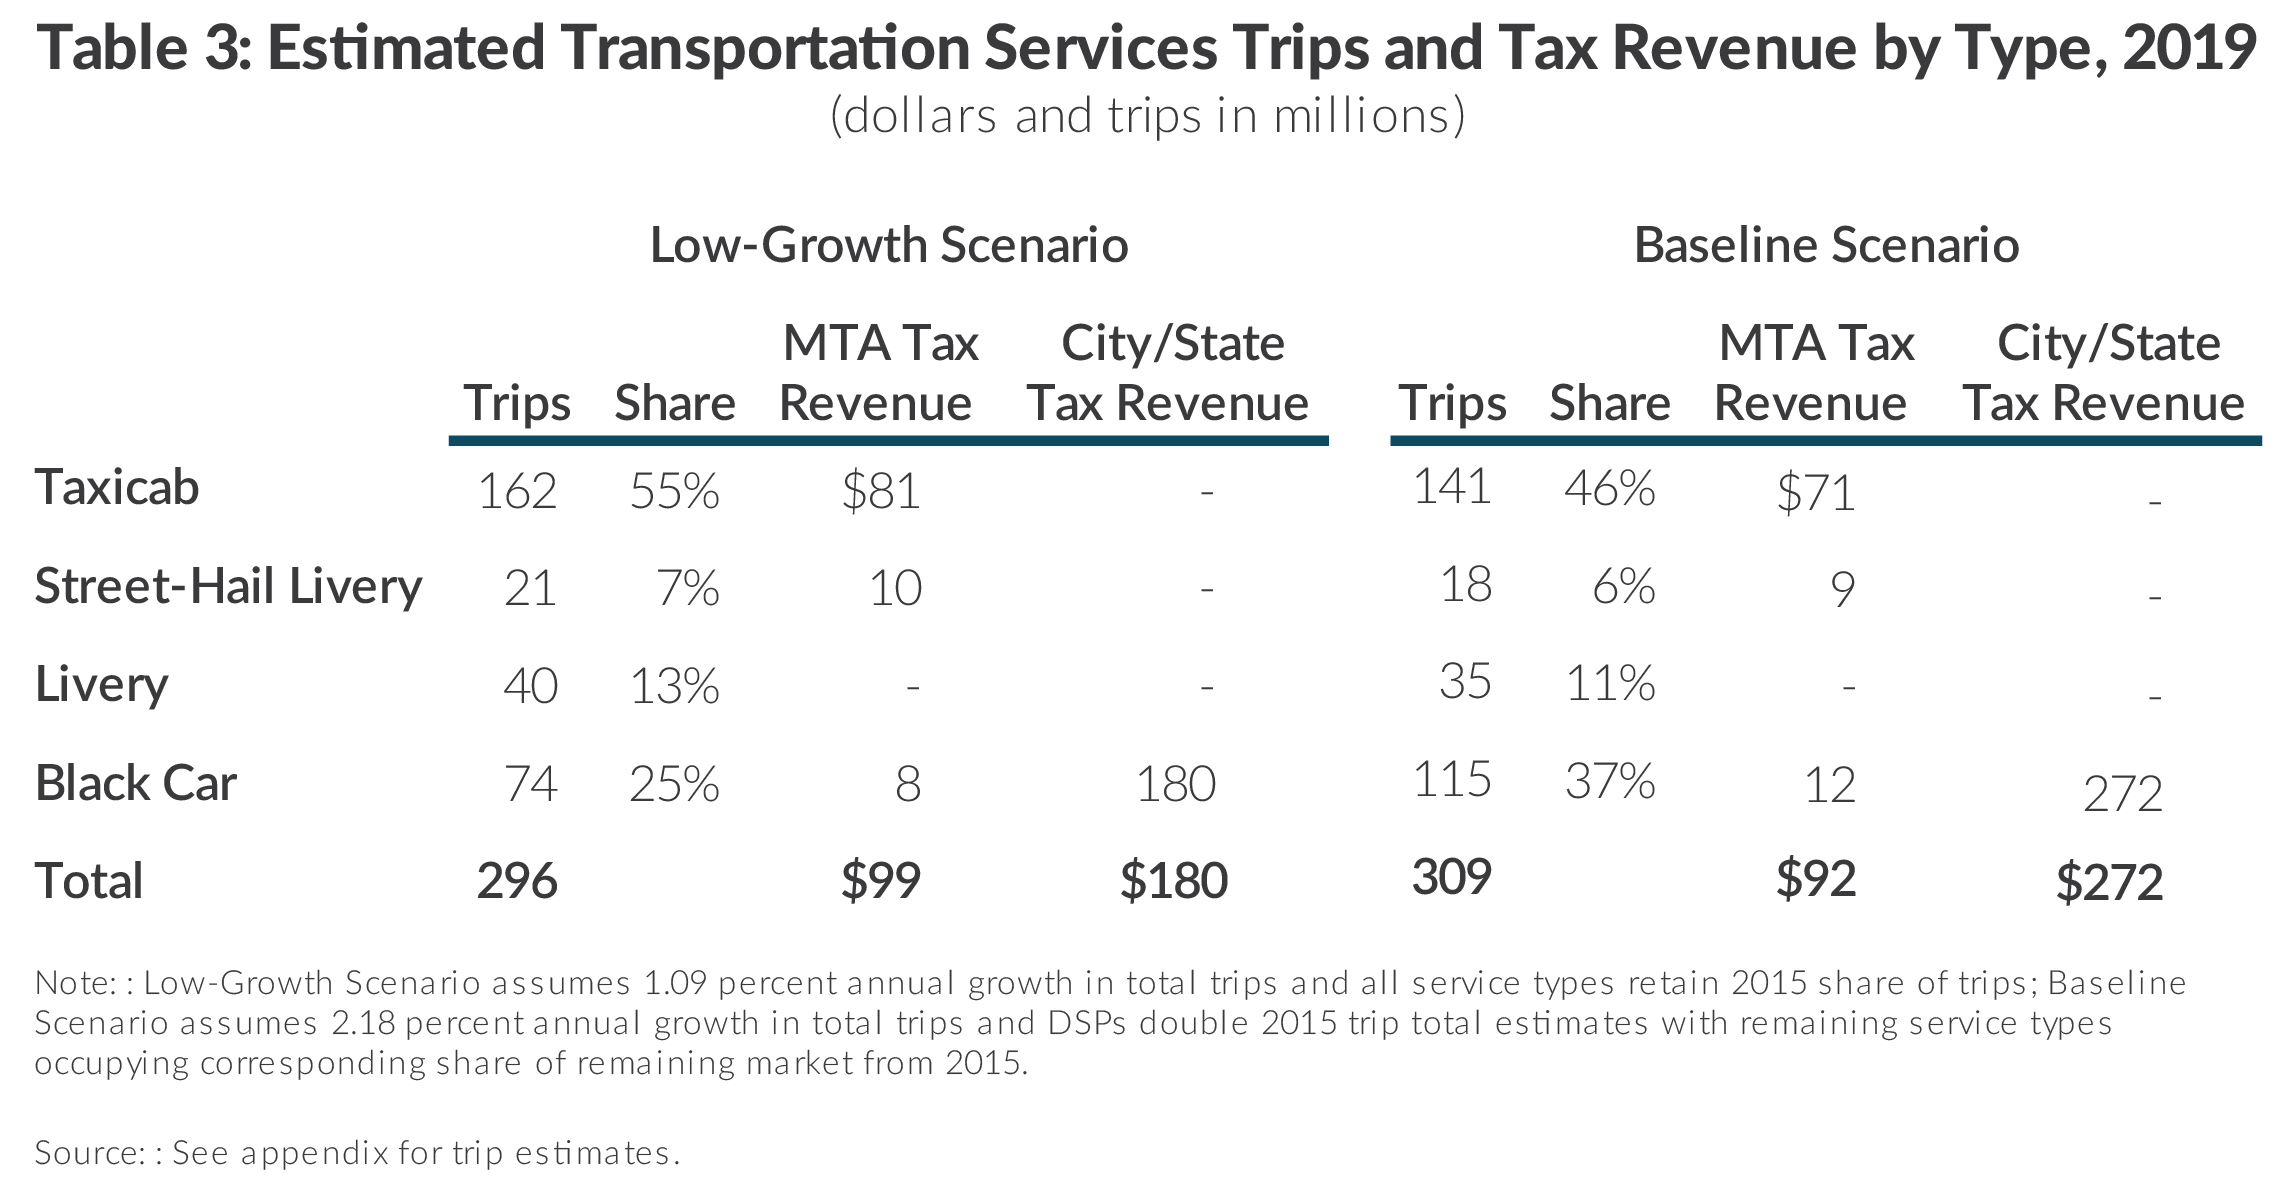
Under the low-growth scenario, in 2019 the MTA will collect $98 million from the TLC services industry; the City and State together will collect a larger $166 million. In the highgrowth scenario the MTA will collect $92 million and City and State sales tax receipts total $272 million. Continuation of the current trend is unfavorable for the MTA under the existing tax structure.
Options to Increase MTA Revenue
The anticipated erosion of MTA revenue, particularly from a motor vehicle cross-subsidy, should be a cause for concern in light of the enduring gap in capital funding. This section presents options to help close the gap by modifying the direct taxes on TLC services paid by passengers.
Expand Coverage of Per-Ride Taxicab Tax
The 50-cent per ride taxicab tax charges riders, who do not necessarily pay other cross-subsidies from vehicle ownership for the negative externalities their trips produce. By this logic, all TLC service trips—not solely taxicab trips—should be considered for this tax.
Applying the tax to all black car, including DSP, trips, would have raised an additional $33 million in 2015. This amount would grow to between $34 million and $55 million by 2019. (See Figure 1.)

Increase and Expand Per-Ride Taxicab Tax
It may be appropriate not only to extend the tax to black cars but to update the charge as well. In 2011 the taxicab tax represented 4.73 percent of the average taxi fare. After increases in taxicab fares, the figure is 3.95 percent today. Black car trips have significantly higher fares: an average DSP fare is estimated to be more than $27, and fares for corporate black cars may be higher.13 For these trips, a 50-cent tax would represent a smaller rate of 1.9 percent.
If the new tax applied to black cars including DSPs were set at a rate equal to that applied to taxicabs, rather than a flat 50 cents, then the tax would be 3.95 percent of the fare. With black car fares averaging more than $27, their average tax would be about $1.07 rather than 50 cents. This new tax, if applied to black cars, would have generated an additional $70 million in 2015 and between $73 million and $117 million in 2019. (See Figure 2.)

Transportation Sales Tax Reform
Another option is to lower the burden on black cars and dedicate the entire tax to the MTA. The new rate could be set sufficient to close the MTA funding gap, at approximately 5.75 percent or at a higher 7.75 percent. Depending upon the level of tax, a “reformed” sales tax would increase MTA revenues by as much as $225 million in 2019.16 (See Figure 3.) While this option would require the State and City to forfeit sales tax revenue from this industry, it would fund the shortfall in the MTA’s capital plan and provide a likely growing revenue stream for this purpose from both jurisdictions.

Alternatively, the current sales tax could be applied to yellow and green taxis and liveries; however, an increased tax burden on a declining segment of the industry would be an economic burden and is unlikely to be politically viable.15
Summary
As City and State leaders continue discussions of how best to close the funding gap in the MTA’s capital plan, changes to taxes on transportation service ought to be considered. Table 4 shows the additional MTA annual revenue expected from the four options identified in this policy brief and the share of the current capital funding gap those revenues could close. Even the smallest amount raised—$35 million with the expansion of the 50-cent taxicab tax to black cars—could service $573 million in debt, or 22 percent of the remaining gap. Assuming current trends in the industry continue to 2019, the option of a reformed sales tax at 5.5 percent could fully close the MTA gap by covering debt service on $2.6 billion of borrowing.

Download Report
Taxis, Taxes, and the MTA Funding GapDownload Appendix
Trip and Fare EstimatesFootnotes
- Total does not include luxury limousines. See appendix for full assumptions.
- According to TLC regulations the defining difference between liveries and black cars is the way fare revenue is collected: black cars receive at least 90 percent of their revenue from non-cash payment. See: Taxi and Limousine Commission, Rules and Local Laws, “Definitions, Chapter 51,” Section 03 (2015), www.nyc.gov/html/tlc/downloads/pdf/rule_book_current_chapter_51.pdf.
- In 1947 fleets began selling excess medallions. According to recent TLC reports, 13,605 taxicab permits are active. See: Graham Russell Gao Hodges, Taxi! A Social History of the New York City Cabdriver (John Hopkins University Press, March 2007), p. 77.
- Graham Russell Gao Hodges, Taxi! A Social History of the New York City Cabdriver (John Hopkins University Press, March 2007), pp. 131-135.
- Schaller Consulting, The New York City Taxicab Fact Book (March 2006), p. 26, www.schallerconsult.com/taxi/taxifb.pdf.
- The industry also generates other tax revenue from individual and business income and other taxes, including a motor vehicle tax of $1,000 per year for yellow and green taxicabs and $400 per year for liveries and black cars, as well as a 5 percent transfer tax on medallion sales on the secondary market. These taxes are not assessed directly on passengers and are not addressed here.
- U.S. Census Bureau, Current Reestimates Program (2014), www.census.gov/popest/data/datasets.html.
- New York State Department of Labor, Major Areas Current Employment Statistics (June 2015), https://labor.ny.gov/stats/cesemp.asp; and Patrick McGeehan, “As Tourism Record Is Set, New York City Sees Surge in Chinese Visitors,” New York Times (February 1, 2015), www.nytimes.com/2015/02/02/nyregion/as-tourism-record-is-set-new-york-city-awaits-more-chinese-visitors.html.
- New York City Taxi and Limousine Commission, Annual Report (2010 and 2014 editions), www.nyc.gov/html/tlc/html/archive/annual.shtml; and scraped data.
- This increase may overstate activity as new liveries and black cars spend significantly less time operating per vehicle. While the average taxicab completes 31 trips a day, typically working 20 to 24 hours, the 9 average Uber vehicle completes only 6.2 trips per day. Assumes 18,224 registered for-hire vehicles, which is 14,088 total reported in March 2015 plus growth of 1,032 per month, all in Uber registrations. See: Fitz Tepper, “Uber Releases Hourly Ride Numbers in New York City to Fight De Blasio,” TechCrunch (July 22, 2015), http://techcrunch.com/2015/07/22/uber-releases-hourly-ride-numbers-in-new-york-city-tofight-de-blasio/#.dei073:2Aqg; Associated Press, “Yellow Cabs Now Outnumbered by Uber Cars on NYC Streets,” New York Times (March 19, 2015), www.nytimes.com/aponline/2015/03/19/us/ap-us-travelchanging-of-the-cabs.html?_r=0; and Tim Fernholz, “The latest round in Uber’s battle for New York City, explained,” Quartz (blog entry, June 30, 2015), http://qz.com/441608/the-latest-round-in-ubers-battlefor-new-york-city-explained/.
- Data cited in Matthew W. Daus, Chairman Transportation Practice Group and Brook Taye, Regulatory Analyst and Economist, Windels Marx Lane & Mittendorf, LLP, “The Future of the Taxi Medallion System and For-Hire Services in a Disruptive Technology World” (presentation to University Transportation Research Center, New York, June 23, 2015), www.utrc2.org/sites/default/files/Medallion%20Event%20UTRC%20PPT%20-%20Matt%20Daus%20%26%20Brook%20Taye.pdf.
- This does not include prearranged, non-metered trips completed by green cabs.
- Average fare uses average hourly earnings by New York City Uber drivers and divides by 1.415 trips per hour, the median for Uber-provided data in June and July 2015. Calculation adjusts for Uber’s sales tax and Black Car Fund contributions. See: Jonathan Hall and Alan Krueger, An Analysis of the Labor Market for Uber’s Driver-Partners in the United States (January 22, 2015), pp. 16 and 18-198, https://s3.amazonaws.com/uber-static/comms/PDF/Uber_Driver-Partners_Hall_Kreuger_2015.pdf.
- This amount nets out the loss of current sales tax revenue dedicated to the MTA, 0.3775 percent of fare revenue.
- Continuing to tax black cars and not liveries may create incentives for DSP vehicles to find ways to be reclassified as liveries.