Think Your Rent Is High?
Documenting New York City’s Severest Rent Burdens
Housing affordability is a perennial concern of New Yorkers and their elected officials, and the production and preservation of affordable housing is a key priority of the de Blasio Administration. The Mayor has set the City’s affordable housing production goals to 300,000 units built or preserved through 2026, with 25 percent reserved for the lowest income New Yorkers. In addition, the continued deterioration of affordable units in public housing has prompted the Mayor to increase City funding for the New York City Housing Authority (NYCHA). Both initiatives come at a rising cost to the public. In fiscal year 2018, the value of City capital dollars committed to housing needs exceeded $1 billion for the first time. With an unprecedented level of City resources going to housing, a necessary first step in evaluating the impact of these policies is identifying which portions of the city’s population are most affected by the affordability crisis.
According to recently released data from the New York City Housing and Vacancy Survey (HVS), more than 921,000 renter households in New York City, or 44 percent of all renters, pay at least 30 percent of their income in rent after accounting for the value of rental housing vouchers and Supplemental Nutrition Assistance Program (SNAP) benefits. More than half of these households–greater than 462,000 families and single adults–are considered severely rent burdened, which means they pay at least half of their income in rent. Severe rent burdens are most common among households earning less than 50 percent of the Area Median Income (AMI) and disproportionately affect single households, seniors, and single parents.
Since the previous HVS was conducted in 2014, the share of severely burdened renters remained steady at 22 percent of households; however, the share of low-income, severely rent-burdened single households, seniors, and single parents increased.
The number of burdened renters and growing burdens underscore the fact that the City cannot and should not be expected to close the affordability gap on its own. The most effective tools for moderating rent burdens on the lowest-income households have been the U.S. Department of Housing and Urban Development’s (HUD) Housing Choice Voucher program, commonly known as Section 8, and public housing. Any strategy to protect or preserve affordable housing must include public housing and requires federal assistance.
Housing and Vacancy Survey
The recently released 2017 HVS collects detailed information on New York City’s housing market. Households are considered rent burdened if they pay at least 30 percent of income in rent. Based on gross rent, which is contract rent plus monthly utility costs, 56 percent of New York City’s renter households, or nearly 1.2 million households, were rent burdened in 2017.1
The HVS also reports out-of-pocket housing expenses, which include the actual amount that tenants pay each month after accounting for government subsidies like the federal Section 8 Housing Choice Vouchers and financial support from family or friends. This is a more accurate measure of housing costs than the gross rent measure, which does not reflect the actual rents paid by many New York City tenants.
Citizens Budget Commission (CBC) uses out-of-pocket rent data as a basis for developing an “adjusted income measure” that incorporates another common form of household support, SNAP benefits. (See the 2015 CBC report, Whose Burden Is It Anyway, for more detail on the methodology.)
Using the adjusted income measure, the number of rent burdened households falls from 1.1 million, or 56 percent of all renter households, to 921,000, or 44 percent, as shown in Table 1. Most of the reduction occurs among severely burdened households. After accounting for Housing Choice Vouchers and SNAP, the number of households that pay half of their income in rent falls by one-third, from 701,000 (33 percent of renter households) to 462,000 (22 percent).2
Housing Affordability Ratios
Gross Rent Measure = Gross Rent Paid / Household Income
Adjusted Income Measure = Out-of-Pocket Rent / (Household Income + Estimated SNAP Benefits)

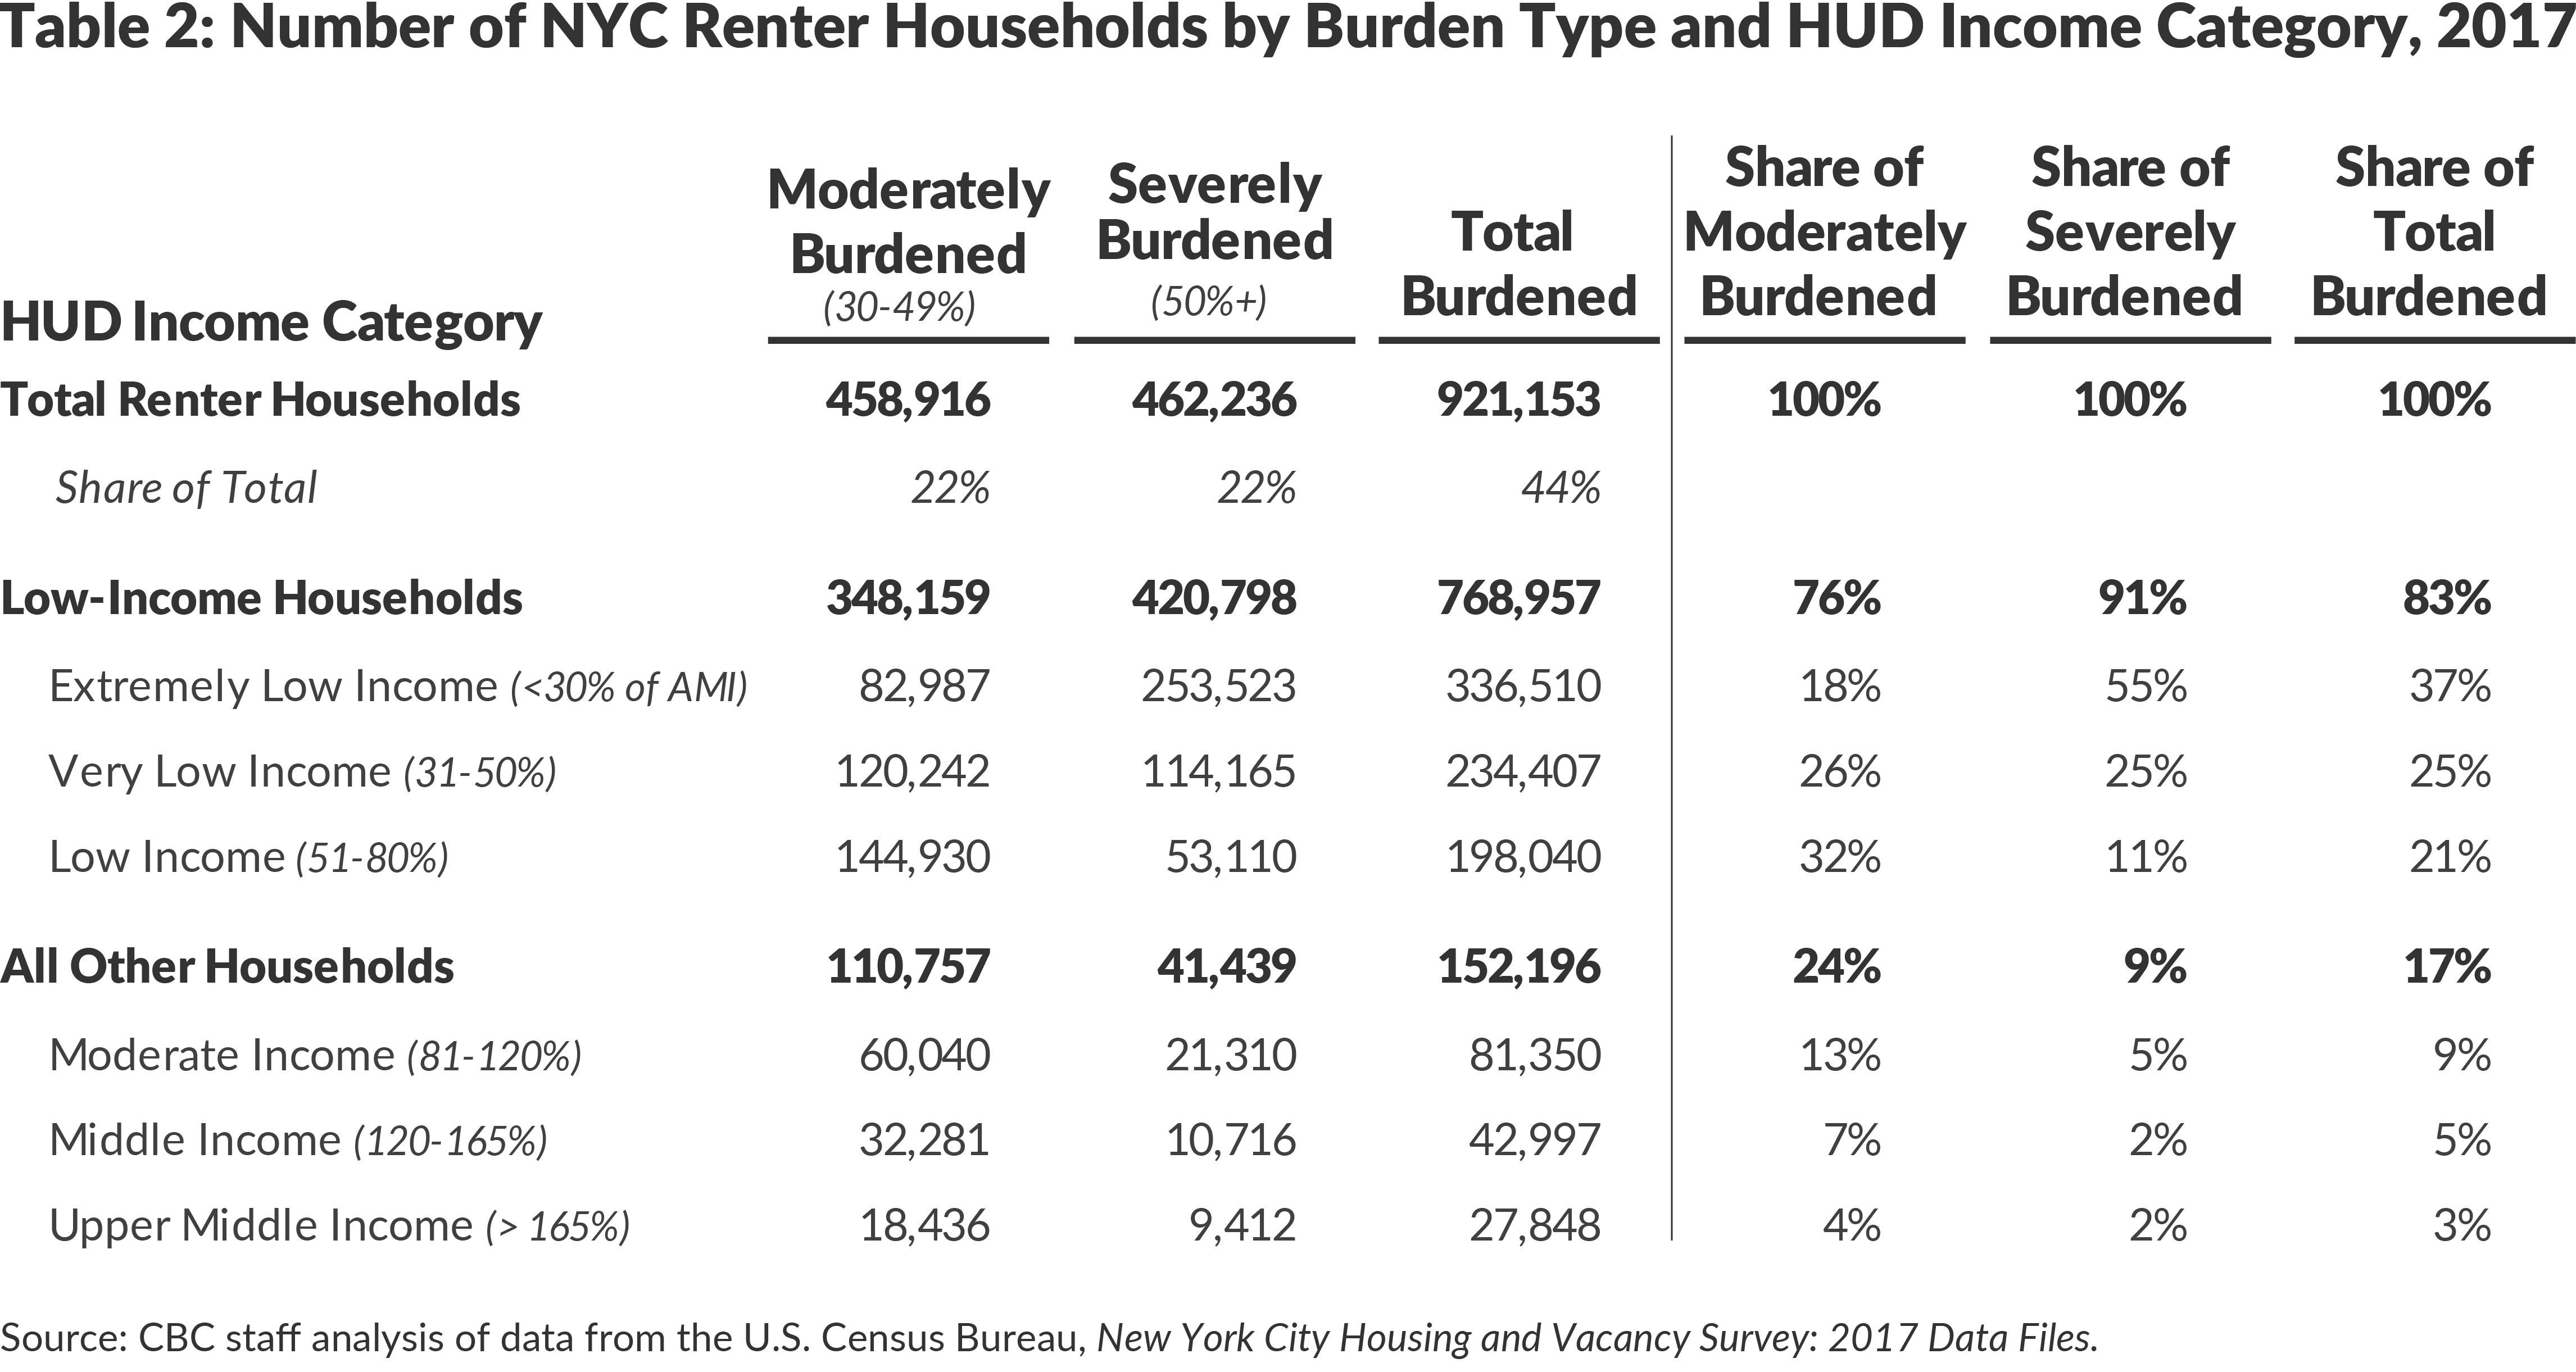
As shown in Table 2, low-income households comprise 91 percent of severely rent-burdened households. Eighty percent, or 368,000 households, are classified as Extremely Low Income (ELI) or Very Low Income (VLI). These households earn less than 30 percent and 50 percent of AMI, respectively; for a family of three this equated to household incomes of $24,500 and $40,800 at the time the HVS was conducted.3 ELI households make up 24 percent of New York City renters but 55 percent of severely rent burdened households. Similarly, VLI households were 16 percent of renters and 25 percent of those severely burdened. Moderate- and middle-income households, which earn more than 80 percent of AMI, were much less likely to be rent burdened.
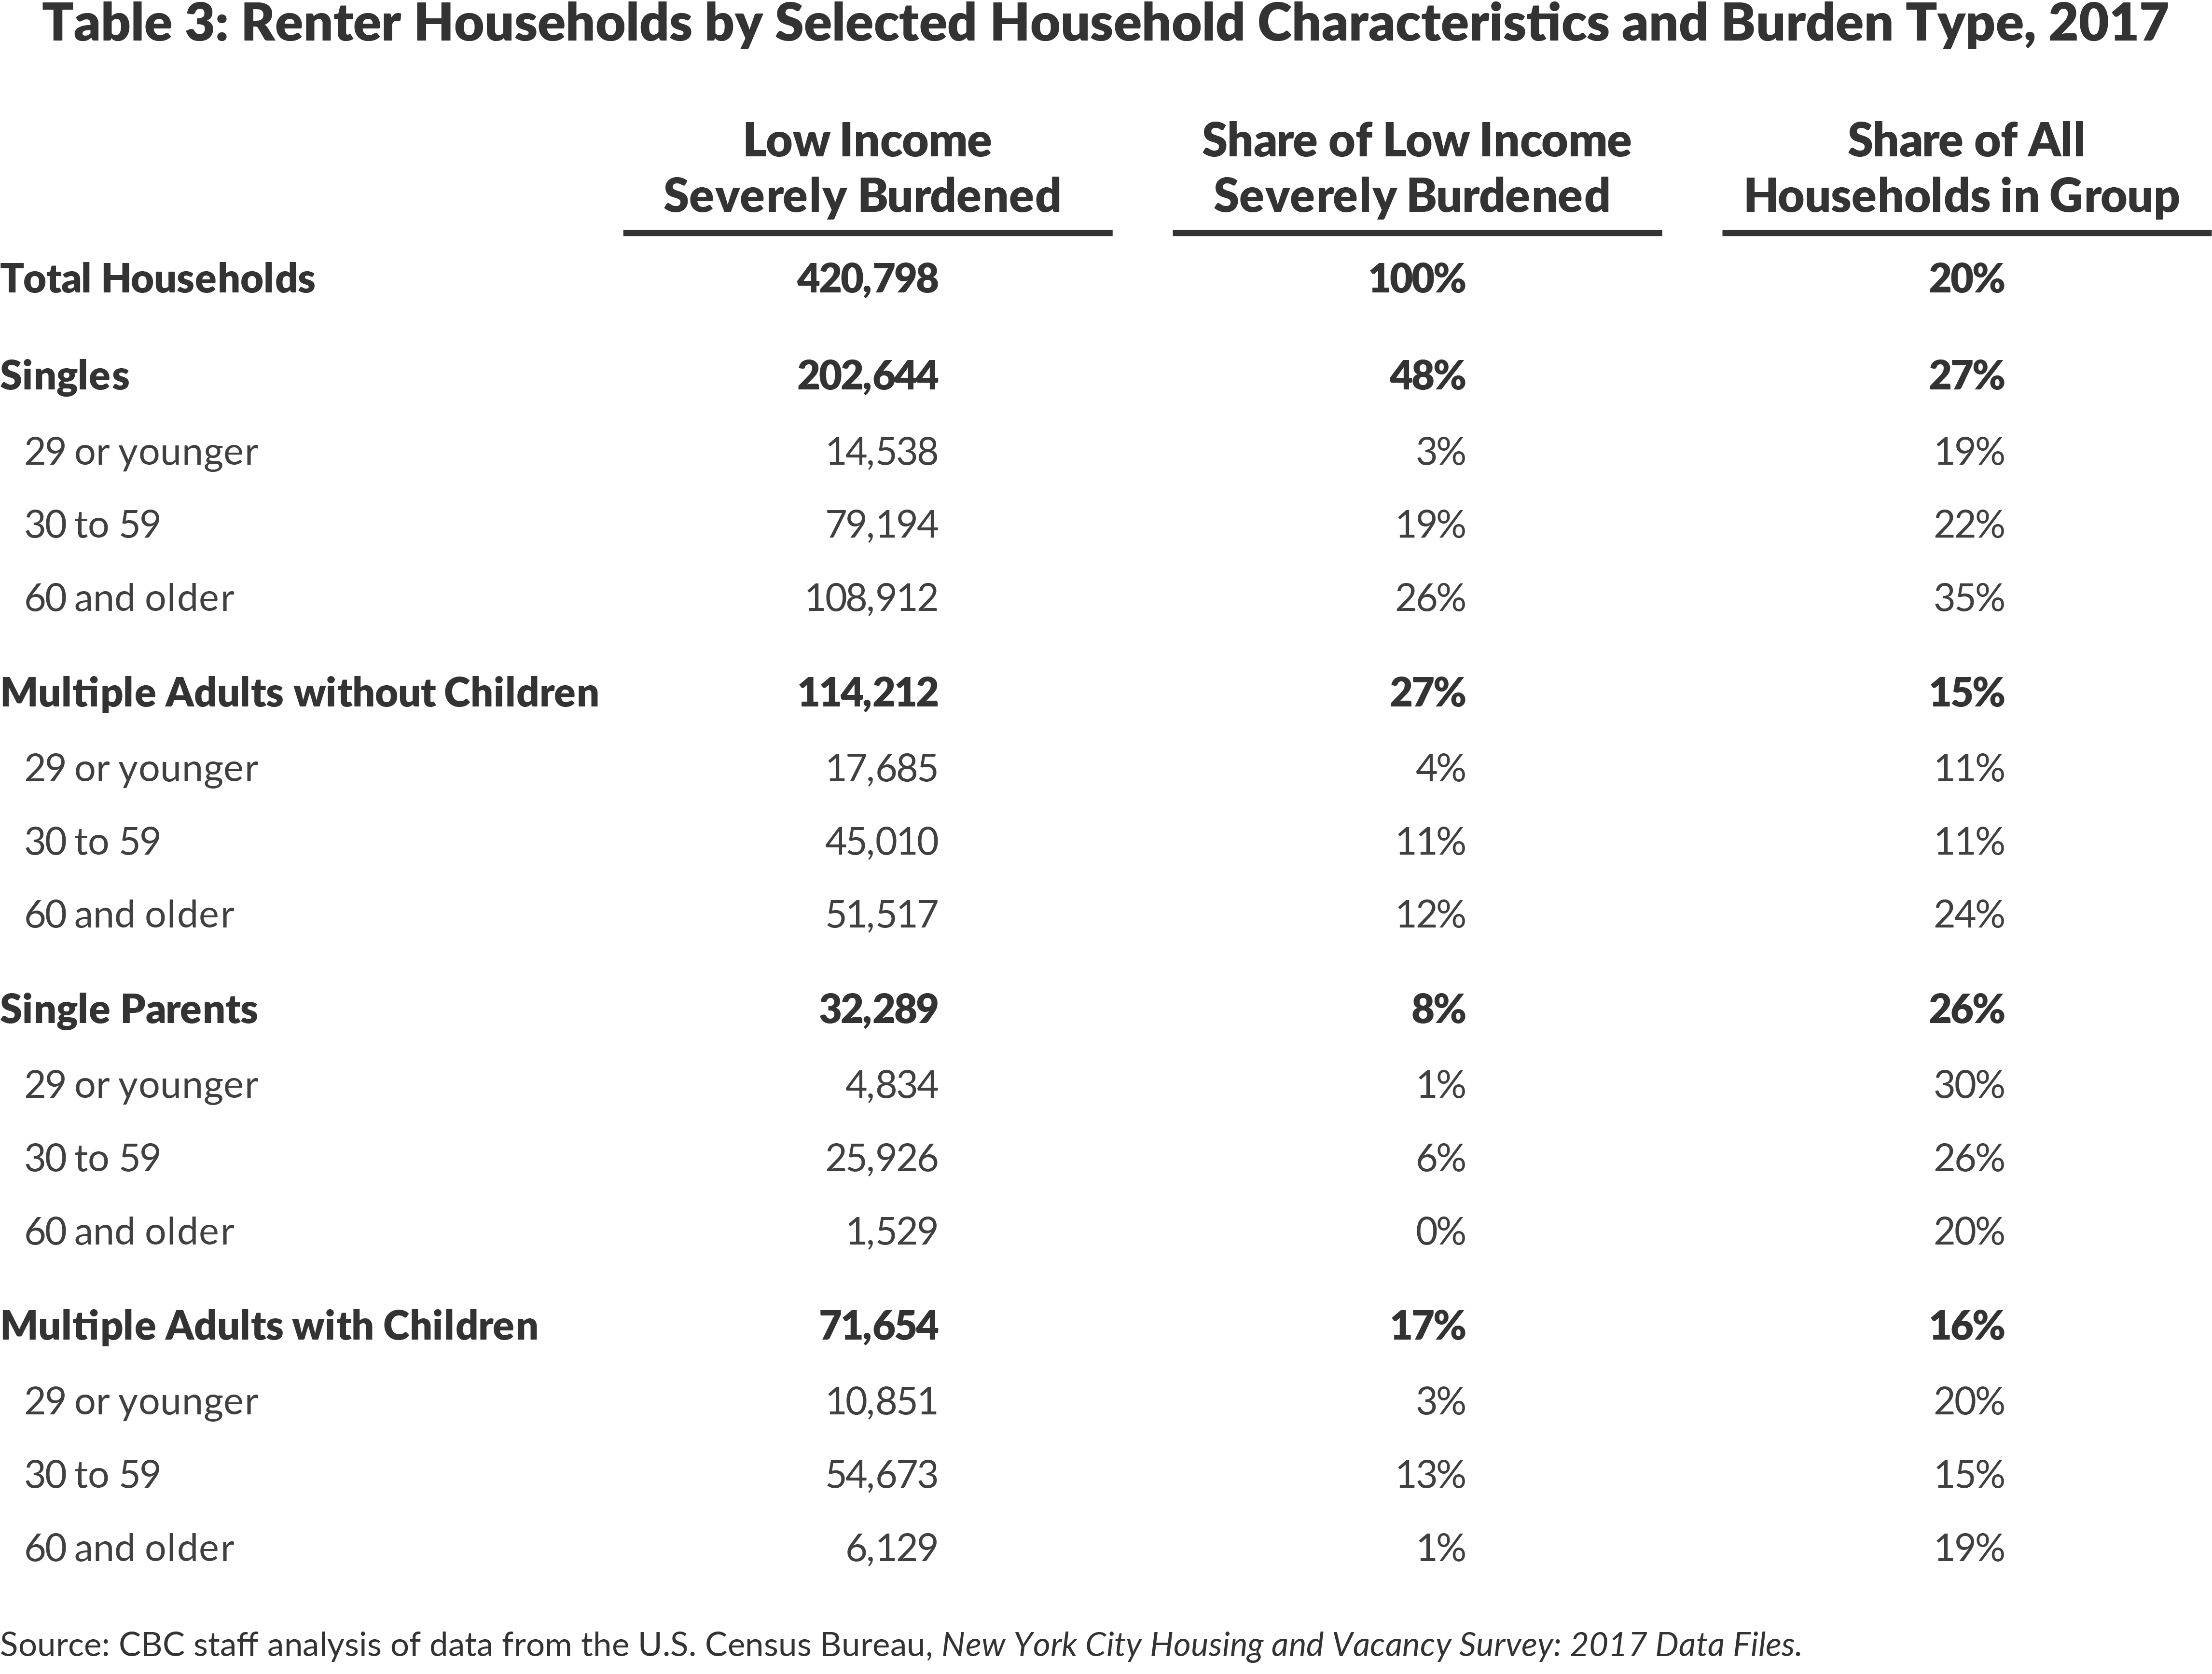
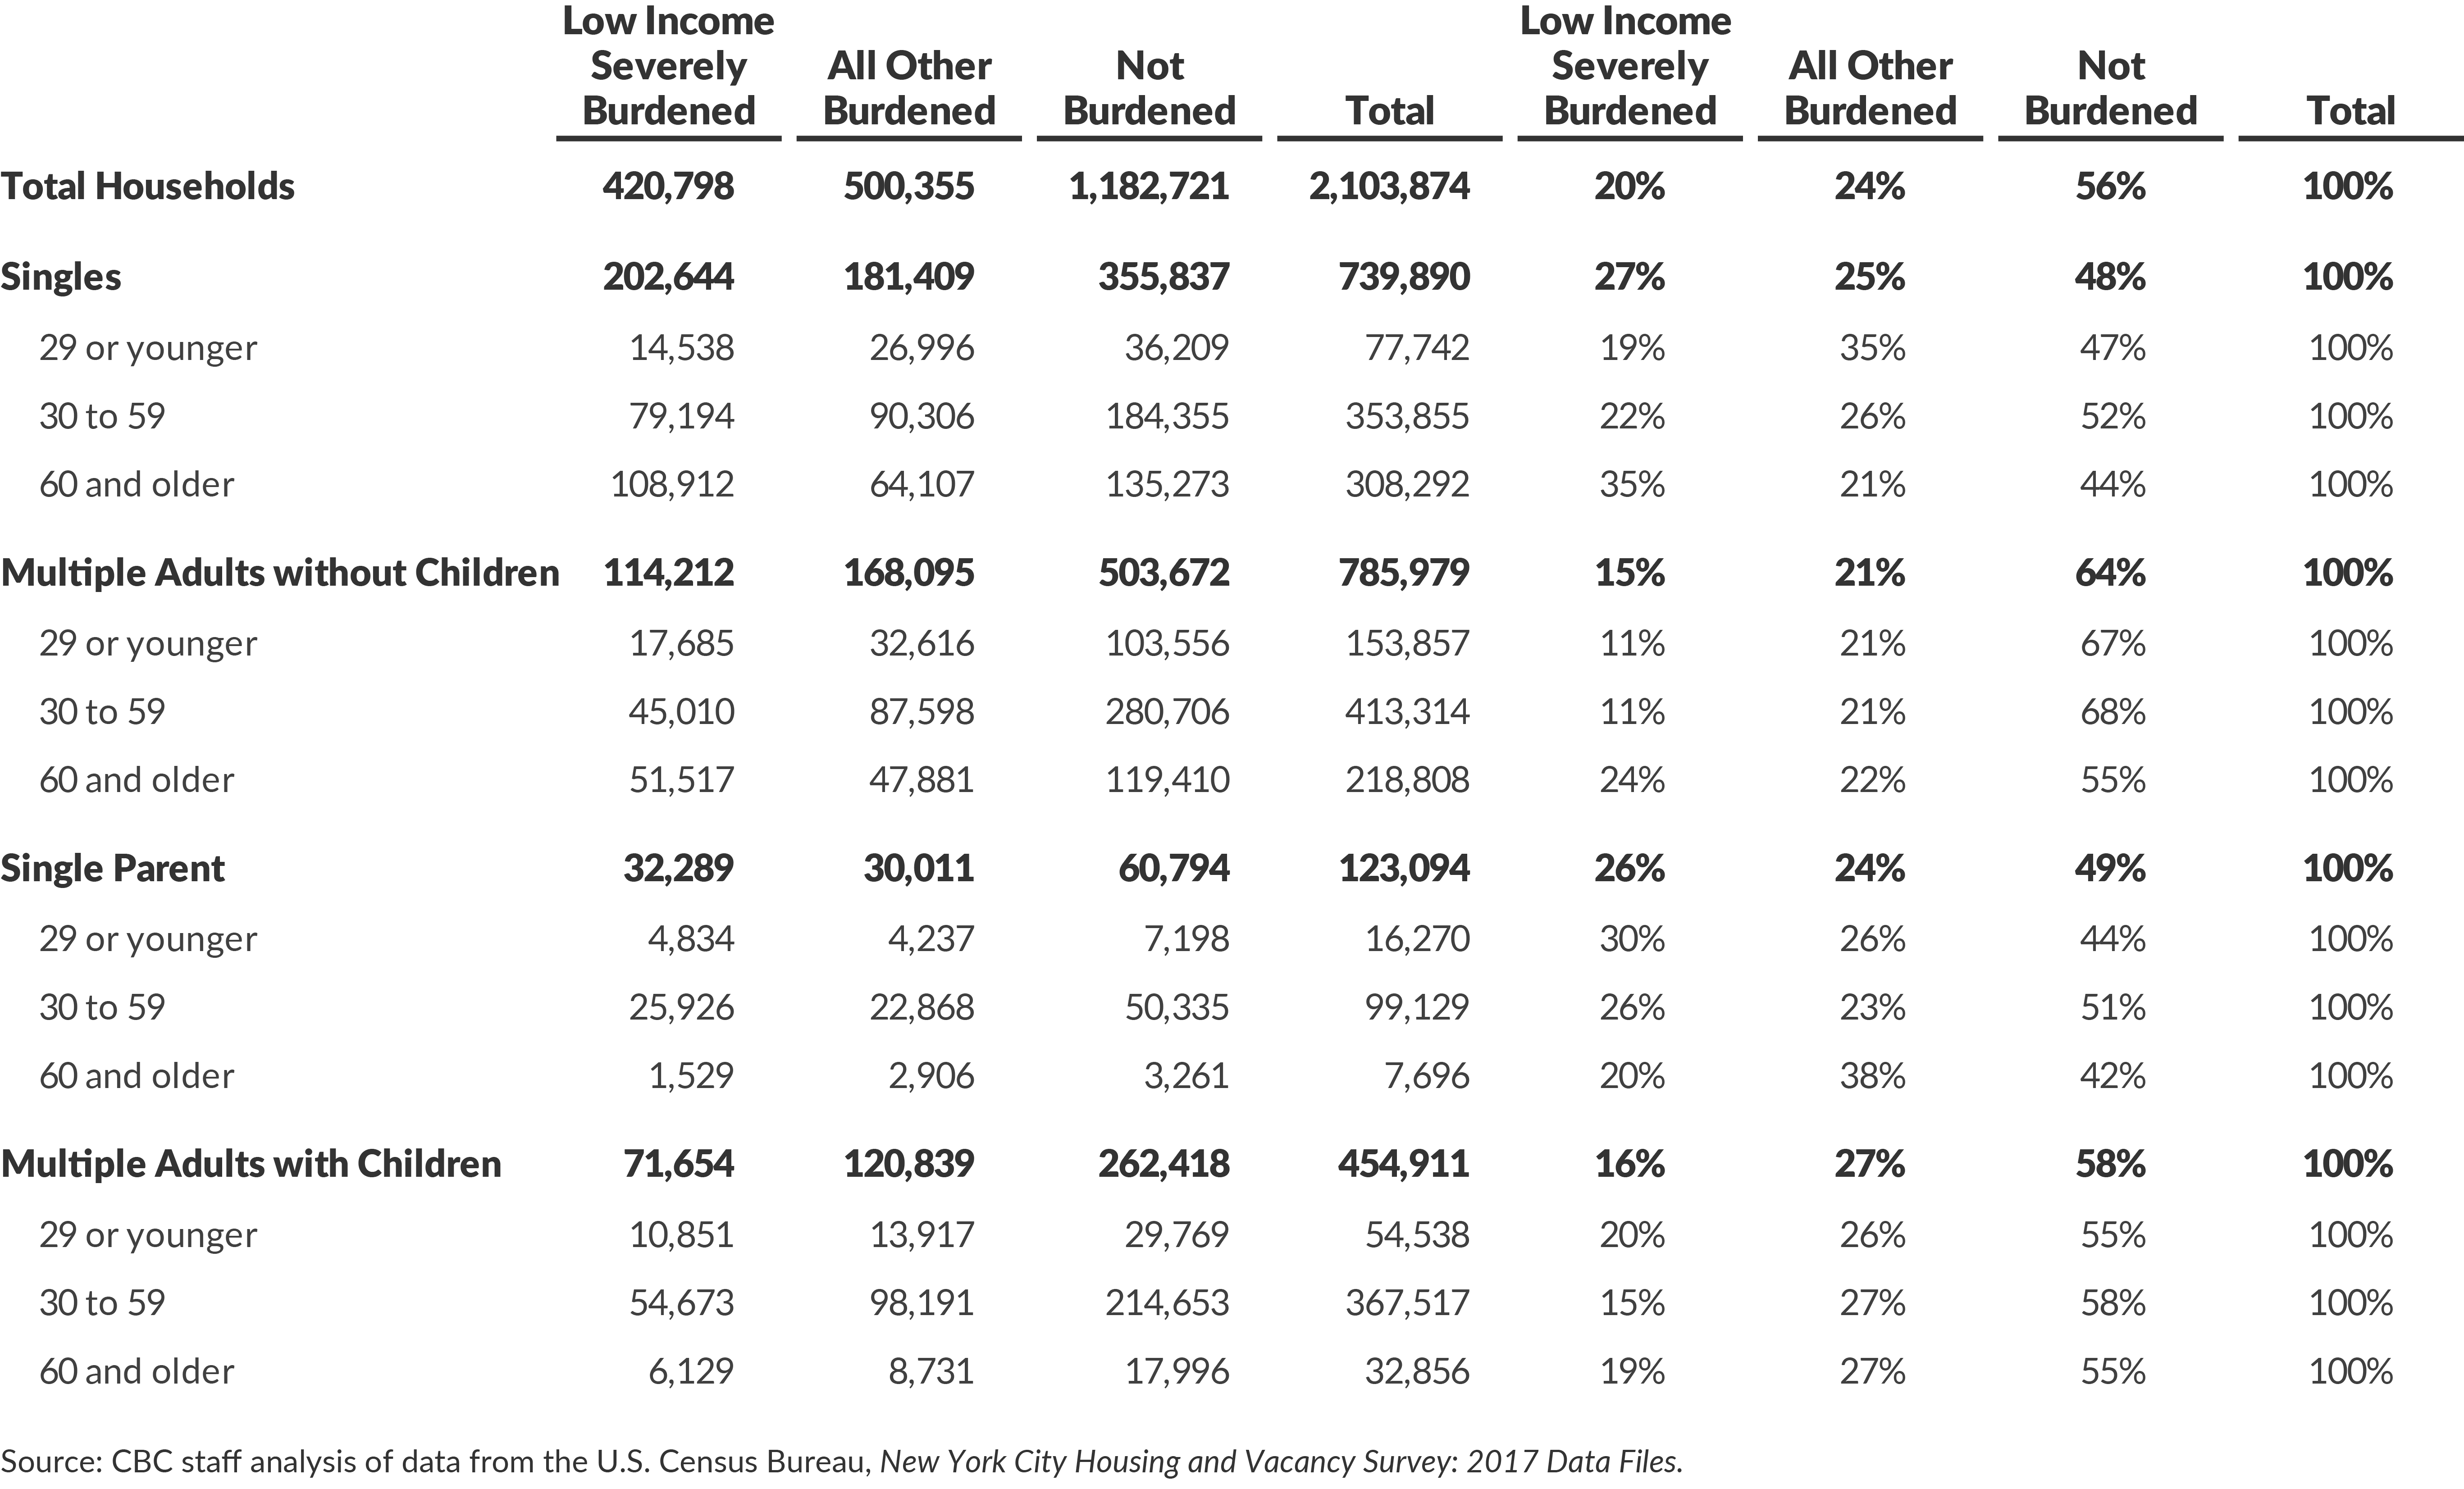
As shown in Table 3, single households constitute almost half of all low-income, severely rent-burdened households. Low-income single seniors (age 60 and over) and young single parents (age 29 and under) were the groups most likely to be severely rent burdened: More than 30 percent of all senior households (rising to 35 percent among single seniors) and 30 percent of all young single parent households were low income and severely rent burdened in 2017. This compares to 20 percent of the overall renter population.
Overall, a greater share of single households (27 percent) and single parent households (26 percent) were low income and severely rent burdened than households with multiple adults with children (16 percent) and without children (15 percent).
Change Since 2014
CBC last conducted an analysis of New York’s rental affordability problem in 2015 using data from the 2014 HVS. Since that time the share of burdened renters increased slightly, rising from 42 percent to 44 percent, an increase of 30,115 households.4 The severely burdened share remained steady at 22 percent of households, as shown in Figure 2. Burdens increased in the groups most likely to be severely burdened: low-income single households, seniors, and single parent households. (See Figure 3.) The share of low-income severely burdened households grew from 24 to 26 percent for single parents; from 25 percent to 27 percent for singles; and from 27 percent to 30 percent for seniors.5


What Works Best?
The HVS provides information that identifies the types of housing and support that have been most effective for managing the rent burdens of the ELI and VLI renter households who are not rent burdened.
Figure 5 shows that nearly all of the city’s 271,000 non-burdened ELI and VLI households benefit from at least one public subsidy program. Two-thirds of these households benefited from one of two federal housing benefits: public housing or the Section 8 Housing Choice Voucher program. A small percentage of renters also live in buildings that receive HUD benefits through programs that support senior or supportive housing. These programs use federal subsidies to make up the difference between what low-income households can afford to pay in rent and the actual cost of operating their unit.6
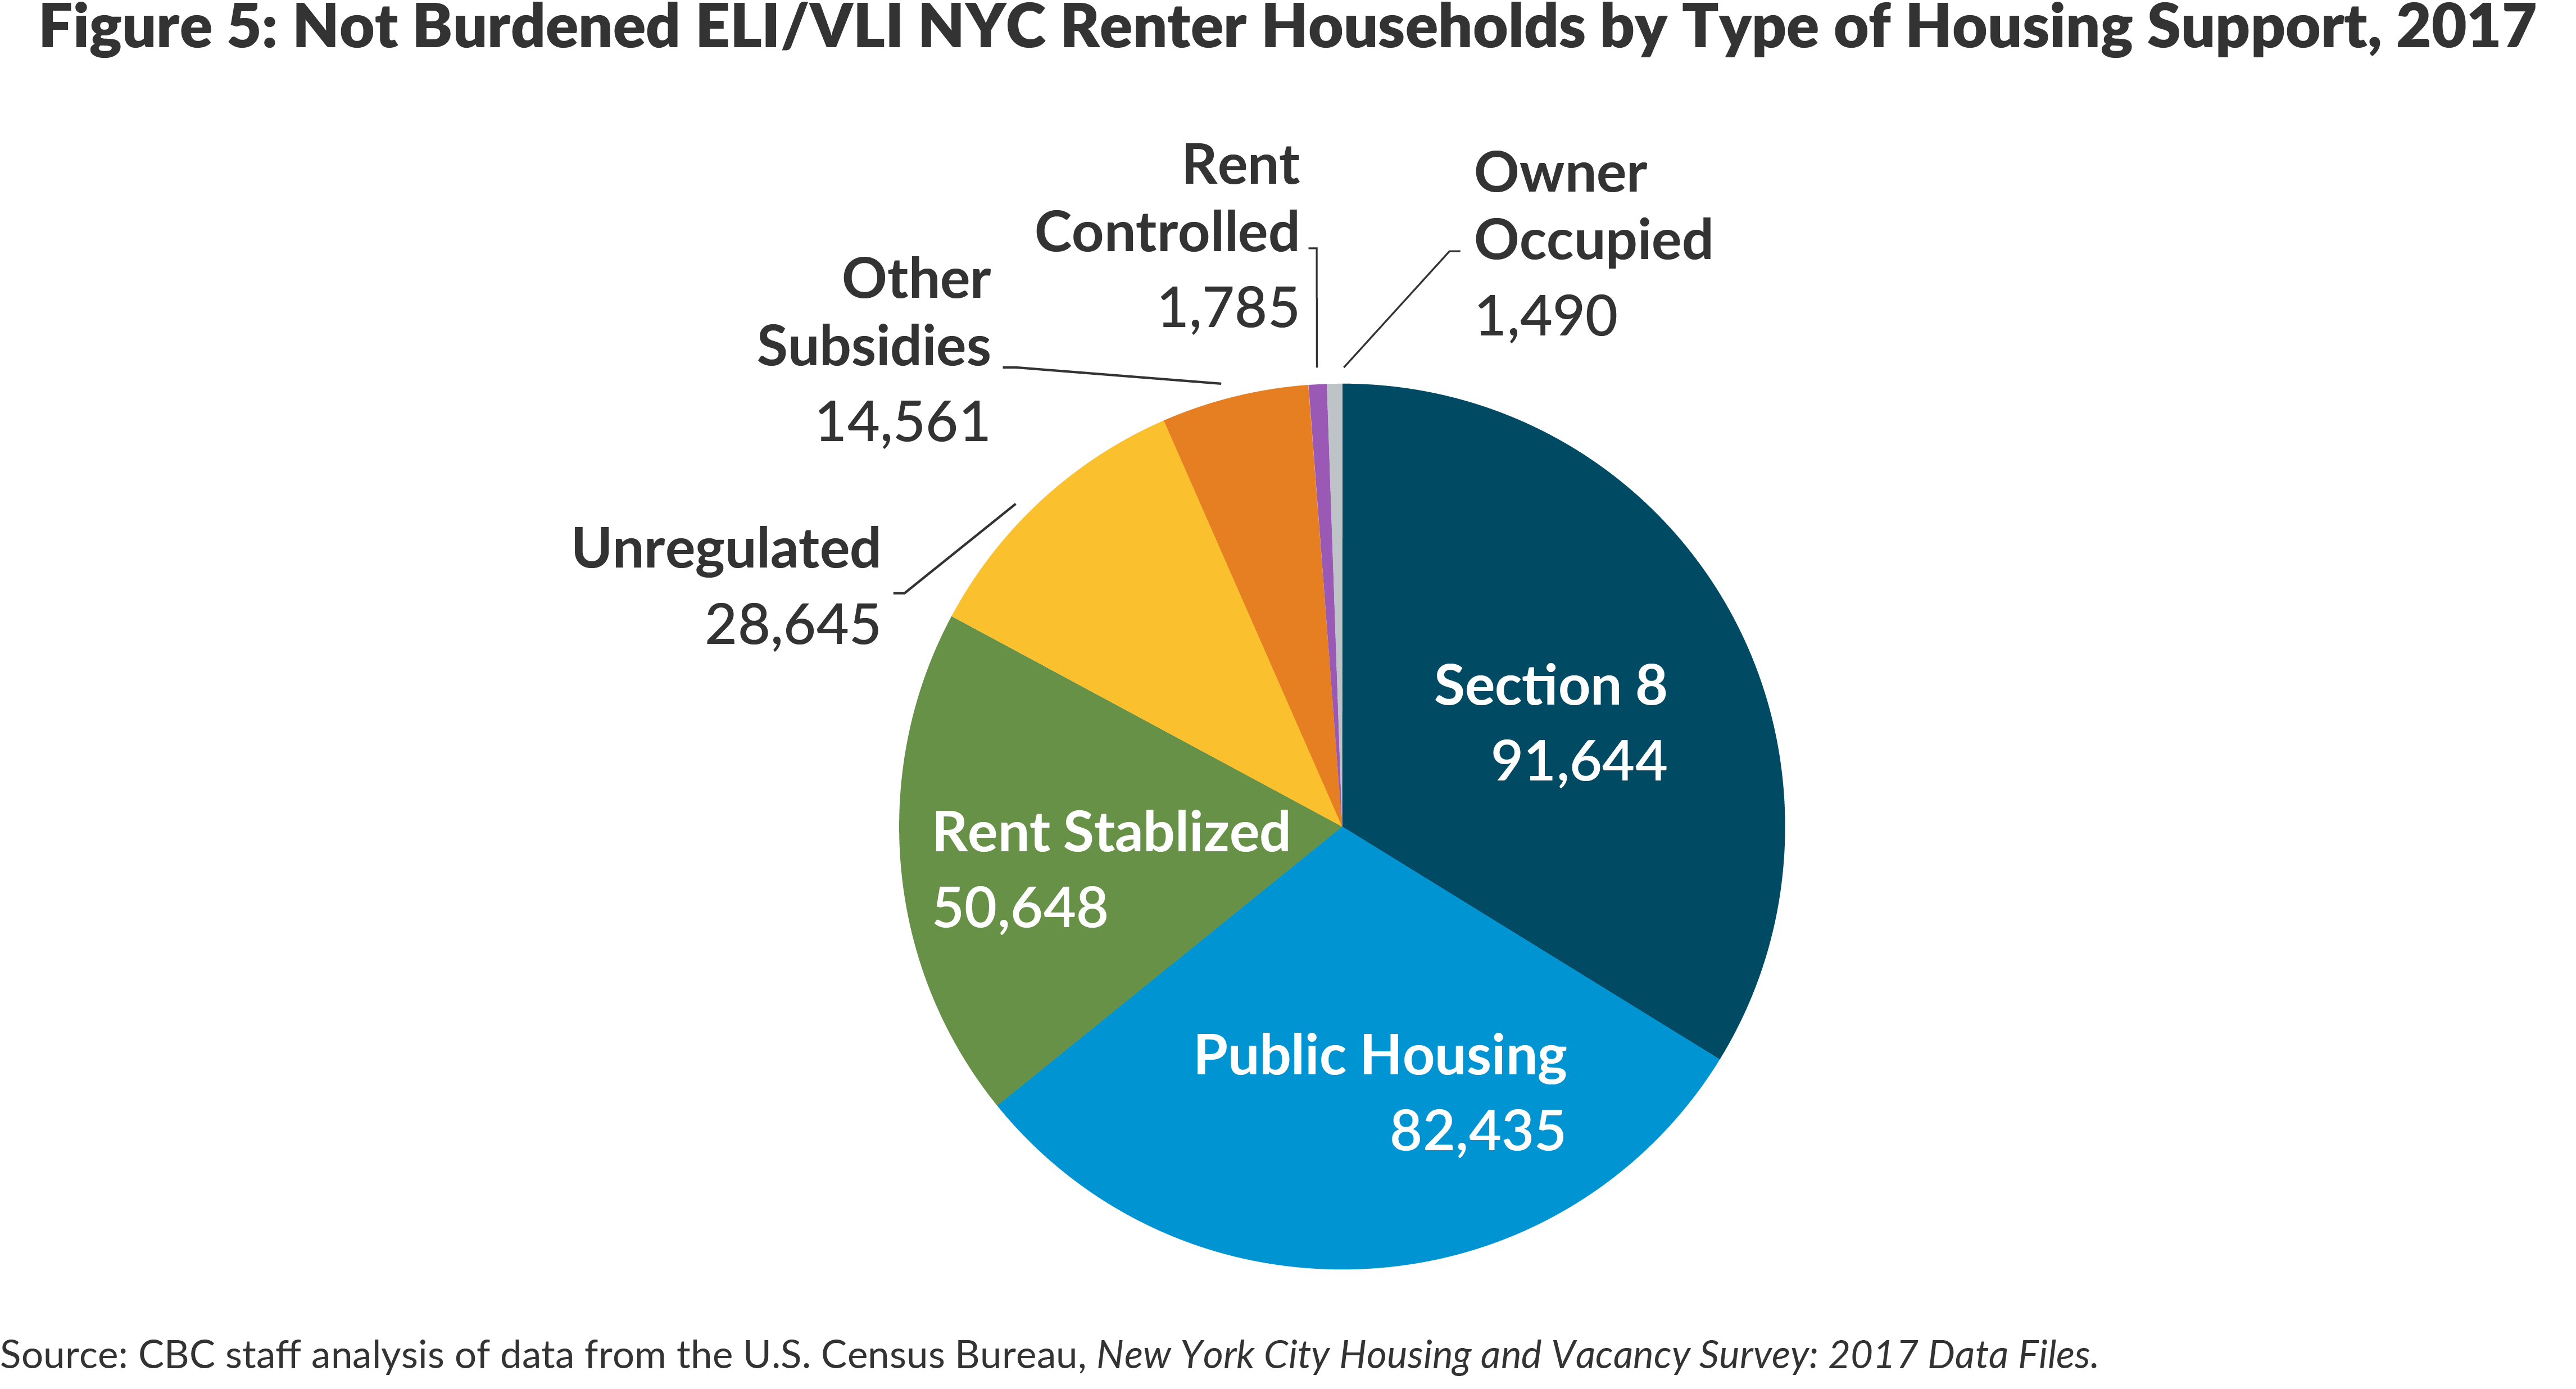
Another 20 percent of non-burdened households live in rent stabilized or Mitchell-Lama rental buildings. The HVS dataset does not include information on whether these buildings receive any additional benefits, such as 421-a, that subsidize construction or ongoing operations. 7 These subsidy programs typically require landlords to set aside a certain percentage of units as affordable housing and opt into the rent regulation system in exchange for receiving public benefits. While they are an important source of affordable housing, they help significantly fewer ELI and VLI households than the federal programs.
Just 11 percent of non-burdened ELI/VLI households live in units that are not subject to rent regulation and do not receive any local, state, or federal subsidies. Of these households, more than half live in two-family homes, and more than 70 percent live in buildings with five or fewer units. Small rental properties provide the bulk of housing units that are affordable without requiring public subsidy, but these units account for only a fraction of the overall need.8
Conclusion
This analysis illustrates the challenges associated with housing New York City’s lowest income households. As of 2017, more than 462,000 households in New York City were severely rent burdened. Nearly 80 percent of these severely rent-burdened households are ELI or VLI–a total that exceeds the Mayor’s entire 300,000 unit Housing New York plan. The City cannot be expected to handle the affordability problem on its own.
The extent of these needs underscores the important role of public housing in New York City’s housing market. Federal subsidies for public housing and rental vouchers have been important tools for providing affordable housing for ELI and VLI families because these households require the deepest levels of subsidy.9 NYCHA owns more than 175,000 units of public housing and provides permanently affordable housing to hundreds of thousands of the city’s lowest income residents. The average family living in NYCHA housing earns $24,423 and pays $522 each month in rent.10 Yet after years of underfunding and mismanagement, NYCHA’s public housing units are in the worst physical condition of any rental housing in the city.11 The estimated cost of bringing these units back to a state of good repair is nearly $32 billion, a figure that vastly exceeds NYCHA’s or the City’s financial wherewithal. Without dramatic action, many of its developments will soon reach the point at which they are no longer cost-effective to repair. Any strategy to protect or preserve affordable housing must include New York City’s public housing and requires State and federal assistance.
Appendix
Footnotes
- CBC staff analysis of data from the U.S. Census Bureau, New York City Housing and Vacancy Survey: 2017 Microdata (accessed August 9, 2018), https://www.census.gov/data/datasets/2017/demo/nychvs/microdata.html.
- Another factor not included in the Adjusted Income Measure is transportation costs. Owing to New York City’s extensive public transportation system and low rates of car ownership, New York has the lowest transportation costs of any major American city. As a result, despite having one of the most expensive housing markets, the cost of living in New York is comparatively more affordable after accounting for transportation spending. For more information, see: Rahul Jain and Charles Brecher, Housing Affordability Versus Location Affordability: The Rent’s Too Damn High! But the Metrocard is a Pretty Good Deal (Citizens Budget Commission, August 2014), https://cbcny.org/research/housing-affordability-versus-location-affordability. HUD no longer updates the Location Affordability dataset used in that report, and CBC was not able to update the analysis with more recent data.
- The U.S. Census Bureau conducted interviews for the 2017 HVS between the months of January and May 2017, during which time HUD’s fiscal year 2016 income limits were in effect. The income limits in this analysis are based on the fiscal year 2016 thresholds.
- Data from the 2014 HVS cited in this report is drawn from CBC’s 2015 analysis. See: Rahul Jain and Michael Dardia, “Whose Burden Is It Anyway? Housing Affordability in New York City by Household Characteristics,” Citizens Budget Commission Blog (November 12, 2015), https://cbcny.org/research/whose-burden-it-anyway.
- In addition, the share of severely burdened ELI and LI households grew between 2014 and 2017, though the share of VLI households that were severely burdened fell from 39 percent to 35 percent. Since the HVS does not track the same households over time, the survey does not offer any insight into why VLI households saw improvement while other income categories stayed the same or grew worse.
- In the case of public housing, federal subsidies flow to the New York City Housing Authority to cover the authority’s operating shortfall and capital needs. In the case of Section 8 Housing Choice Vouchers, the subsidy is paid to private landlords to make up the difference between a “fair market rent,” as determined by HUD, and 30 percent of the tenant’s income. The HVS also has information on the type of buildings in which Section 8 households live. While Section 8 recipients live in a variety of buildings, they disproportionately reside in rent stabilized properties and are underrepresented in unregulated/free market buildings. This suggests that any expansion of funding for housing vouchers programs at the local or federal levels, may need to be paired with greater enforcement of anti-income discrimination laws to ensure that landlords of all types of housing accept housing vouchers.
- Units built under Mandatory Inclusionary Housing (MIH) without public subsidy may eventually fall into this category, but only a small number of units have been built through MIH without public subsidies to date.
- Some of these households may be doubling up with family members, friends, or unrelated adults in one housing unit in order to afford their rent. This analysis did not take into account whether non-burdened households live in overcrowded units.
- Rahul Jain and Michael Dardia, “The Cost of Affordable Housing,” Citizens Budget Commission Blog (December 15, 2015), https://www1.nyc.gov/assets/nycha/downloads/pdf/NYCHA-Fact-Sheet_2018_Final.pdf.
- Sean Campion, “NYCHA’s Physical Conditions Remain the Worst in the City: Insights from the 2017 Housing and Vacancy Survey,”Citizens Budget Commission Blog (August 29, 2018), https://cbcny.org/research/nychas-physical-conditions-remain-worst-city.