Welcome Back, Joe Lhota!
On the last day of the scheduled 2017 legislative session, the Governor appointed, and the state Senate confirmed, Joe Lhota as Chairman of the Metropolitan Transportation Authority (MTA). Lhota returns to the agency where he served as chairman and chief executive officer from January to December 2012. Much has occurred since Lhota last chaired an MTA board meeting. The following five charts illustrate the agency’s current plight.
Declining Performance
Subway ridership, which had already grown nearly 60 percent from 1996 to 2012, continued to grow 3 percent annually in 2013 and 2014 before slowing to 1 percent in 2015 and declining 0.3 percent in 2016.1 First quarter ridership in 2017 is 1.7 percent lower than that of last year. This decrease in ridership is lagging a longer-term decline in subway performance. (See Figure 1.) Since January 2013 the share of trains reaching their scheduled terminal on time has fallen from 84 percent to 66 percent and the number of trains meeting the MTA’s wait assessment guideline—a measurement of how often trains maintain scheduled headways—fell from 79 percent to 76 percent.2

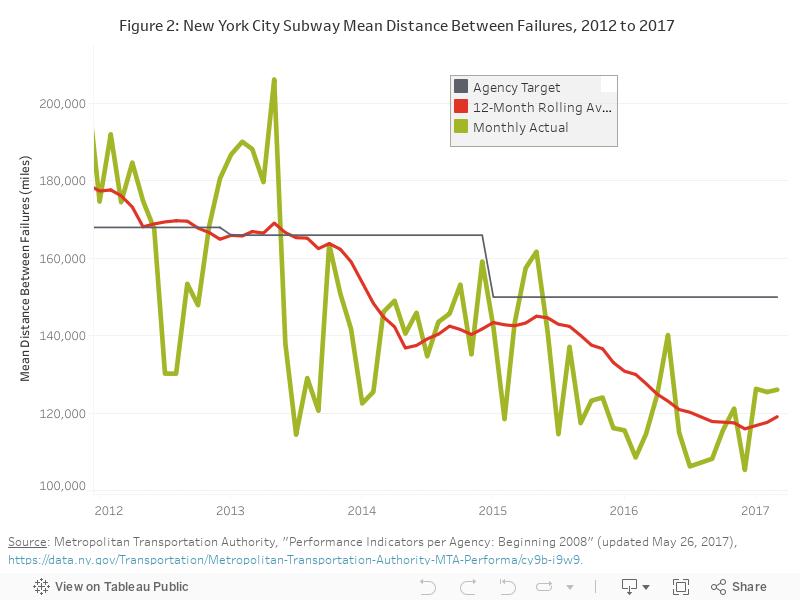
Delays have multiple causes including overcrowding and reduced train speeds in work zones, but two significant factors are related to inadequate capital investments. First, many delays are caused by signal problems, and devices from the aged system are being modernized slowly. Second, subway car performance has also fallen off as the pace of car replacement has slowed. (See Figure 2.) Since January 2013 the 12-month rolling average for the mean-distance-between-failure (MDBF) of subway cars— the average number of miles a subway car travels in service before a mechanical failure causes the car to arrive at its final destination late—has declined 28 percent, from 165,946 miles to 119,090 miles as of March 2017. Moreover, the agency has surpassed its monthly goal twice since May 2013, despite lowering this standard by 10 percent in 2015.
The reliability of bus service has also declined. Turnaround: Fixing New York City’s Buses, a report from the TransitCenter, shows a decrease in reliability for 32 of 36 local bus routes in 2015.3 Righting these worrying trends in performance will require managerial and policy reforms.
A Summer of Hell
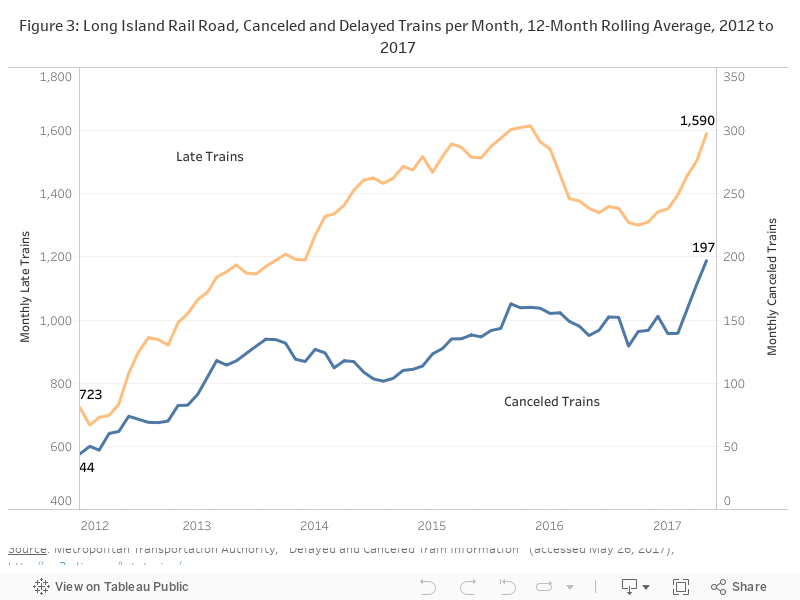
If July is supposed to bring the “summer of hell” for Long Island Rail Road (LIRR) commuters, many would be forgiven for fearing an extended purgatory. The railroad’s on-time performance has decreased only slightly—the 12-month rolling average dropped from 93.9 percent as of January 2013 to 92.2 percent as of March 2017, but the number of canceled trains, not included in this total, has increased substantially. From January 2013 to May 2017 the 12-month rolling average of trains canceled and partially canceled per month has more than doubled, from 91 to 197. Average delayed trains per month increased from 1,064 to 1,590. (See Figure 3.)
Many of the problems associated with LIRR delays stem from chokepoints, some of which are controlled by Amtrak. The MTA will need to work with regional partners to ensure the riding public is spared as much inconvenience as possible and ensure scheduled trains run on time.
Not Enough Help is On the Way
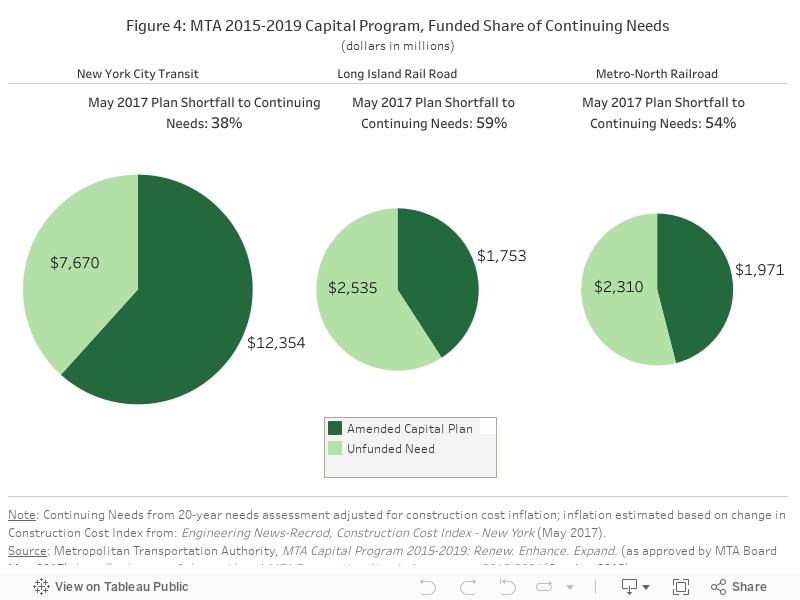
The most recent amendment to the MTA 2015-2019 capital plan reduced total state of good repair and normal replacement commitments from $12.7 billion to $12.4 billion; decreasing sums dedicated to signals and communications systems, subways cars, and line equipment. Funding for New York City Transit’s existing infrastructure amounts to less than two-thirds of what is needed over the next five years according to the MTA’s 20-year needs assessment. (See Figure 4.) Funding for the Long Island Rail Road and Metro-North Railroad amount to less than half of what is needed for each railroad over the next five years.
As the MTA reevaluates the current capital program and looks to the 2020-2024 plan, leaders should prioritize those investments needed to restore the system and enhance capacity in the most cost-effective manner. A more transparent process should be pursued so that the public may hold the board responsible for distributing limited capital dollars wisely.
Billions in Uncommitted Capital Projects
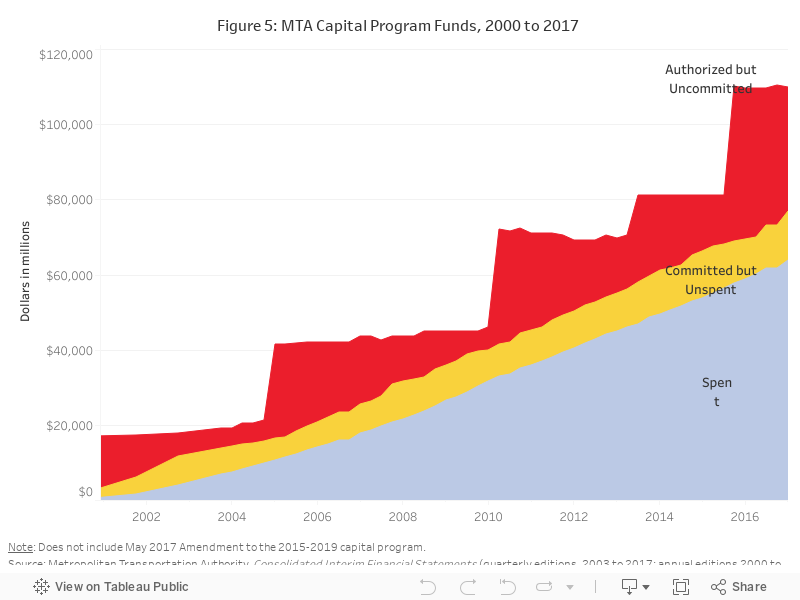
Even if the MTA secured additional funding to bring the system to a state of good repair, it is unclear if the agency could adequately manage the corresponding projects. As of March 2017, the 2015-2019 capital plan and the three previous plans—2000-2004, 2005-2009, 2010-2014— have included more than $110 billion in approved capital investments. Of this amount, $64 billion has been spent, $13 billion has been committed but remains unspent, and $33 billion has been authorized but remains uncommitted. (See Figure 5.) This includes more than $17 billion in unspent funds from previous plans, or more than one-fifth of these previously approved investments.
The MTA 2015-2019 capital plan may be nominally the largest five-year capital plan in the agency’s history, but despite being halfway through the plan period, only one-fifth of the plan’s funds have been committed. To modernize the system, these investments should be accelerated to the maximum extent possible.
During his previous tenure as chairman, Lhota presided over the MTA as it faced the unique challenges posed by Hurricane Sandy and the storm’s aftermath. This time he is presented with an assortment of crises more varied and chronic than before. Lhota told members of the State Senate he knows the MTA can do much better. Once again he has the opportunity to help.
Footnotes
- Mitchell L. Moss, Sarah M. Kaufman, Sam Levy, Ashley Smith, and Jorge Hernandez, The State of Subway Ridership (New York University Rudin Center for Transportation Policy & Management, March 2017), p. 8, https://wagner.nyu.edu/rudincenter/2017/04/new-report-subway-ridership-1975-2015.
- Wait Assessment measures time spent by customers waiting to board at stations. The measurement is the percentage of time intervals between trains not exceeding 125 percent of scheduled headways. See: Metropolitan Transportation Authority, “Performance Data Sets” (accessed June 22, 2017), http://web.mta.info/developers/performance.html.
- New York City Bus Coalition, Turnaround: Fixing New York City’s Buses (published by TransitCenter, July 2016), p. 4, http://transitcenter.org/publications/turnaround-fixing-new-york-citys-buses/#press.