What’s Happening at Your Fire Station?
Citizens Budget Commission’s December 2015 report Twenty Years Later: Integrating Services in the New York City Fire Department examined the Fire Department’s (FDNY's) changing workload over the past 30 years. The report highlighted a substantial decline in fires, which mirrors national trends, and a sharp increase in medical and other emergencies. As the report explained, the fire department has contended with the rise in medical emergencies by supplementing emergency medical service (EMS) response with that of firefighters. Firefighting units, organized into engine and ladder companies, no longer respond most frequently to fires.
CBC has prepared an interactive map that shows “runs,” or responses to emergencies, made by engine and ladder companies in fiscal year 2015. The map allows users to analyze the types of emergencies to which their local fire companies respond.
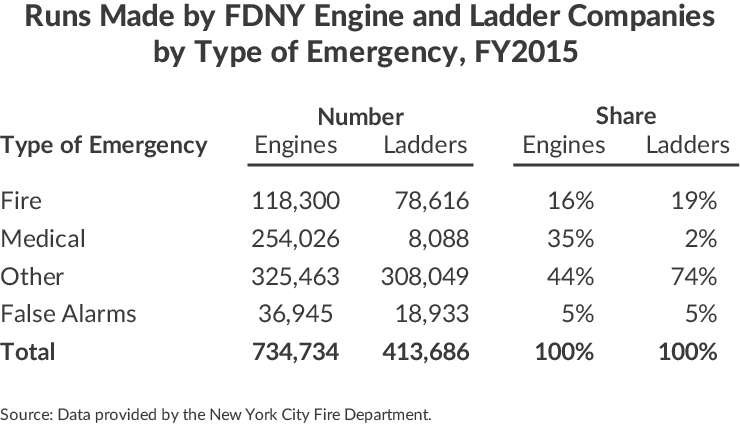
In fiscal year 2015, engine and ladder companies completed more than 1.1 million runs; nearly 735,000 by engines and more than 413,000 by ladders. The relative number of runs can be explained by the number of each type of company (198 and 143 respectively, including specialty units) and the nature of incidents to which each type of company responds. Both engine and ladder companies respond to fires; a standard response for a fire requires a run by at least one engine and one ladder company. Engine companies are also dispatched to medical calls, the largest portion of FDNY incidents overall. Ladder companies are involved in a wide range of non-fire, non-medical incidents, like utility emergencies and elevator malfunctions.
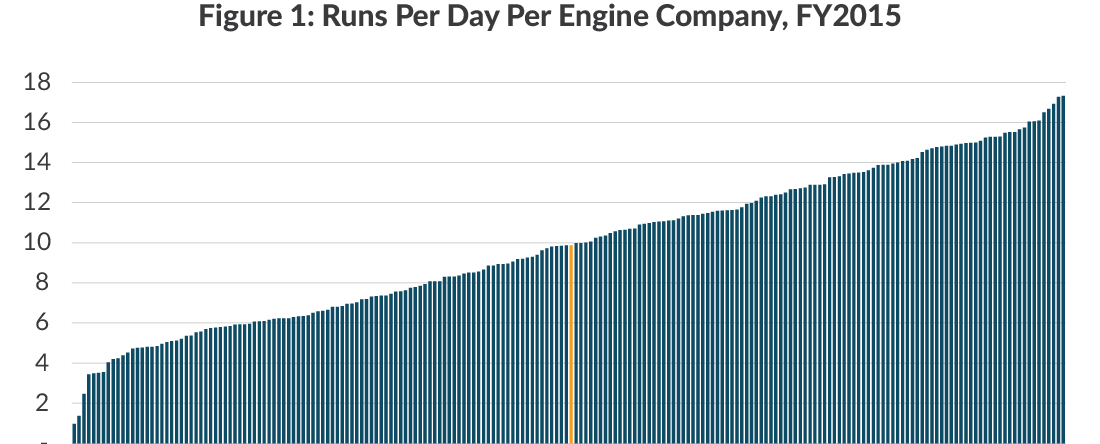
While engines tend to be busier than ladders, runs made by individual engine and ladder companies vary significantly by community. The Bronx had both the least active and most active engine companies in fiscal year 2015. E070 on City Island made 355 runs, less than one a day, while E062 on White Plains Road made 6,320 runs, about 17 a day. On average, the city’s engine companies made just under 10 runs a day.
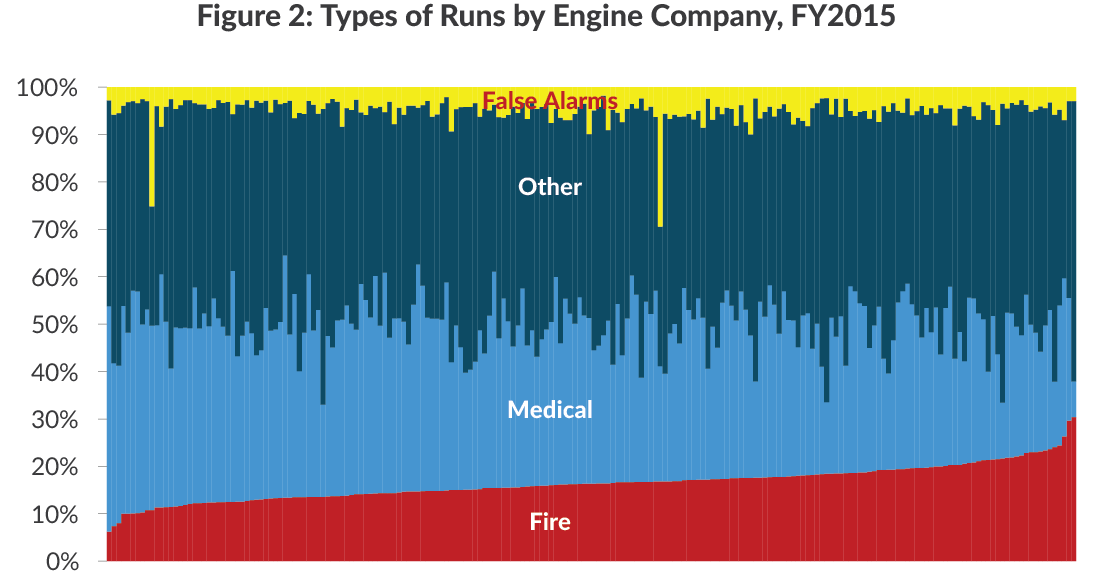
Fires comprise no more than 30 percent of runs for any engine company; on average fire runs are 16 percent of engine runs. Medical emergencies were 34 percent of all engine company responses; engine companies E001 in Manhattan and E298 in Queens had the heaviest medical workload, up to 50 percent of daily runs or about eight per day. Other emergencies were 45 percent of all engine runs and false alarms were 5 percent of runs overall, although there are two Brooklyn engine companies for which false alarms continue to be a big problem, constituting more than 25 percent of runs.
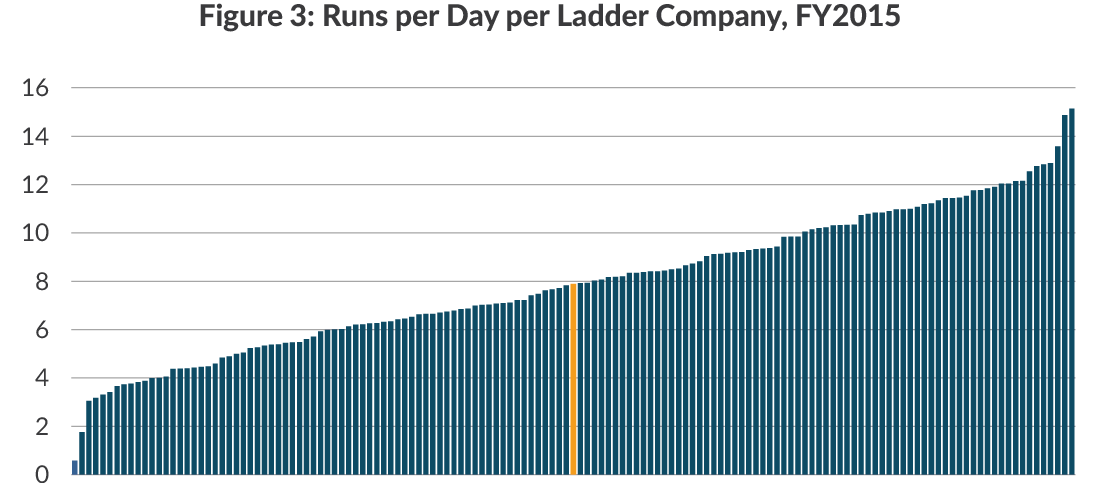
Ladder companies made just under 8 runs a day on average. L053 on City Island made the fewest runs, 209 in fiscal year 2015 or 3 runs every 5 days, and L043 on 3rd Avenue in Manhattan was the busiest, with 5,524 runs, about 15 a day. As with engine companies, fire runs constituted no more than 30 percent of runs for any ladder company; the average was 19 percent. Ladder companies are not typically sent to medical emergencies; medical runs averaged 2 percent of runs and false alarms 4 percent. Other emergencies, or non-fire, non-medical incidents, accounted for 74 percent of all ladder company runs; the average ladder company made 6 runs and the busiest made 12 runs a day.

Use CBC’s interactive map to discover how your local engine and ladder companies compare to those around the city.