A Better Way to Pay for Solid Waste Management
New York City spends $1.5 billion annually, or about $500 per household, to pick up residential and public trash.[1] This operation involves more than 2,000 garbage collection trucks and 5,900 sanitation workers. A May 2014 Citizens Budget Commission report found on a per-ton basis, garbage collection costs at the City’s Department of Sanitation (DSNY) are more than double that of New York City private waste carters and higher than costs at other public agencies in U.S. cities.[2] This significant public expense is accompanied by large negative impacts on the environment due to the City’s high reliance on distant landfills, primarily in Virginia, Ohio, Pennsylvania, and South Carolina. DSNY’s landfilled trash produces more than 1 million tons of greenhouse gas emissions, the equivalent of burning 13,500 tanker trucks of gasoline.[3]
Addressing the fiscal and environmental costs of garbage will require a bold redesign of New York City solid waste management. CBC has issued recommendations to that end, including managed competition for residential garbage collection and conversion of refuse into energy. However, the City’s current financing structure for garbage operations poses a major obstacle. Because residential trash removal is funded by general city tax revenues, and dwarfed by the City’s $76 billion budget, residents do not perceive its costs.
This policy brief explores a new financing method for residential garbage removal, namely a volume-based garbage fee. The first section discusses the four main benefits of a garbage fee: 1) service cost visibility, 2) waste reduction, 3) independent access to capital, and 4) fairness. The next section describes financing practices for residential trash services in other large and dense cities. The third section addresses challenges associated with garbage fees, and the final section outlines options for structuring a new financing model for solid waste.
The Benefits of a Volume-based Garbage Fee
Volume-based garbage financing structures come in many forms and are known as variable pricing, unit pricing, pay-as-you-throw (PAYT), or save-as-you-throw (SAYT). The underpinning of such financing systems is an economic incentive to reduce non-recyclable and non-compostable waste. The four main benefits of volume-based garbage fees are: 1) service cost visibility, 2) waste reduction, 3) independent access to capital, and 4) fairness.
Service Cost Visibility
Unlike residents of other municipalities, and unlike New York City businesses, New Yorkers are generally unaware of garbage collection and disposal costs. If the City financed solid waste management with variable fees, rather than general tax revenues, residents would be more cognizant of the current cost structure, as well as any future changes. Approaches exist to levy fees on people residing in small homes as well as large apartment buildings. In most U.S. cities that levy monthly garbage fees, the charges appear on a municipal utility bill, such as the bill for water or for gas; a few large European and Asian cities require the purchase of official garbage bags or tags to affix to non-official bags.
In cities with garbage fees, the frequency of rate changes varies, but all changes reflect growth in the cost of services and must be explained by officials. Notably, prior to adopting a fee schedule for 2013 through 2016, Seattle released a detailed study of projected expenses.[4] Most other cities lack the comprehensive planning of Seattle but must still explain rate changes to the public. For example, when San Jose increased its basic charge for single-family homes 3 percent this year from $29.95 to $30.84 per month, after holding rates flat for three years, officials explained the increase was necessary to cover cost-of-living adjustments in contracts with private haulers and program improvements.[5] In San Antonio, officials explained a rate increase in fiscal year 2014 from $17.44 to $17.69 per month was necessary to fund increased fleet labor costs, equipment replacement costs, and yard waste disposal.[6] A year later San Antonio adopted an additional $1 per month fee to offset falling recycling commodity prices and to finance increased fleet maintenance costs.[7] In Dallas a 3 percent increase in the monthly fee from $20.64 to $21.31 for fiscal year 2015 will cover increases in merit pay and fleet maintenance.[8]
The process for increasing garbage fees in other cities mirrors New York City’s process for raising water rates. Each year the City’s Water Board issues a report called the “Blue Book” which details the finances of the Municipal Water Finance Authority and compares the City’s rates to other cities.[9] Following the report’s release, the City holds public hearings in each of the five boroughs on the proposed change to the rate.
In the near term, two key events will likely increase the cost of New York City solid waste management, but because changes in the cost of services are covered by general tax revenues, the increases will be practically imperceptible to residents. First, New York City’s contract with sanitation workers expired in 2011 and is under negotiation. About 60 percent of DSNY’s budget for solid waste ($927 million) is for worker wages, health insurance, pension contributions, and other employee benefits.[10] Second, in the next few years public trash disposal costs will grow significantly as the City eliminates long-haul waste export by truck in favor of more fuel-efficient rail and barge transport. In 2015 the City plans to open the first of four marine transfer stations in Manhattan, Brooklyn, and Queens; the prices at these stations are expected to initially be more than 50 percent higher than current fees and then stabilize during a 20-year contract period.[11] In fiscal year 2013 the City spent about $300 million to transport and dispose of non-recyclable refuse, about one-fifth of the solid waste budget.[12]
Waste Reduction
Landfill reduction is a key component of Mayor Bill de Blasio’s environmental agenda. His administration has committed to increasing residential waste diversion from 15 to 30 percent by 2020 and to expanding residential and commercial organic waste collection.[13] The City Council and the Mayor have also committed to reducing citywide greenhouse gas emissions 80 percent by 2050. A December 2013 PlaNYC report on how to achieve the “80 by 50” goal counted 3.8 million tons of potential emission reductions from solid waste initiatives, including organic waste processing, greater recycling, and using waste-to-energy conversion.[14]
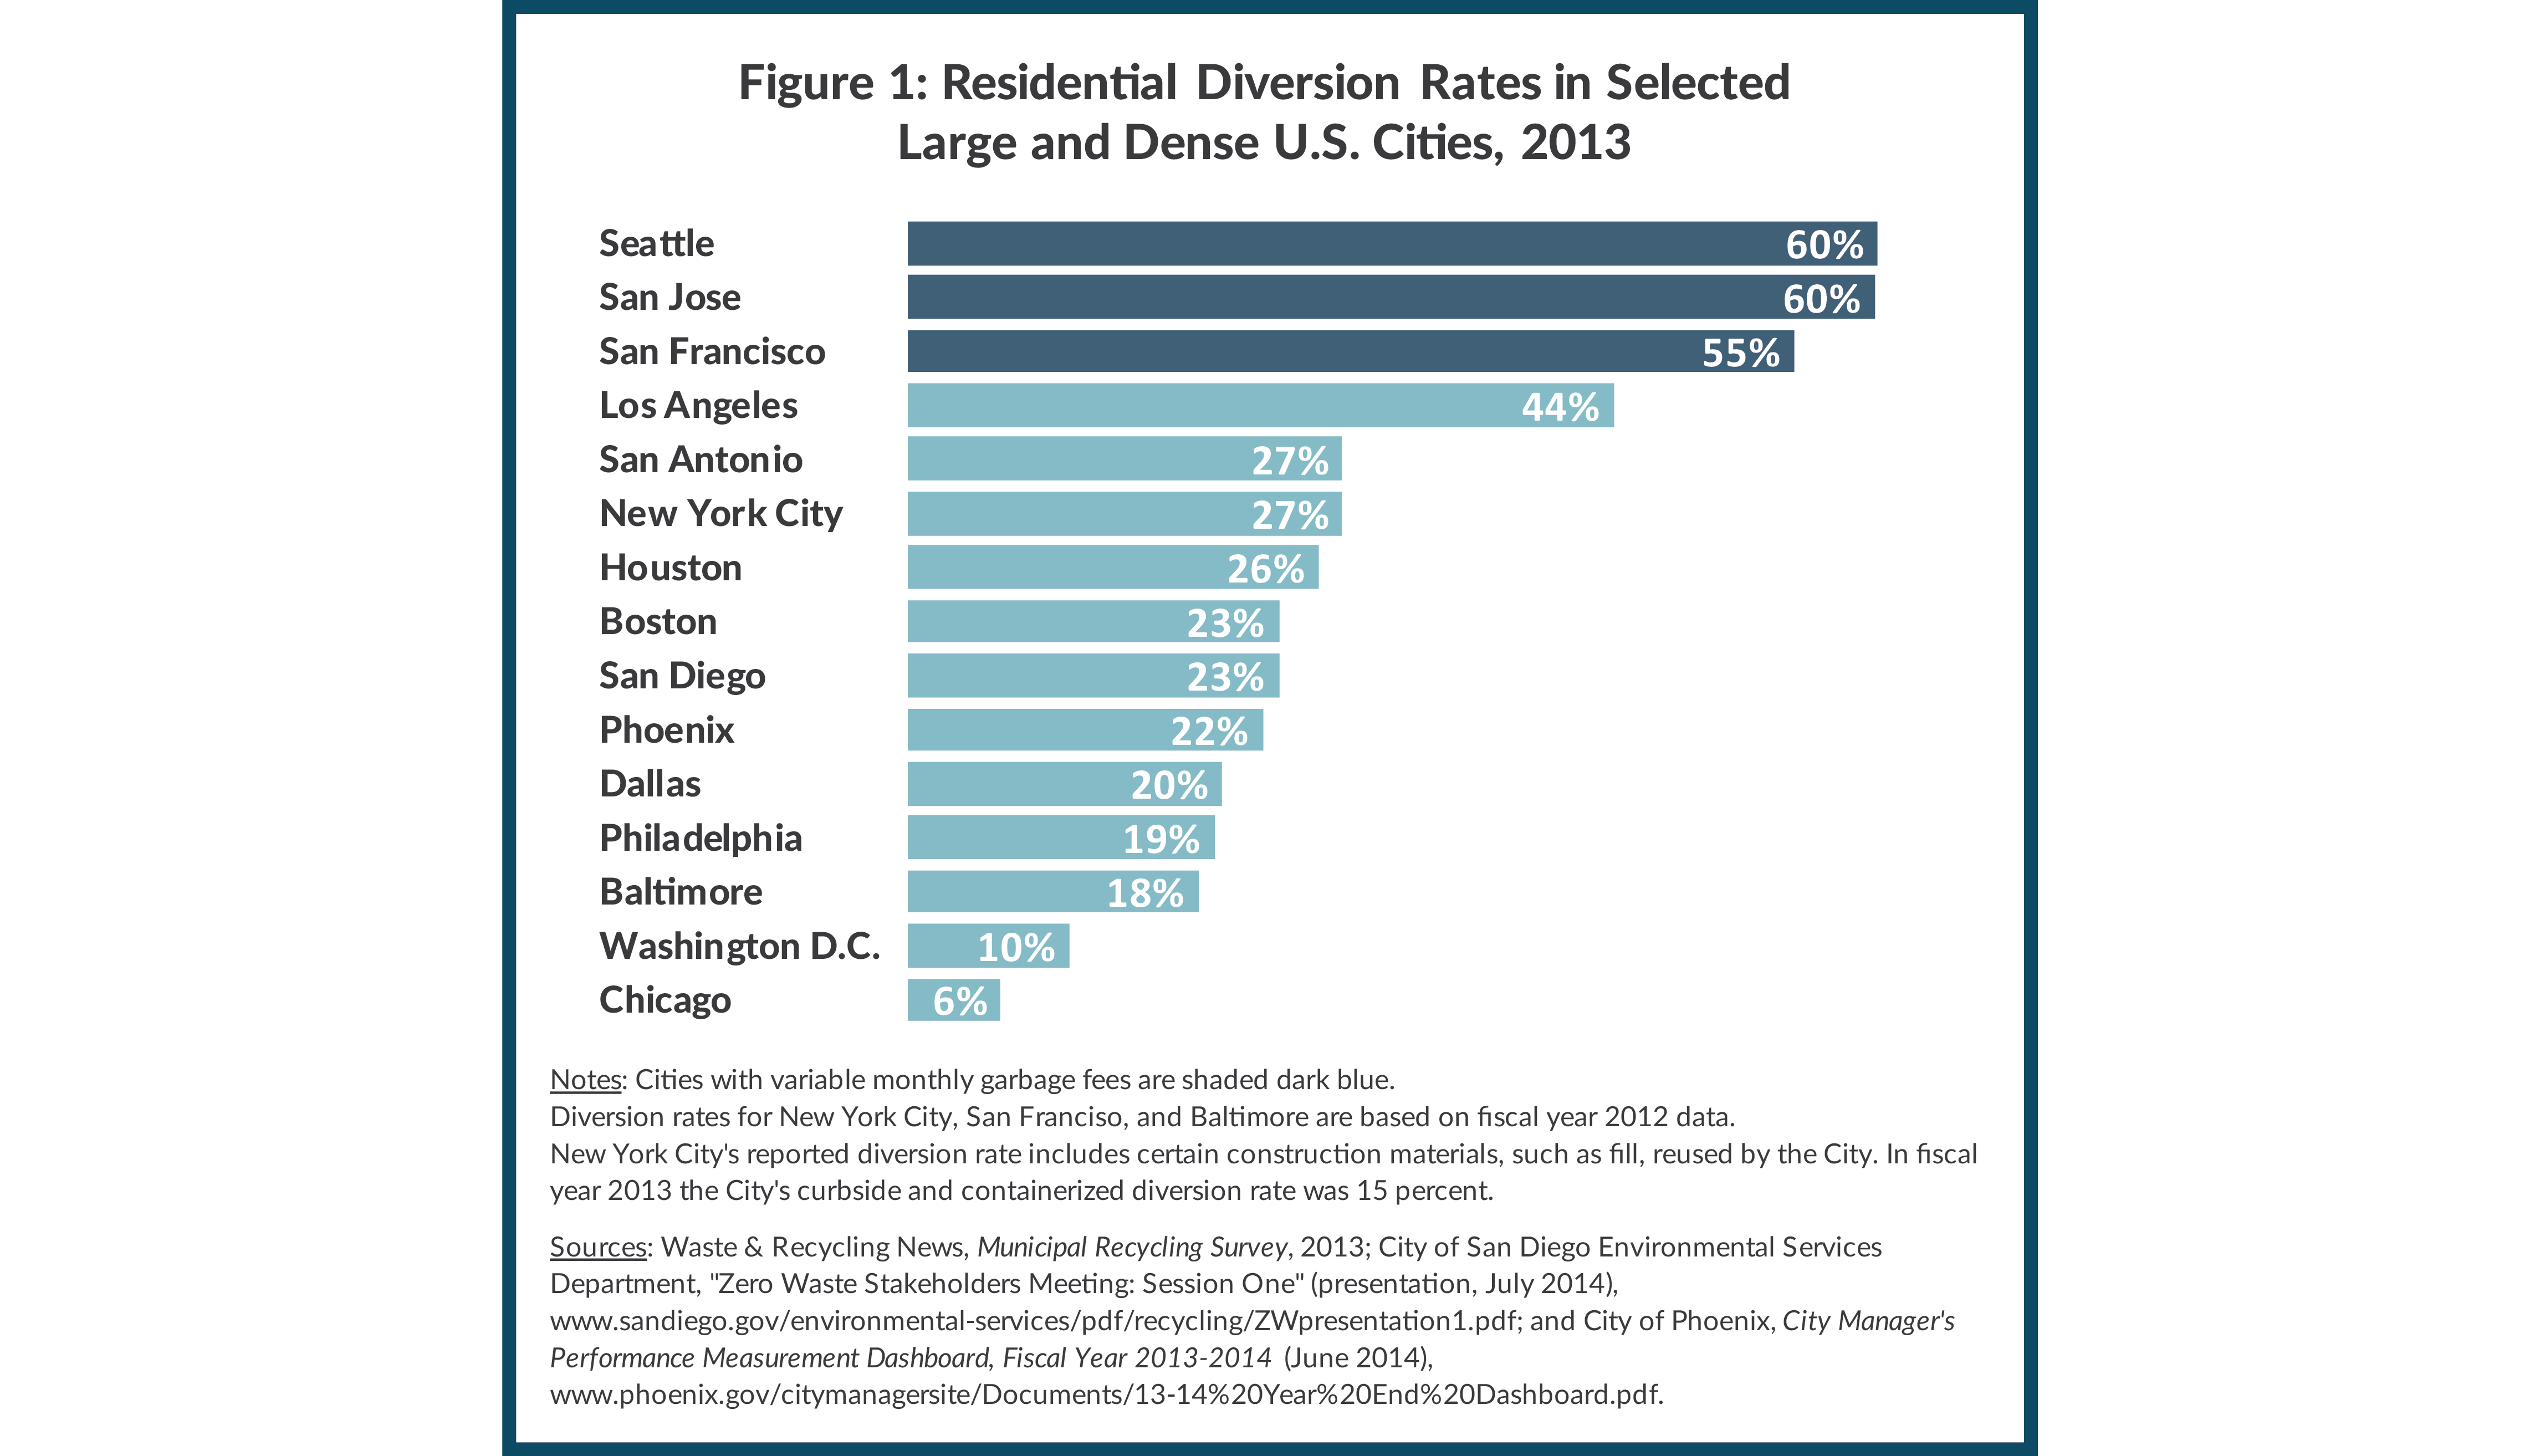
Volume-based residential garbage fees that imposed differential costs on different types of waste would help the City meet these goals by encouraging lower production of non-recyclable waste. A study of U.S. municipalities with variable charges found average refuse levels fell 17 percent after implementation, with refuse production down 6 percent and the remainder due to increased diversion.[15] Among large and dense U.S. cities, ones with the highest residential diversion rates – San Francisco, San Jose, and Seattle – use a monthly fee structure that varies based on how many bins or bags the household sets out for pick-up.[16] In 2013 the residential diversion rate was 55 percent in San Francisco and 60 percent in San Jose and Seattle; the next highest rate in the review was 44 percent in Los Angeles. (See Figure 1.)
In San Francisco and San Jose residents can select a refuse bin as small as 20 gallons or as big as 96 gallons. Seattle offers the smallest bin of all cities surveyed – a 12-gallon refuse bin for $19 per month.[17]Conversely, a 96-gallon refuse bin costs $93 per month. Notably, all three cities offer yard waste collection, and San Francisco and Seattle mandate the separation of food waste. In all three cities monthly fees for organics collection are much lower than fees for refuse.[18]
A similar fee structure in New York City might greatly boost participation in the voluntary residential organics programs. Organic waste makes up 31 percent of city waste, is heavy to transport, and produces methane gas, a potent greenhouse gas, when landfilled.[19] Thus, keeping it out of landfills and converting it to compost or biogas would significantly reduce the city’s carbon footprint and may reduce disposal costs. However, the added collection trucks to pick up organic waste will offset the environmental and financial savings unless DSNY can reduce refuse collection routes; this will require full compliance.
Independent Access to Capital
At present New York City owns little disposal infrastructure and relies heavily on public and private facilities in faraway locations. Investment in new disposal infrastructure, such as energy conversion plants, would reduce dependence on other municipalities, stabilize long-term costs, and reduce long hauls from the city. Moreover, if the City mandates commercial food waste separation and/or expands the residential organics pilot program, it will also need to invest in disposal capacity for organic waste. A new dedicated revenue stream would provide an independent source of funding for new solid waste infrastructure.
In Seattle garbage user fees fund pay-go capital and debt service on revenue bonds for solid waste infrastructure. Bonds issued in 2014 were rated Aa3 by Moody’s and AA by Standard & Poor’s (S&P), three notches below Moody’s rating of Aaa for Seattle’s general obligation bonds and two notches below the S&P’s rating of AAA.[20] Seattle’s recent capital improvement program for solid waste has included the replacement of two transfer stations and redevelopment of a closed landfill site.[21] San Antonio issues general obligation bonds for solid waste projects but uses garbage fees to pay the debt service.[22] Similarly, Phoenix has issued revenue bonds backed by city excise tax revenues to fund solid waste improvement projects, but revenue is transferred from the Solid Waste Fund to cover the debt service.[23]
Fairness
With user fees for public services, resident payments are in proportion to the benefit received. Economists generally support this goal, known as the benefits principle, given practical considerations and competing policy agendas. Such fee structures are the norm for other utilities – a New Yorker who consumes more electricity pays more than a person who consumes less. As a matter of fairness, it is commonly accepted that an energy-conscious household with energy-efficient appliances should pay less than a household that routinely leaves lights on and electronic devices plugged in. The same principle should apply to garbage. An environmentally-conscious family who properly recycles and donates or repurposes used items should not pay as much as a household that throws all used items into the trash. Presently, the only economic incentives to waste less are fines for noncompliance with recycling law and tax deductions for donating certain used items.Due to differences in housing size and recycling compliance, the variations in trash creation within New York City are significant. On average Staten Island households throw away about 2,300 pounds of refuse each year, compared to only 1,200 pounds in Manhattan and 1,900 pounds in the Bronx.[24] If the City expands organics collection, these disparities will grow. For a typical resident, organic waste is more than half of non-recyclable trash.[25] Residents who take the time to properly sort recyclable material and organic waste should not have to pay as much as those who do not.
Financing Garbage Services in Other Cities
Collecting and disposing of New York City residential and public trash cost $1.5 billion in fiscal year 2013.[26] The entirety of that expense was financed through general city revenues. CBC reviewed the financing practices for solid waste management in 14 other large and dense cities in the U.S., as well as the five largest global cities in developed countries, and found New York City’s pricing structure contrasts with many other cities.
Many Large U.S. Cities Fully Fund Garbage Operations with Related Revenues
With the exceptions of Boston and Chicago, all other large U.S. cities charge at least some fees associated with garbage collection and disposal. (Download Appendix A for a detailed description of garbage fees by city.) According to the most recent annual survey of local government finances by the U.S. Census Bureau, in fiscal year 2012 solid waste revenues ranged from 4.0 percent of related expenses in Houston to more than 95 percent of expenses in Dallas, Los Angeles, Phoenix, San Antonio, San Diego, and San Jose. The revenue coverage ratios are greater than 100 percent in some cities because the U.S. Census includes other garbage-related revenues, such as recycling sales, but excludes certain expenses, such as debt service and centrally-funded employee fringe benefits. (See Table 1.)
Download Appendix
Appendix A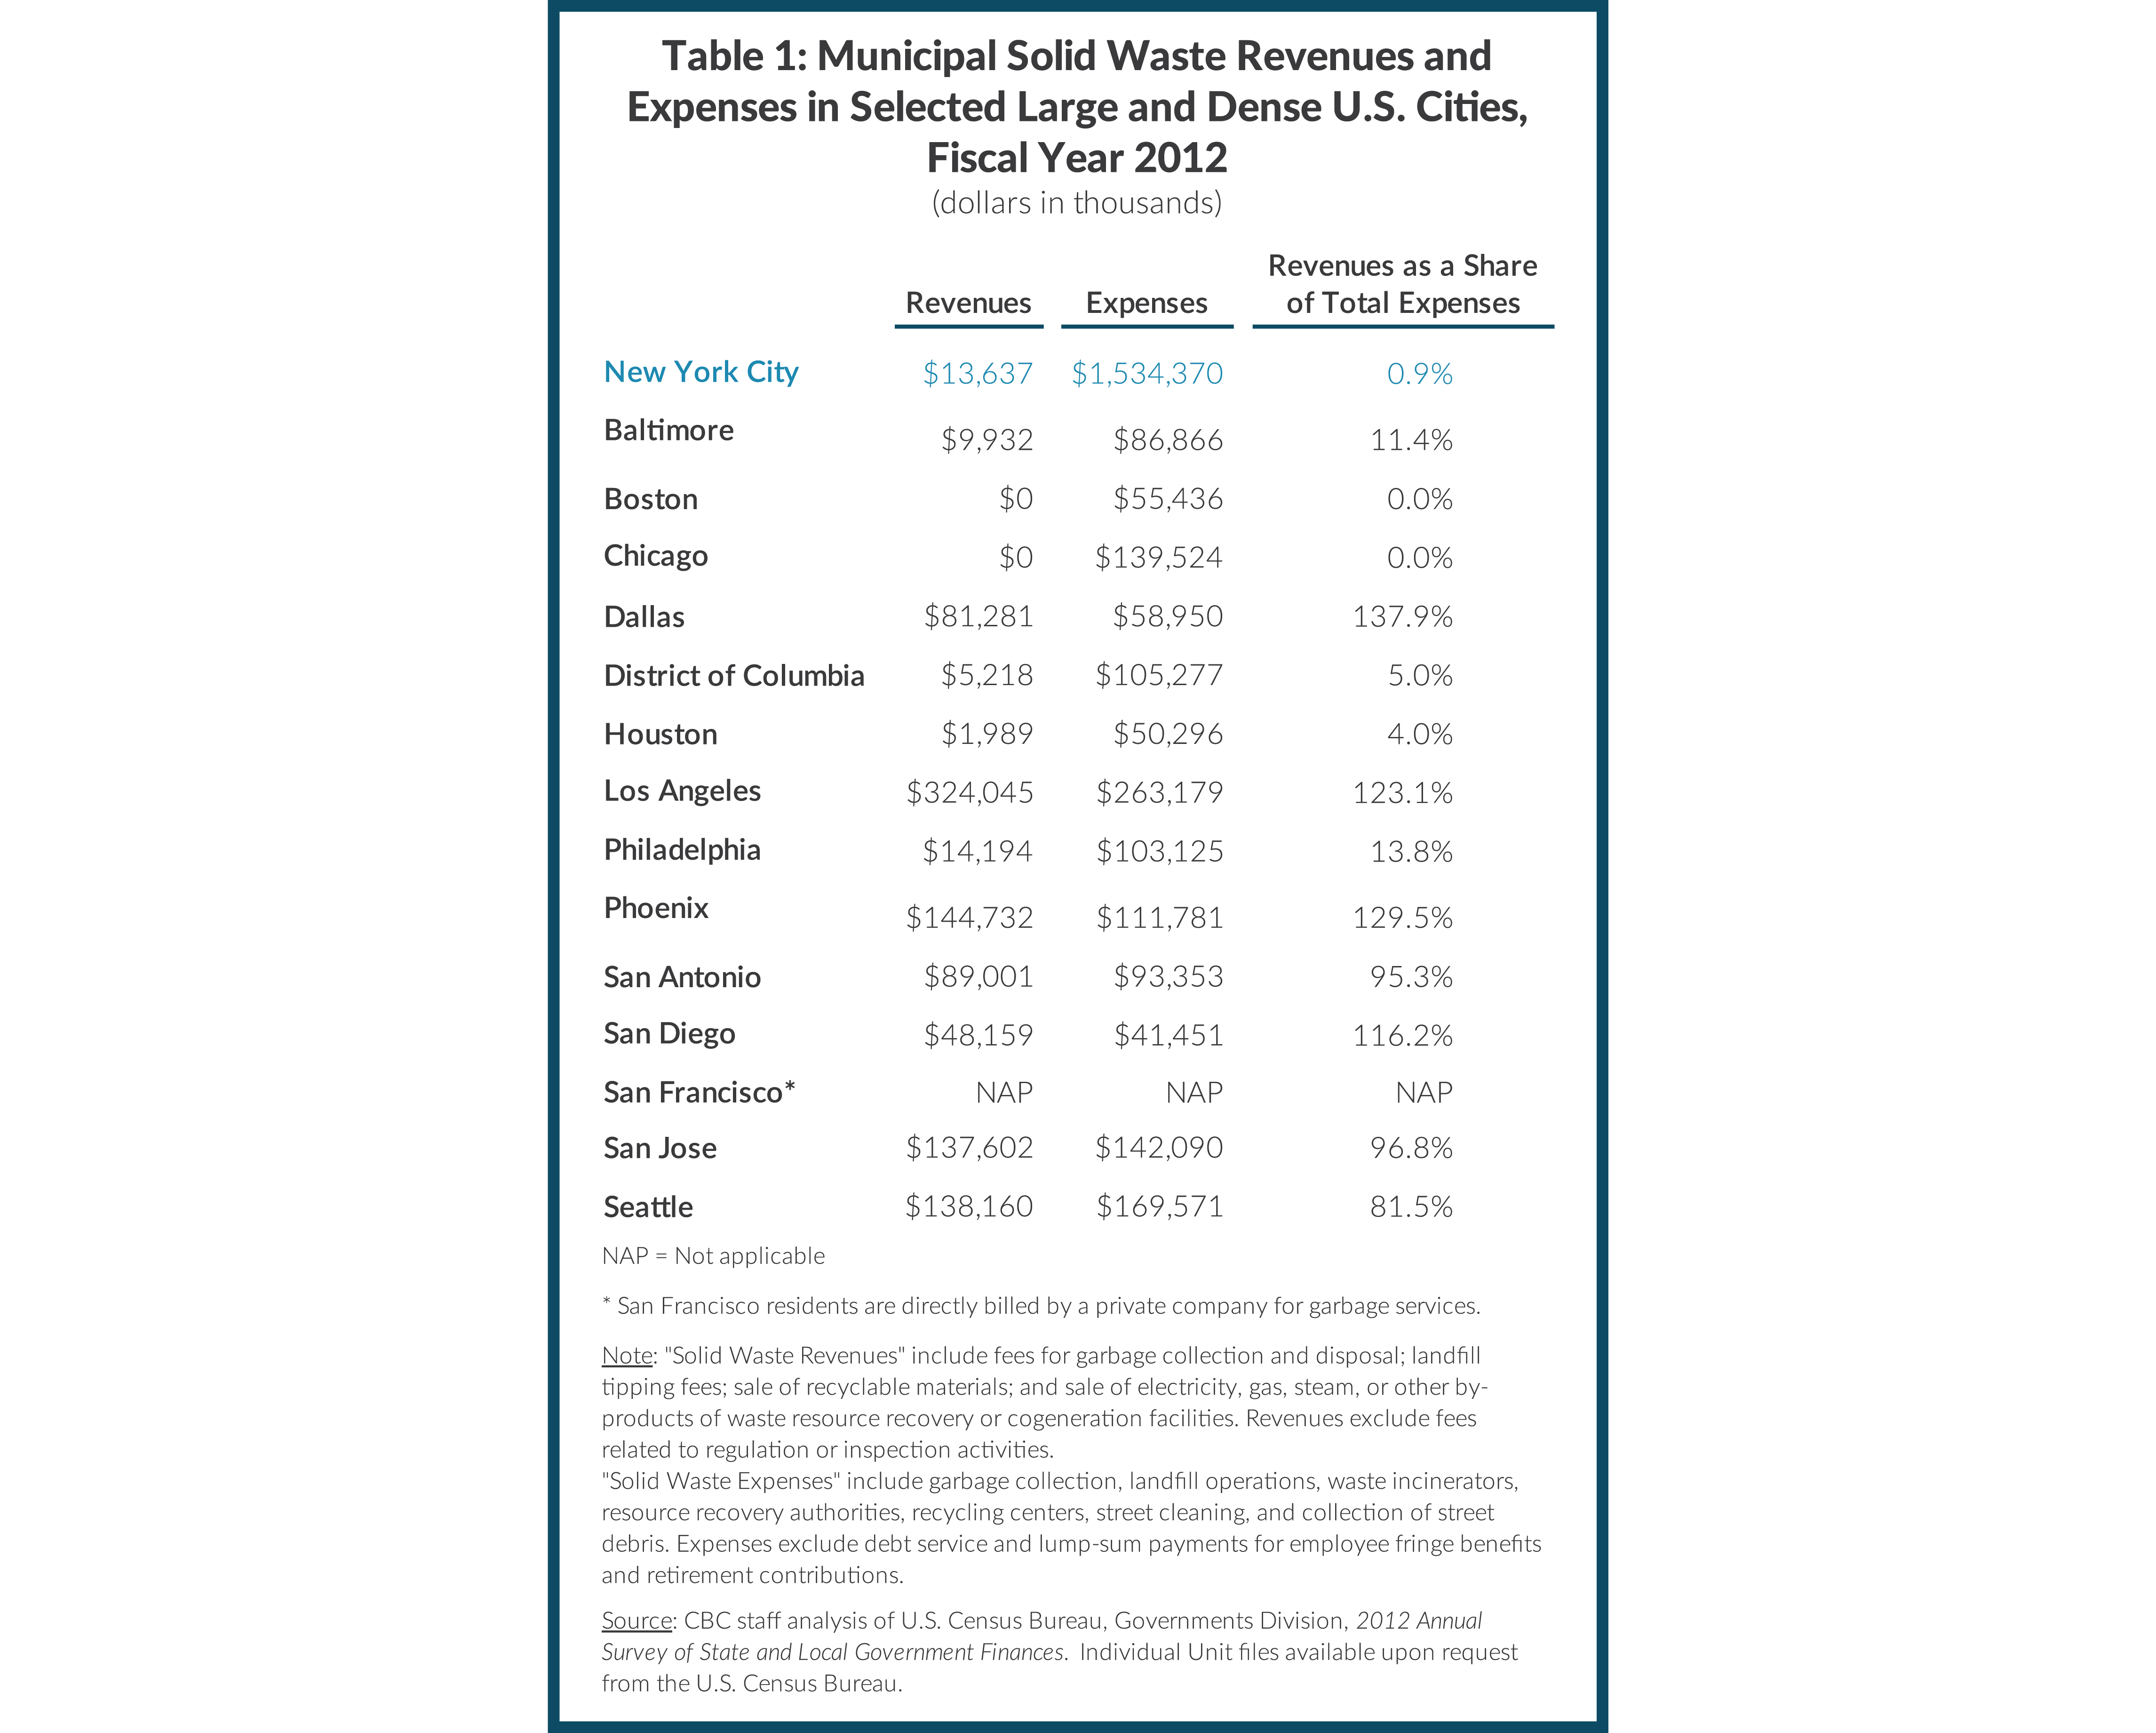
With the exception of San Diego, cities with revenues exceeding expenses levy monthly garbage fees. Seattle also charges monthly fees and funds 81.5 percent of total expenses, while in San Francisco a private company provides and bills for residential garbage collection. In San Diego the revenue share is high because the city imposes a “Refuse Collector Business Tax” of $8 per ton and a “Recycling Fee” of $10 per ton on all refuse disposed at the city landfill. In New York City the sale of recyclable paper and cardboard generated $9.1 million in fiscal year 2012; sales of landfill gas and abandoned vehicles and other garbage-related revenues added up to $4.5 million.[27] According to the U.S. Census data, those revenues were only 0.9 percent of related expenses.[28]
“Free” and Unlimited Refuse Collection is Rare in the U.S.
While some other large U.S. cities collect low levels of revenues relative to their solid waste expenses, “free” and unlimited municipal garbage collection is rare. Among the seven large American cities without monthly garbage fees, five impose set-out limitations or fees for “excess” refuse. For example, Baltimore residents can set out up to 96 gallons of refuse per week but must contract with a private company for larger quantities.[29] Similarly in Philadelphia, single-family homes are limited to four 32-gallon refuse bins or eight 32-gallon trash bags. In Washington, D.C. and San Diego residents can purchase extra bins for a one-time fee, while in Houston extra refuse bins cost $16.21 per month. The Mayor and City Council of Houston are discussing a monthly garbage fee for the fiscal year beginning in 2015.[30] In contrast, New Yorkers face no statutory or monetary constraints in the volume of garbage set out.
Garbage-related Fees Common in Large Cities Outside the U.S.
Outside of the U.S., many large cities – more similar in size and density to New York – also levy revenues related to residential garbage collection.
Seoul, South Korea, a city of 10 million people, requires residents to buy government-sanctioned garbage bags. In one South Korean district, bag prices range from 100 won ($0.09) for a 5-liter bag (1.3-gallon) to 880 won ($0.80) for a 50-liter bag (13-gallon).[31] Similarly, the 3.5 million residents of Berlin, Germany pay variable fees based on their selected refuse bin size and the frequency of collection.[32] For example, weekly collection of a 60-liter (16-gallon) refuse bin costs 267 euros ($327) annually.[33] Residents can also purchase bags called “Müllsackes” for 6 euros ($7) each.[34]
Other large global cities charge for special waste collections. For example, Tokyo charges residents for large garbage items such as furniture, household appliances, and electronic waste.[35] In the Japanese city of 13 million people, residents must purchase stickers from local stores to place on such items prior to disposal. Similarly in the United Kingdom, the City of London and Greater London’s 32 borough councils commonly levy charges for bulky items and hazardous household waste.[36] Of the six largest developed cities in the world, only Madrid, Spain and New York City do not levy any garbage user fees.[37]
Addressing the Challenges of Garbage Fees
While the benefits of variable garbage fees are clear, several key challenges must be addressed before implementation in New York City: 1) illegal dumping, 2) multiunit housing, 3) perception of a new tax, and 4) low-income households.
Illegal Dumping
The threat of illegal dumping is a serious concern in a densely packed city, but one that can be combated with extensive education, vigilant enforcement, and high penalties. While this problem may be acute in the early stages of implementation, it should abate within three months if the experience of other municipalities is a useful guide.[38] Moreover, in large U.S. cities with monthly garbage fees, delinquency rates are very low. For example, the reserve for uncollectible accounts in Seattle was less than 1 percent of service charges, while Dallas assumes only 2 percent of accounts will not be collected each year.[39]
Nonetheless, vigilant enforcement to prevent evasion practices will be required. New York City already has significant enforcement operations that could be expanded. DSNY workers enforce laws pertaining to recycling, street cleaning, and sidewalk litter, while the City’s Business Integrity Commission (BIC) combats illegal commercial dumping.[40] The City’s fines for illegal dumping are already high, ranging from $1,500 to $20,000; these could be amended to reflect a greater number of residential cases.[41] For example, Zurich residents – who must pay high rates for official municipal garbage bags – face a fine of 200 Swiss francs ($203) for illegal dumping.[42] Another successful tactic in other municipalities with variable fees is allowing large bulky waste to remain free to dispose.
Multiunit Housing
Centralized garbage collection in large apartment buildings poses another hurdle for variable garbage fees. Two strategies could be used to address this issue: 1) building-level variable fees or 2) government-sanctioned bags or stickers.
Building-level variable fees
Given the challenge of implementing variable garbage fees at the household level in large apartment buildings, as an interim step the City could enact volume-based charges at the building level. This fee structure would be easier to implement, although the benefits described above would be muted.
In many U.S. cities this payment structure is already the norm. In Chicago owners of buildings with five or more units must contract with a private carter and negotiate a price based on the volume and composition of the waste.[43] Other cities exercise greater control over private carter fees for multiunit housing. Large apartment building owners in Seattle pay a monthly flat fee of $33 plus a variable fee depending on the volume of refuse and the number of pick-ups.[44] Similarly in San Francisco, the charge for apartment building owners equals $25.64 for each 32-gallon bin of refuse, recycling, and organics multiplied by 10 percentage points less than the building diversion rate.[45] San Francisco also charges a base fee of $5 per unit.
For the 1 million rent-stabilized units in New York City, buildingwide garbage fees could be passed onto tenants through approved annual rent increases. Prior to determining allowable increases, the City’s Rent Guidelines Board already must consider government fees and real estate taxes, among other building costs.[46]
Government-sanctioned bags or stickers
While garbage user fees in the U.S. predominantly apply to small residential homes with bins, some cities sell stickers or tags for extra garbage bags. This practice could be extended to New York City’s multiunit housing stock. Since October 2002 Houston has enabled residents who require occasional extra capacity to purchase a tag for $2.10 to attach to an excess garbage bag.[47] Similar programs exist in Los Angeles and San Jose.[48] Stickers are available for purchase at multiple locations, such as libraries and grocery stores.
A few large European and Asian cities have more extensive garbage bag programs. As mentioned above, residents of Seoul, South Korean must purchase official refuse bags that vary in price and size, and Berlin, Germany offers extra capacity bags called “Müllsackes” for 6 euros ($7) each. In Zurich, Switzerland residents must buy “Zuri-Sacks” for non-recyclable refuse at local retailers. The bags range from 0.85 Swiss francs ($0.86) for a 17-liter bag (4.5-gallon) to 5.7 Swiss francs ($5.80) for a 110-liter bag (29-gallon).[49] Zurich also offers 35-liter and 60-liter bag options. A design or name competition for a new garbage bag program in New York City might spur public interest and buy-in.
Perception of a New Tax
The purpose of a new garbage fee is not to generate new revenue. Therefore, an offsetting rebate or tax cut would be needed. Another approach is to allocate a certain number of official garbage bags or stickers to affix to bags and create an exchange for the buying and selling of bags. Residents who need less than their allocation could sell the bags, while residents who need more would pay extra.
The City of Toronto, Canada offers one example of how to structure variable garbage fees. In 2008 Toronto switched from financing solid waste with property taxes to household fees. In the first year, residents could purchase a small refuse bin for CAD$199, a medium bin for CAD$248, a large bin for CAD$342, or an extra-large bin for CAD$399.[50] At the time of purchase, residents received a rebate for CAD$209, meaning that purchasers of the smallest size pocketed CAD$10. Households could also purchase garbage bag stickers for CAD$3 for extra trash; in the first year of the program, single-family home owners received four free stickers.
Toronto’s rates have changed over time but the principle is the same – low-trash producers effectively pay little for garbage removal. In 2014 the annual solid waste fee (net of rebate) ranged from CAD$7 to CAD$217 for a single-family home resident.[51] A similar rebate system is in place for apartment buildings, although building owners are responsible for the payment. Managers of multiunit buildings pay CAD$197 annually per unit for 1.9 cubic yards of uncompacted refuse disposal, a weekly average of 7 gallons, and receive a rebate of CAD$185.[52] Each additional cubic yard of refuse, or an average of 4 gallons per week, costs CAD$13.67.
Impact on Low-income Households
Another common criticism of garbage fees is the impact on low-income households. If the City distributes rebates or implements a progressive tax cut to offset the fees, or gives out a baseline number of bags or stickers, this issue is moot. In fact, because the City’s current method of funding solid waste operations is not tied to the volume of waste generated, a variable garbage fee might reduce the burden on low-income residents if they reduce their waste volume substantially. Additionally, the City’s property tax, which makes up about 40 percent of city tax revenues, falls disproportionately on rental and commercial buildings. High taxes on apartment buildings puts pressure on monthly rents for non-rent regulated apartments, raising living expenses for those in unregulated rental units.
However, in the absence of an offset, a new garbage fee program could be accompanied by discounts to assist low-income households. Such programs are common in many cities with recurring garbage fees. In Los Angeles low-income seniors and the disabled may receive a 30 percent discount through the Lifeline Rate Program, whereas Seattle offers a 50 percent discount for residents with income equal to or below 70 percent of the state median.[53] Similar low-income assistance programs exist in San Jose and San Francisco.[54]
Targeted educational campaigns will also be critical to ensuring households across all income levels know how to minimize their waste and their bill.
Options for a New Volume-based Garbage Fee
While variable garbage fees in other cities follow the same basic structure – costs rise as the volume of refuse set out increases – many options exist for designing a new fee program. The main question for public officials is how much of solid waste operations should be financed by fee revenues. One option is setting the fee to equal the price of export and disposal, and another option is structuring the fee to cover 100 percent of residential solid waste expenses. City officials will also need to consider the best governance structure for maximizing the fee’s benefits. Options to consider include the creation of a new public authority for sanitation. Lastly, implementation should be carefully considered. An appealing strategy is a voluntary pilot program for new residential development and for participants in the organics separation program.
Size of the Fee
Refuse export and disposal only
One option for a new variable garbage fee is to set the fee equal to the cost of refuse export and disposal. As long as the fee is sufficiently tied to volume, the City would be able to achieve the benefits of waste reduction and equity.
On average each New York City household generates about 1,700 pounds of refuse annually, the equivalent of roughly 30 gallons per week.[55] Based on projected waste export costs of $94 per ton ($0.05 per pound) in fiscal year 2014, the cost of waste export and disposal for an average household is $80 per year and $7 per month.[56] Hypothetically, the City could charge $1.50 for each 30-gallon bag and $0.75 for each 15-gallon bag. At this level, the fees would not pose an undue burden on New Yorkers. Even a household that generates 90 gallons of refuse per week would pay only $18 per month. Importantly, since the purpose of the new fees is not to generate revenues, with the provision of household rebates or a standard allocation of bags or stickers to each household, the effective fees would be much lower, even for high generators of waste.
All Department of Sanitation operations
Limiting the size of the fee would ease implementation in the short term, but financing all DSNY operations with fee revenues would offer improved fiscal transparency.
This option is similar to the financing method for the water and sewer system. The City’s Water Board annually sets water rates to cover operations, which are undertaken by the Department of Environmental Protection, and debt service. In fiscal year 2013, DSNY reported total garbage collection and disposal costs of $1.5 billion.[57] Based on the tonnage collected, about 85 percent of this expense, or $1.3 billion, was related to residential trash.[58] If this cost were allocated to residents, the average household would pay about $420 annually, or $35 per month.[59] However, unlike the provision of water, the City does not have a monopoly in garbage collection and disposal services. More than 250 private waste carters collect commercial trash, and these carters operate at less than half the unit cost of DSNY. Based on average rates for commercial waste and average New York City waste generation, a typical city household could pay a private hauler $16 per month to remove their refuse and recycling.[60]
To prevent residential building owners from refusing to pay the City’s fees and signing up for private service, the City would need to significantly reduce its collection costs.[61] A managed competition between the public and private sectors for contracts in different neighborhoods would facilitate this process. Given a minimum level of service and performance guarantees, DSNY and private carters could compete for awards on the basis of price.
In developing fee levels under this option, the City might consider the large variation in average collection costs across neighborhoods. Due to differences in housing density, DSNY’s average monthly curbside refuse and recycling collection costs range from about $17 per household in Manhattan to $30 in Brooklyn to $50 in Staten Island.[62] Charging different rates for different neighborhoods or housing structures poses an administrative and political challenge. One appealing option would be charging two rates based on the property’s tax classification. The City’s Department of Finance categorizes one- to three-unit homes as Class 1 and all other residential property as Class 2.
Governance
To maximize the benefits of a variable garbage fee, public officials should consider alternative governance structures. The goal should be a strong connection between the fee level and service cost. Maintaining a tight link will clearly signal changes in the price of the underlying service and ensure a stable source of funding for new solid waste infrastructure.
One approach is for the City to retain the revenues within its budget, but account for them separately. Many cities, including Washington, D.C., Houston, Los Angeles, San Diego, and San Jose, dedicate their garbage-related revenues to special revenue funds. This accounting structure restricts garbage fee revenues to financing related solid waste expenses and is more transparent than allowing revenues to accrue to the general fund. However, officials can easily raid special revenue funds for other purposes, and limited pressure exists to adjust fees for changes in the cost of service. For example, Dallas and Los Angeles levy monthly fees and use special revenue funds, yet changes to the fees occur regularly in Dallas but infrequently in Los Angeles.
In three cities – Phoenix, San Antonio, and Seattle – all garbage-related revenues and expenditures are accounted for apart from the city’s budget in an enterprise fund. This accounting mechanism can be used for business-like services funded by user fees, such as public utilities, health care, and transportation. The creation of a separate fund further protects fee revenues from being used for non-related purposes and enhances the visibility of changes in the cost of services.
Another approach is to create a distinct legal entity, such as a public authority, to set fees, collect revenues, and/or manage operations. The creation of a new Sanitation Authority would offer the same benefits as an enterprise fund while removing solid waste revenues and expenses from the city budget. While an additional layer of government might add administrative costs, the creation of a separate legal and financial entity may be appealing to municipal bond investors.
Public authorities for solid waste exist throughout the U.S., but most were created to finance disposal infrastructure or coordinate planning.[63] One example of a more comprehensive solid waste authority is in Berlin, Germany. In 1951 Berlin created a city-owned public utility to manage the collection and disposal of garbage.[64] The utility, called Berliner Stadtreinigungsbetriebe (BSR), sets garbage fees annually to fully fund operations without subsidy or profit. In part through subsidiaries and public-private partnerships, BSR also operates and receives revenues from four waste-to-energy plants and a paper recycling plant.
A New York City Sanitation Authority could follow the model of the New York City Municipal Water Finance Authority (MWFA).[65] Since 1984 the MWFA has been authorized to issue user-fee-backed bonds for the construction and improvement of the water system. The MWFA also makes rental payments to the City for use of city assets.[66] The City’s Department of Environmental Protection operates the system (albeit with far fewer employees than DSNY), while the New York City Water Board sets water rates and collects revenue.[67] The latest credit rating reports note independent rate-setting ability and history of raising rates as a strength of the Water Authority.[68]
Implementation
Given the challenges of switching to volume-based garbage fees from reliance on general tax revenues, city officials should craft a plan for phased implementation before any wider expansion. A good way to start is with a voluntary pilot program. The fees could initially be pegged to the cost of disposal, which is much smaller than the cost of collection and would provide immediate savings to the City in the form of lower waste export fees.
Who
A voluntary pilot program for a new garbage fee should follow the model of the City’s organics pilot by beginning in neighborhoods most likely to be receptive (that is, those with high diversion rates and lower density) and by offering the option to participate to any building owner citywide.[69] As of May 2014, roughly 100,000 households in small residential homes have access to organics collections, as well as residents in 43 high-rise residential buildings in Manhattan and Brooklyn and more than 400 schools.[70] Demonstration areas include parts of Staten Island, Brooklyn, the Bronx, and Queens.[71]
Good candidates for participation in a garbage fee pilot would include new residential developments and participants in the organics program. Developers of new, large residential properties negotiate with the City over numerous matters, including zoning, tax incentives, and affordable housing. Participation in a garbage fee pilot could be added to these negotiations. Owners of buildings with a focus on environmental standards, such as those with in-sink trash disposals for food waste and strong recycling programs, may view participation as a means to reduce their overall tax burden.
How
Because the goal of the program is to change behavior, that is to say, reduce waste, participants should have a financial incentive to reduce the volume of refuse set out. Additionally, to ensure the fee is not viewed as punitive, but rather as a shared savings program, residents should have the ability to save money. This could be achieved in multiple ways.
One option is to require participating buildings and households to purchase official garbage bags or stickers to affix to non-official bags for refuse disposal. To offset these payments, and provide a financial incentive, participants could receive a property tax rebate equal to the cost of purchasing an “average” amount of bags or stickers. The “average” could be calculated for the surrounding neighborhood. As with the city’s organic waste pilot program, the neighborhood could be defined as the sanitation district section; for operational purposes the city is divided into 59 sanitation districts and 233 sections.[72] If the participant sets out an average amount of refuse, the net financial impact would be $0, but the participant could save money by setting out less than the average.
Alternatively, the City could allocate a minimal number of bags or stickers per household, thereby reducing the out-of-pocket fees and the offsetting rebate. The allocation should be less than the average rate of refuse generation in the surrounding neighborhood, adjusted for the number of units in the building. If the number of allocated bags or stickers is calculated as a certain percentage of the neighborhood average, participants could receive a property tax rebate equal to the cost of purchasing extra bags or stickers up to the neighborhood average.[73]
Using property tax rebates presents one key hurdle – the need for approval by the New York State Legislature. Thus, another option may be more feasible. Instead of using rebates, the City Council could set up an exchange for the buying and selling of bags or stickers. This could be operated centrally through the City’s website or through local public institutions, such as libraries, fire houses, or sanitation garages. Under this option, participants would receive a predetermined number of bags or stickers based on the neighborhood average (or slightly below the average to encourage greater waste reduction). With the ability to sell unused bags or stickers through the exchange, residents would be able to pocket extra money if their refuse generation is below their local average.
To encourage participation from large apartment buildings, owners could decide to assign responsibility to the tenants or the building staff. Assuming landlords prefer building staff to maintain control, stickers would likely be more desirable than bags. Recyclable material (and organic material, if participating in the organics pilot) could remain free to set out.
Identifying Problems and Documenting Success
As with the City’s organics pilot, DSNY should evaluate and provide periodic reports on the garbage fee pilot. In spring 2014, DSNY performed a one-week audit of schools participating in the organics program and collected data on the amount of refuse, recycling, and organics set out. The audit assessed the diversion rate, capture rate, potential diversion rate, and contamination rate for each waste stream. Similar waste audits for the garbage fee pilot would also provide useful information.
The key metrics to be evaluated for the garbage fee pilot include changes in the level of refuse, diversion rate, incidence of illegal dumping, and resident satisfaction. Evaluations should also compare outcomes by neighborhood and by the number of building units. If the pilots are successful, then the policy could be mandated citywide.
Conclusion
New York City’s solid waste management practices are in need of reform. The public cost of collecting trash is double that of the private sector, and public disposal of non-recyclable waste in faraway landfills generates great fiscal and environmental costs. However, most city residents are unaware of these great and growing expenses because garbage operations are funded by general city revenues and buried in a much larger city budget.
To increase the public’s awareness of the cost of their garbage, and to bolster support for a redesign of waste policies, New York City should implement a volume-based garbage user fee that is revenue neutral. Even a small fee, set to cover the costs of disposal, would offer the benefits of service cost visibility, waste reduction, independent access to capital, and fairness. Importantly, New Yorkers would have a greater financial stake in limiting garbage production, properly sorting recyclables and potentially organics, and understanding the costs of removing their trash. In the longer term, a user fee that covers all costs associated with residential garbage would offer the greatest benefits. A larger fee that accrued to an enterprise fund or a new public authority might also enable the creation of a new financing tool for developing facilities to process non-recyclable waste locally, such as anaerobic digestion plants for converting organic waste into energy. If city officials implement voluntary pilot programs, the policy could be evaluated and proven successful prior to citywide expansion.
New York City can do better with its garbage policies, and that begins with how residents pay for disposal.
Download Report
A Better Way to Pay for Solid Waste ManagementFootnotes
- CBC staff analysis of New York City Department of Sanitation, Bureau of Planning and Budget, Cost per Ton Analysis, Fiscal Year 2013; and Citizens Budget Commission, 12 Things New Yorkers Should Know About Their Garbage (May 2014), p. 1, www.cbcny.org/sites/default/files/REPORT_GarbageFacts_05222014.pdf.
- Citizens Budget Commission, 12 Things New Yorkers Should Know About Their Garbage (May 2014), p. 1, www.cbcny.org/sites/default/files/REPORT_GarbageFacts_05222014.pdf; and Citizens Budget Commission, Taxes In: Garbage Out: The Need for Better Solid Waste Disposal Policies in New York City (May 2012), www.cbcny.org/sites/default/files/REPORT_SolidWaste_053312012.pdf.
- CBC staff analysis of New York City Mayor’s Office of Long-Term Planning and Sustainability, New York City’s Pathways to Deep Carbon Reductions (December 2013), pp. 99-114, http://s-media.nyc.gov/agencies/planyc2030/pdf/nyc_pathways.pdf; and United States Environmental Protection Agency, Greenhouse Gas Equivalencies Calculator (accessed October 2, 2014), www.epa.gov/cleanenergy/energy-resources/calculator.html.
- Seattle Solid Waste System Revenue Bonds Official Statement (June 4, 2014), pp. 12-20, http://www.seattle.gov/Documents/Departments/SeattleGovPortals/Business/Investors/Seattle-Solid-Waste-OS-2014.pdf; and Seattle Public Utilities, Solid Waste Fund: 2013-2016 Rate Study (December 2012), www.seattle.gov/util/groups/public/@spu/@billing/documents/webcontent/spu01_004264.pdf.
- In San Jose private haulers collect all residential waste, but the City sets the fees. These charges vary by volume of refuse set out and accrue to the Integrated Waste Management Fund, a special revenue fund. Expenditures for San Jose’s contracts with the private haulers are financed through this fund; the City Council sets the fees each year with the goal of 100 percent cost recovery. City of San Jose City Manager's Budget Office, 2014-2015 Fiscal Year Adopted Operating Budget, Integrated Waste Management Fund (October 15, 2014), p. X-10, www.sanjoseca.gov/DocumentCenter/View/36414.
- City of San Antonio Solid Waste Management Department, FY 2014 Proposed Budget Presentation (August 27, 2013), p. 29, www.sanantonio.gov/Portals/0/Files/budget/FY2014/Work%20Sessions/2014%20Proposed%20Budget%20-%20SWMD%20final.pdf.
- San Antonio’s Environmental Services Fee was increased from $2.24 to $3.24 per month in the adopted fiscal year 2015 budget.
- City of Dallas, Proposed Annual Budget for Fiscal Year 2014-15 (August 12, 2014), pp. 142 and 476, www.dallascityhall.com/Budget/proposed_1415/FY15-ProposedBudgetBook.pdf.
- New York City Water Board, New York City FY 2015 Water and Wastewater Rate Report (May 2014), www.nyc.gov/html/nycwaterboard/pdf/blue_book/bluebook_2015.pdf.
- CBC staff analysis of New York City Department of Sanitation, Bureau of Planning and Budget, Cost per Ton Analysis, Fiscal Year 2013.
- In 2006 and 2007, the City signed 20-year contracts for rail export from transfer stations in Staten Island, Brooklyn, and the Bronx. As of fiscal year 2012, these are the most expensive transfer stations used by the City, with prices per ton of $112, $140, and $99, respectively. The average price at the other transfer stations, not including waste-to-energy plants in New Jersey and Long Island, was $86 per ton. The high price results from substantial infrastructure spending, long distances to landfills (South Carolina and Virginia), and the risk inherent in a long-term contract. Over the life of the contracts, annual increases in per-ton fees are expected to be modest, with growth tied to various price indices. In 2015 the City plans to open the first of four marine transfer stations in Manhattan, Brooklyn, and Queens; the prices at these stations will be even higher. In August 2013 the City signed a 20-year contract with Covanta, a private waste-to-energy plant operator, to transport waste from the Manhattan and Queens marine transfer stations. Waste containerized at the marine transfer stations will be barged to a port facility in Staten Island, where containers will be transferred to railcars and then shipped to plants in Niagara, New York and Chester, Pennsylvania. The initial price at the Queens station is likely to be about $153 per ton – $66 would finance capital investments, $60 would fund waste transport, and $26 would cover the disposal fee, based on an example calculation of the service fee in the contract between the City and Covanta. Costs associated with financing capital investments will be fixed, while costs associated with transportation and disposal will vary depending on the weight of the garbage. This price excludes the cost of financing construction of the marine transfer station. The New York City Independent Budget Office estimated such facility costs to be $123 per ton for the East 91st Street station. New York City Office of Management and Budget, Fiscal Year 2012 DSNY Waste Export Costs; “Service Contract for Municipal Solid Waste Management Transportation and Disposal (North Shore Marine Transfer Station and East 91st Street Marine Transfer Station) between the City of New York, New York and Covanta 4Recovery, L.P.,” (July 3, 2013), www.energyjustice.net/files/incineration/covanta/NYC-Covanta-contract.pdf; and New York City Independent Budget Office, Letter to Council Member Kallos (October 21, 2014), www.ibo.nyc.ny.us/iboreports/2014e91stwtsLetter.pdf.
- New York City Office of Management and Budget, Adopted Fiscal Year 2015 Budget, Budget Function Analysis (June 27, 2014), www.nyc.gov/html/omb/downloads/pdf/adopt14_bfa.pdf.
- As part of a voluntary pilot program, the City is collecting food and yard waste from 100,000 households living in one- to nine-unit buildings, 43 high-rise apartment buildings, and more than 400 public schools. An evaluation of the pilot will determine if the program is continued and expanded beyond 2015. New York City Local Law, Int. 1107-2013, http://legistar.council.nyc.gov/LegislationDetail.aspx?ID=1450676&GUID=7743FA15-9A38-4854-8877-31C725522D90&Options=ID|Text|&Search=food+waste; and New York City Local Law, Int. 1162-2013, http://legistar.council.nyc.gov/LegislationDetail.aspx?ID=1482542&GUID=DDD94082-C0E5-4BF9-976B-BBE0CD858F8F&Options=ID|Text|&Search=food+waste.
- New York City Mayor’s Office of Long-Term Planning and Sustainability, New York City’s Pathways to Deep Carbon Reductions (December 2013), pp. 99-114, http://s-media.nyc.gov/agencies/planyc2030/pdf/nyc_pathways.pdf.
- Lisa A. Skumatz and David J. Freeman, Pay as You Throw (PAYT) in the US: 2006 Update and Analyses (submitted by Skumatz Economic Research Associates to the United States Environmental Protection Agency, Office of Solid Waste, December 30, 2006), p. 7, www.epa.gov/osw/conserve/tools/payt/pdf/sera06.pdf.
- Other smaller cities not included in CBC’s review, such as Austin, Texas and Portland, Oregon, also levy variable fees. For a list of cities with variable garbage fees, see: Mecklenburg County Land Use & Environmental Services Agency, Solid Waste Division, Best Practices for Local Government Solid Waste Recycling, Diversion from Landfill and Waste Reduction (December 2011), p. 3, http://charmeck.org/mecklenburg/county/luesa/solidwaste/managementplan/documents/bestpracticesrecyclingstudy.pdf. San Antonio also plans to implement a variable pricing plan in fiscal year 2016, with the goal of increasing the residential recycling rate to 60 percent. The new garbage service will include an organics cart and three sizes for refuse bins. City of San Antonio, FY 2015 Proposed Annual Operating and Capital Budget (August 7, 2014), pp. 29-30, www.sanantonio.gov/Portals/0/Files/budget/FY2015/FINAL%20Entire%20Document%20WEB9%2020%20.pdf; and City of San Antonio, Solid Waste Management Department, FY 2015 Proposed Budget Presentation (August 2014), http://therivardreport.com/wp-content/uploads/2014/08/swmd-budget-presentation-final-print.compressed-2.pdf. Also see, Maria Kelleher, Janet Robins, and John Dixie, “Taking Out the Trash: How to Allocate the Costs Fairly” (July 2005), C.D. Howe Institute Commentary, No. 213, www.cdhowe.org/pdf/commentary_213.pdf.
- Seattle residents may also set out an extra bundle of garbage next to their bins for a one-time fee of $10.20. The garbage can be placed in a bag or container and cannot exceed 32 gallons or 60 pounds.
- A 32-gallon organics bin costs $2.04 per month in San Francisco and $7.75 per month in Seattle. Yard waste collection costs $4.69 per month in San Jose.
- New York City Department of Sanitation, Local Law 77 of 2013 Organic Collection Pilot Program, Program Report, through March 2014 (June 2014), p. 5, www.nyc.gov/html/dsny/downloads/pdf/pubinfo/pr_pdfs/DSNY_LL77_DiversionReport_June2014.pdf.
- Moody’s Investor Services, Rating Action: Moody’s assigns Aaa to Seattle (WA)’s G.O. bonds and Aa1 to limited tax G.O. bonds; Outlook is stable (March 21, 2014), www.seattle.gov/Documents/Departments/SeattleGovPortals/Business/Investors/GO-Moodys-2014.pdf; Standard & Poor’s Rating Services, Seattle, Washington; General Obligation; General Obligation Equivalent Security (March 25, 2014), www.seattle.gov/Documents/Departments/SeattleGovPortals/Business/Investors/GO-SandP-2014.pdf; Moody’s Investor Services, New Issue: Moody’s assigns Aa3 to Seattle (City of) WA Solid Waste Enterprise’s new revenue bonds. Outlook is stable. (May 15, 2014), www.seattle.gov/Documents/Departments/SeattleGovPortals/Business/Investors/Solid-Waste-Moodys-2014.pdf.
- Seattle Solid Waste System, Revenue Bonds Official Statement (June 4, 2014), p. 21, www.seattle.gov/Documents/Departments/SeattleGovPortals/Business/Investors/Seattle-Solid-Waste-OS-2014.pdf.
- City of San Antonio Department of Finance, Comprehensive Annual Financial Report and Other Reports for Fiscal Year Ended September 30, 2013 (February 19, 2014), pp. 101-103, www.sanantonio.gov/Portals/0/Files/Finance/Website%20CAFR%202013.pdf.
- City of Phoenix Finance Department, Comprehensive Annual Financial Report for the Fiscal Year Ended June 30, 2013 (December 2013), pp. 70-71 and 156-160, www.phoenix.gov/financesite/Documents/cafr2013r2.pdf; and City of Phoenix Civic Improvement Corporation, Official Statement (April 30, 2003), http://emma.msrb.org/MS206259-MS181567-MD352019.pdf.
- Includes household curbside waste, residential bulk waste, special housing authority, and Passover collections and 10 percent of containerized “EZ-Pack” and “Roll-on/Roll-off” trucks collections. CBC staff analysis of fiscal year 2012 collection data provided by the New York City Department of Sanitation; and U.S. Department of Commerce, U.S. Census Bureau, 2012 American Community Survey, Selected Housing Characteristics – 1-year estimates (accessed November 6, 2014), http://factfinder2.census.gov/faces/tableservices/jsf/pages/productview.xhtml?pid=ACS_12_1YR_DP04&prodType=table.
- New York City Department of Sanitation, Local Law 77 of 2013 Organic Collection Pilot Program, Program Report, through March 2014 (June 2014), p. 5, www.nyc.gov/html/dsny/downloads/pdf/pubinfo/pr_pdfs/DSNY_LL77_DiversionReport_June2014.pdf.
- CBC staff analysis of New York City Department of Sanitation, Bureau of Planning and Budget, Cost per Ton Analysis, Fiscal Year 2013; and Citizens Budget Commission, 12 Things New Yorkers Should Know About Their Garbage (May 2014), p. 1, www.cbcny.org/sites/default/files/REPORT_GarbageFacts_05222014.pdf.
- New York City Office of Management and Budget, Adopted Fiscal Year 2013 Budget Revenue Plan Detail (June 28, 2012), pp. 36 and 46, www.nyc.gov/html/omb/downloads/pdf/adopt12_rfpd.pdf; and New York City Office of the Comptroller, Comprehensive Annual Financial Report for Fiscal Year Ended June 30, 2012 (October 29, 2012), pp. 212-213, http://comptroller.nyc.gov/wp-content/uploads/documents/CAFR2012.pdf.
- New York City paper revenues have fluctuated as the sales price rose from $12 per ton in fiscal year 2011 to $25 in fiscal year 2012 and then fell to $11 in fiscal years 2013 and 2014. New York City Office of the Mayor, Mayor’s Management Report, Fiscal Year 2014 (September 2014), p. 92, www.nyc.gov/html/ops/downloads/pdf/mmr2014/dsny.pdf.
- City of Baltimore Department of Public Works, 10 Year Solid Waste Management Plan for 2013-2023 (July 25, 2014), p. 24, http://publicworks.baltimorecity.gov/Portals/publicworks/documents/10_Year_Solid_Waste%20Management_Plan_2013-2023.pdf; and Sarah Fisher, “Sweeping Change for City Trash” The Baltimore Sun, July 12, 2009, http://articles.baltimoresun.com/2009-07-12/news/0907110065_1_trash-and-recycling-trash-pickup-days-garbage.
- Mike Morris, “Facing Budget Gap, City May Consider Garbage Fee” Houston Chronicle (July 25, 2014), www.houstonchronicle.com/news/politics/houston/article/Facing-budget-gap-city-may-consider-garbage-fee-5647666.php.
- Seoul Global Center, “Living: Garbage Disposal” (accessed September 12, 2014), global.seoul.go.kr. Currency conversion based on currency rates as of December 22, 2014.
- Berliner Stadtreinigungsbetriebe (BSR), “The BSR Rates 2013/2014” (in German), www.bsr.de/assets/downloads/Tarife_2013_2014_Uebersicht_web.pdf; and Berlin Senate Department for Urban Development and the Environment, “Municipal Waste Management in Berlin” (December 2013), www.stadtentwicklung.berlin.de/umwelt/abfallwirtschaft/downloads/siedlungsabfall/Abfall_Broschuere_engl.pdf.
- Currency conversion based on currency rates as of December 22, 2014.
- Berliner Stadtreinigungsbetriebe (BSR), “Hausmüll: BSR-Müllsäcke” (in German, accessed September 12, 2014), www.bsr.de/9867.html.
- Waste disposal in Tokyo is organized by ward but governed by city law. For an example of one ward’s guidance, see Bunkyo-ku Garbage Collection Office, “How to Sort and Put Out Garbage” (April 2014), http://www.city.bunkyo.lg.jp/var/rev0/0078/7344/A4_English.pdf.
- The Borough Council of Islington charges a minimum of 34 pounds for household clinical waste collection, and the Royal Borough of Kensington and Chelsea charges 27.60 pounds for up to 10 bulky items. The City of London Corporation charges for more than 15 square meters of household asbestos and charges 27 pounds for up to three bulky items or 10 standard bags. Islington Borough Council, “Disposing of Clinical Waste” (accessed October 31, 2014), www.islington.gov.uk/services/rubbish-recycling/rubbish/Pages/clinical-waste.aspx; Royal Borough of Kensington and Chelsea, “Bins and Recycling – Special Collections” (accessed October 31, 2014), www.rbkc.gov.uk/binsandrecycling/rubbishandrecycling/specialcollections.aspx; City of London Corporation, “Hazardous Waste Collection” (accessed October 31, 2014), www.cityoflondon.gov.uk/services/environment-and-planning/waste-and-recycling/household-waste-and-recycling/Pages/Hazardous-Waste.aspx; and City of London Corporation, “Bulky Waste” (accessed October 31, 2014), www.cityoflondon.gov.uk/services/environment-and-planning/waste-and-recycling/household-waste-and-recycling/Pages/bulky-waste.aspx. For examples of Council Tax Levies in London see, City of London Corporation, Council Tax and Non-domestic Rate Booklet 2014-2015, www.cityoflondon.gov.uk/services/housing-and-council-tax/council-tax/Documents/rates-council-tax-booklet-2014-15.pdf; Islington Borough Council, Your Council Tax Explained, 2014-15, p. 13, www.islington.gov.uk/publicrecords/library/Finance/Information/Advice-and-information/2013-2014/(2014-03-06)-Council-tax-booklet-2014-15.pdf; and The Royal Borough of Kensington and Chelsea, Your Council Tax and Business Rates, 2014-15 (March 2014), p. 32, www.rbkc.gov.uk/binsandrecycling/rubbishandrecycling/specialcollections.aspx. For more on the waste management structure in London, see London Councils, Waste Management in London – Key Challenges (November 26, 2013), www.londoncouncils.gov.uk/committees/agenda.htm?pk_agenda_items=5484. For more on City of London waste strategies see, Mayor of London, London’s Wasted Resource: The Mayor’s Municipal Waste Management Strategy (November 2011), www.london.gov.uk/sites/default/files/Municipal%20Waste_FINAL.pdf.
- See City of Madrid, Guía para resolver dudas sobre la separación de residuos domésticos en Madrid (in Spanish, accessed November 6, 2014), www.madrid.es/UnidadesDescentralizadas/Agenda21/ContenidosBasicos/Ficheros/Gu%C3%ADaResolverDudasSeparacResiduosDom%C3%A9stAdultos.pdf.
- Lisa A. Skumatz and David J. Freeman, Pay as You Throw (PAYT) in the US: 2006 Update and Analyses (submitted by Skumatz Economic Research Associates to the United States Environmental Protection Agency, Office of Solid Waste, December 30, 2006), p. 14, www.epa.gov/osw/conserve/tools/payt/pdf/sera06.pdf.
- At the end of 2013, Seattle’s reserve for doubtful accounts held less than $1 million, while receipts from residential and commercial customers were $152 million. Seattle Public Utilities - Solid Waste Fund, Report of Independent Auditors and Financial Statements with Supplemental Information, December 31, 2013 and 2012 (April 28, 2014), p. 19, www.seattle.gov/Documents/Departments/SeattleGovPortals/Business/Investors/Seattle-Solid-Waste-2013.pdf; and City of Seattle Budget Office, 2015-2016 Proposed Budget: Seattle Public Utilities, p. 377, www.seattle.gov/financedepartment/15proposedbudget/documents/SPU.pdf. For fiscal year 2014-15, Dallas assumed 2.1 percent of accounts would be delinquent. In fiscal year 2013-14 the assumption was 1.56 percent. City of Dallas, Proposed Annual Budget for Fiscal Year 2014-15 (August 12, 2014), p. 476, www.dallascityhall.com/Budget/proposed_1415/FY15-ProposedBudgetBook.pdf; and City of Dallas, Adopted Annual Budget for Fiscal Year 2013-14 (September 18, 2013), p. 536, www.dallascityhall.com/Budget/adopted_1314/adopted_fy13-14_adopted_budget_book.pdf.
- In fiscal year 2013, DSNY’s Enforcement Division employed 72 sanitation police officers and 239 sanitation enforcement agents. New York City Department of Sanitation, 2013 Annual Report, p. 17, www.nyc.gov/html/dsny/downloads/pdf/pubinfo/annual/ar2013.pdf. In December 2013, the BIC issued a 47-count violation for illegal dumping against a private waste carter. New York City Business Integrity Commission, “The Business Integrity Issues 47-Count Violation to Trade Waste Firm for Illegal Dumping Infractions” (press release, December 11, 2013), www.nyc.gov/html/bic/downloads/pdf/pr/BIC_PR_12_10_13.pdf.
- New York City Department of Sanitation, A Summary of Sanitation Rules and Regulations (revised October 2009, accessed November 3, 2014), p. 23, www.nyc.gov/html/dsny/downloads/pdf/rules/digest/DSNY_Rules_Reg.pdf; and New York City Administrative Code, Section 16-119 (accessed November 3, 2014), http://public.leginfo.state.ny.us/LAWSSEAF.cgi?QUERYTYPE=LAWS+&QUERYDATA=$$ADC16-119$$@TXADC016-119+&LIST=LAW+&BROWSER=BROWSER+&TOKEN=10253743+&TARGET=VIEW.
- Catherine Bosley and Carolyn Bandel, “Wrong Garbage Bag? Swiss Trash Police are on the Case” Bloomberg News (June 5, 2014), www.bloomberg.com/news/2014-06-04/swiss-garbage-police-irk-foreigners-reeling-after-vote.html. Currency conversion based on currency rates as of December 22, 2014.
- City of Chicago Department of Streets and Sanitation, “Residential Garbage Collection” (accessed November 5, 2014), www.cityofchicago.org/city/en/depts/streets/provdrs/streets_san/svcs/residential_garbagecollection.html.
- Seattle Public Utilities, Solid Waste Fund: 2013-2016 Rate Study (December 2012), p. 39, www.seattle.gov/util/groups/public/@spu/@billing/documents/webcontent/spu01_004264.pdf.
- For calculating building fees, the diversion rate cannot exceed 75 percent. Recology, Sunset Scavenger Golden Gate, “Apartment Rates” (accessed September 12, 2014), www.recologysf.com/index.php/for-homes/apartment-rates; and City and County of San Francisco Department of Public Works, “Residential and Apartment Refuse Rates, Effective July 1, 2014” (accessed September 12, 2014), www.sfdpw.org/modules/showdocument.aspx?documentid=4244.
- New York City Administrative Code, Section 26-510, subdivision b (accessed November 7, 2014), http://public.leginfo.state.ny.us/menugetf.cgi?COMMONQUERY=LAWS. Also see, New York City Rent Guidelines Board, 2014 Price Index of Operating Costs (April 24, 2014), www.nycrgb.org/downloads/research/pdf_reports/pioc14.pdf.
- City of Houston Solid Waste Department, "Extra Capacity Collection Program" (accessed October 7, 2014), www.houstontx.gov/solidwaste/extracapacity.html; and City of Houston Data Portal, Fee Schedule (accessed October 7, 2014), http://data.ohouston.org/dataset/city-of-houston-fee-schedule.
- City of Los Angeles Bureau of Sanitation, "Extra Capacity Tags" (accessed October 7, 2014), http://san.lacity.org/solid_resources/refuse/services/extra_pcapacity_tags.htm; and City of San Jose Environmental Services, "Garbage Rates" (Effective July 1, 2014, accessed October 16, 2014), http://sanjoseca.gov/index.aspx?NID=1551.
- City of Zurich, City Engineering and Waste Department, “Disposal and Recycling” (in German, accessed September 12, 2014), www.stadt-zuerich.ch/content/ted/de/index/entsorgung_recycling/sauberes_zuerich/entsorgen_wiederverwerten/hauskehricht/hauskehricht_preise.html#contenttabs. Currency conversion based on currency rates as of December 22, 2014.
- CTV Toronto, “T.O. Starts Collecting Trash Fees” (November 2, 2008), http://toronto.ctvnews.ca/t-o-starts-collecting-trash-fees-despite-delays-1.339187; and John Spears, “Toronto to Pay the Price for More Garbage” The Toronto Star (February 2, 2008), www.thestar.com/news/gta/2008/02/08/toronto_to_pay_the_price_for_more_garbage.html.
- Single-family home residents in Toronto also have the option of subscribing to a bag-only service for an annual fee of CAD$147.70. After the CAD$224 rebate, residents would be able to purchase 24 bag stickers (CAD$76.30 divided by CAD$3.19). Each additional sticker would cost CAD$3.19.
- City of Toronto, “2014 Solid Waste Rates and Fees” (accessed September 12, 2014), www1.toronto.ca/wps/portal/contentonly?vgnextoid=b16687fc1b273410VgnVCM10000071d60f89RCRD&vgnextchannel=03ec433112b02410VgnVCM10000071d60f89RCRD; and City of Toronto Municipal Code, Chapter 844, Article VII, Section 28-32 (accessed September 12, 2014), www.toronto.ca/legdocs/municode/1184_844.pdf.
- Los Angelos Lifeline Program applies to “any individual 62 years of age or older or any disabled individual…provided the combined adjusted gross income…of all members of the household in which the individual resided was less than the figure in effect on the preceding first day of April as the "very low income" limitation for a family of two persons in the City of Los Angeles under the Section 8 housing programs of the United States Housing Act of 1937, as amended, as published by the United States Department of Housing and Urban Development.” City of Los Angeles Municipal Code, Section 66.41 and Section 21.1.12 (accessed November 7, 2014), www.amlegal.com/nxt/gateway.dll/California/lamc/municipalcode?f=templates$fn=default.htm$3.0$vid=amlegal:losangeles_ca_mc; City of Los Angeles, “Lifeline Recertification Final Notice” (October 25, 2010), http://san.lacity.org/solid_resources/pdfs/Lifeline/Lifeline_Recertifcation_Final_Notice.pdf; and Seattle Public Utilities, “Get Help with Utility Bills – Utility Discount Program” (accessed October 20, 2014), www.seattle.gov/util/MyServices/MyAccount/GetHelpwithUtilityBill/index.htm.
- In San Francisco residents with income less than or equal to 150 percent of the poverty threshold receive a 25 percent discount. City of San Jose, “Garbage Rate Assistance” (accessed November 7, 2014), www.sanjoseca.gov/index.aspx?NID=3231; Recology, Sunset Scavenger Golden Gate, “Lifeline Rates” (accessed September 12, 2014), www.recologysf.com/index.php/for-homes/residential-rates#lifeline-rates; and City and County of San Francisco Department of Public Works, “Residential and Apartment Refuse Rates, Effective July 1, 2014” (accessed September 12, 2014), www.sfdpw.org/modules/showdocument.aspx?documentid=4244.
- [i] Of the 3 million tons of refuse collected by DSNY, about 2.6 million is from residential homes. The 2.6 million figure includes household curbside waste, residential bulk waste, special housing authority, and Passover collections and 10 percent of containerized “EZ-Pack” and “Roll-on/Roll-off” trucks collections. Weight to volume conversion assumes one cubic yard contains 225 pounds of waste. CBC staff analysis of fiscal year 2012 collection data provided by the New York City Department of Sanitation; U.S. Department of Commerce, U.S. Census Bureau, 2012 American Community Survey, Selected Housing Characteristics – 1-year estimates (accessed November 6, 2014), http://factfinder2.census.gov/faces/tableservices/jsf/pages/productview.xhtml?pid=ACS_12_1YR_DP04&prodType=table; and New York State Department of Environmental Conservation, Volume-to-Weight Conversion Factors (accessed November 10, 2014), ftp://ftp.dec.state.ny.us/dshm/SWMF/Info/Volume%20to%20Weight%20Conversion%20Factors.pdf.
- In fiscal year 2014 waste exports costs were $307 million, and the amount of refuse collected was 3,281,000 tons. New York City Office of Management and Budget, Adopted Fiscal Year 2015 Budget, Budget Function Analysis (June 27, 2014), www.nyc.gov/html/omb/downloads/pdf/adopt14_bfa.pdf; and New York City Office of the Mayor, Mayor’s Management Report, Fiscal Year 2014 (September 2014), p. 91, www.nyc.gov/html/ops/downloads/pdf/mmr2014/dsny.pdf.
- DSNY’s allocation of costs includes administration and overhead but excludes certain debt payments.
- Of the 3.7 million tons of refuse and recycling collected by DSNY, about 3.1 million is from residential homes. The 3.1 million figure includes household curbside waste, residential bulk waste, special housing authority, and Passover collections and 10 percent of containerized “EZ-Pack” and “Roll-on/Roll-off” trucks collections. CBC staff analysis of fiscal year 2012 collection data provided by the New York City Department of Sanitation.
- U.S. Department of Commerce, U.S. Census Bureau, 2013 American Community Survey, Selected Housing Characteristics – 1-year estimates (accessed November 6, 2014), http://factfinder.census.gov/faces/tableservices/jsf/pages/productview.xhtml?pid=ACS_13_1YR_DP04&prodType=table.
- The average private waste carter price per ton for collection and disposal in 2012 was $184.69, as reported to the New York City Business Integrity Commission.
- For more on how to reduce costs at the Department of Sanitation, see Citizens Budget Commission, Getting the Fiscal Waste Out of Solid Waste Collection in New York City (September 2014), http://www.cbcny.org/sites/default/files/REPORT_FiscalWasteSolidWaste_09232014.pdf.
- Based on assigned curbside refuse and recycling collection worker hours. CBC staff analysis of fiscal year 2012 collection data provided by the New York City Department of Sanitation; and U.S. Department of Commerce, U.S. Census Bureau, 2013 American Community Survey, Selected Housing Characteristics – 1-year estimates (accessed November 6, 2014), http://factfinder.census.gov/faces/tableservices/jsf/pages/productview.xhtml?pid=ACS_13_1YR_DP04&prodType=table.
- A few public authorities provide limited collection services. For example, in upstate New York, the Oneida-Herkimer Solid Waste Authority provides collection for the city of Utica and subcontracts collection for five small towns, although the Authority’s primary function is to finance trash disposal and recycling facilities. Oneida-Herkimer Solid Waste Management Authority, 2013 Annual Report, p. 29, www.ohswa.org/assets/Uploads/Board-of-Directors/Annual-report/2013-Annual-Report.pdf; and Oneida-Herkimer Solid Waste Management Authority, Financial Statements for Years Ended December 31, 2013 and 2012 (March 14, 2014), p. 29, www.ohswa.org/assets/Uploads/Board-of-Directors/Financial-Statements/2014/Final-Fin-Report-OHSWMA-2013-Web.pdf. Examples of public authorities for solid waste in New York State include Resource Recovery Agencies in Dutchess County, Islip, Onondaga County, and Ulster County; and Solid Waste Management Authorities in Eastern Rensselaer County; Franklin County; Montgomery, Otsego, and Schoharie Counties; North Hempstead; Oneida and Herkimer Counties; and Rockland County. New York State Authority Budget Office, “Local Public Authority Directory and Reports” (accessed November 14, 2014), www.abo.ny.gov/paw/paw_weblistingLOCAL.html.
- Berlin Senate Department for Urban Development and the Environment, “Municipal Waste Management in Berlin” (December 2013), p. 25, www.stadtentwicklung.berlin.de/umwelt/abfallwirtschaft/downloads/siedlungsabfall/Abfall_Broschuere_engl.pdf.
- New York City Municipal Water Finance Authority, “About us” (accessed November 13, 2014), www.nyc.gov/html/nyw/html/aboutus.html.
- The rental payment is no more than the greater of 1) principal and interest on City general obligation bonds, or 2) 15 percent of principal and interest on Municipal Water Finance Authority debt. The rental payment calculation has been the subject of debate. Citizens Budget Commission, New York City’s Water and Sewer System: Is the Rent Too Damn High? (December 2011), www.cbcny.org/sites/default/files/BRIEF_Water_12152011.pdf; and New York City Municipal Water Finance Authority, Comprehensive Annual Financial Report, Fiscal Year 2013, pp. 40-41, www.nyc.gov/html/nyw/pdf/nyw_annual_report_13.pdf.
- The Board is made up of seven members who are appointed by the Mayor and serve two-year terms. At least one member must have experience in the science of water resource development, and none can be a member of the MWFA. New York State Public Authorities Law, Title 2A, Section 1045-f, http://public.leginfo.state.ny.us/LAWSSEAF.cgi?QUERYTYPE=LAWS+&QUERYDATA=$$PBA1045-F$$@TXPBA01045-F+&LIST=LAW+&BROWSER=BROWSER+&TOKEN=29050047+&TARGET=VIEW.
- New York City Office of the Comptroller, “NYC Bonds – Investor Data – Credit Reports – GO, TFA and NYW Bond Ratings and Ratings Reports” (accessed November 13, 2014), http://comptrollernyc.com/general-information/nyc-bonds/.
- In May 2013 the organics diversion pilot began with 3,250 households in Staten Island’s Westerleigh neighborhood and expanded the following fall to 14,000 households in Staten Island District 1 Section 4 (Westerleigh, Mariner’s Harbor, and Graniteville), 9,400 households in Bronx District 1 Section 2 (Throgs Neck, Country Club, Silver Beach, and Edgewater Park), and 8,400 households in Brooklyn District 7 Section 1 (Windsor Terrace, Greenwood Heights, and Park Slope). Each of these pilot areas has above average waste diversion rates; not including organic material, diversion rates are 21.4 percent in the Staten Island demonstration area, 22.1 percent in the Bronx area, and 26.5 percent in the Brooklyn neighborhoods. New York City Department of Sanitation, Local Law 77 of 2013 Organic Collection Pilot Program, Program Report, through March 2014 (June 2014), pp. 13-15, www.nyc.gov/html/dsny/downloads/pdf/pubinfo/pr_pdfs/DSNY_LL77_DiversionReport_June2014.pdf.
- Kathryn Garcia, Testimony to the New York City Council Committees on Finance and Sanitation, Hearing on the FY 2015 Executive Budget (May 15, 2014), p. 2.
- New York City Department of Sanitation, “Organics Collection Pilot Areas” (accessed January 7, 2015), www.nyc.gov/html/nycwasteless/html/compost/collections_ocp_pilotareas.shtml.
- New York City Department of Sanitation, “Organization” (accessed January 7, 2015), www.nyc.gov/html/dsny/html/about/org_cleaning.shtml.
- For example, if average monthly refuse generation in the neighborhood is four 30-gallon bags per unit, a 100-unit building would be expected to set out 400 refuse bags per month. If the City allocated 40 percent of the neighborhood average, the building would be allocated 160 bags per month. If each bag or tag cost $2, then the rebate would equal $480 per month, which is the cost of purchasing 240 bags or tags. Therefore, if the building set out an average amount of refuse (400 bags per month), the net financial impact would be $0, but if the building set out less than 400 bags, the owner would save money.