Whose Burden Is It Anyway?
Housing Affordability in New York City by Household Characteristics
In a series of policy briefs last year, CBC examined housing affordability across large U.S. cities to assess New York’s situation in a broader context.1 Using federal data sources, CBC found that while many New Yorkers face high rents, and the share of households who are “rent burdened” (paying more than 30 percent of income toward rent) grew between 2000 and 2012, the city ranks near the middle among 22 large cities in the share of rent-burdened households. A second analysis revealed New York has the lowest transportation costs among the 22 cities studied due to the large proportion of residents who commute via mass transit.2 When housing and transportation costs are combined, the city rises from 13th to 3rd place in affordability. The average New York household pays 32 percent of its income towards housing and transportation costs, well within the U.S. Department of Housing and Urban Development’s (HUD’s) affordability guideline of 45 percent. CBC also examined how some “typical” households (as defined by HUD) fared in terms of housing and transportation costs in the same group of cities. In this analysis, low-income households in New York also ranked relatively well despite facing serious rent burdens.
This report looks at New York City rent burdens in more detail, using an in-depth housing survey conducted by the U.S. Census Bureau to consider a variety of household characteristics. The use of a New York-specific survey precludes regional comparisons but the findings should be useful in helping the de Blasio administration shape its approach to housing affordability.
Key findings from the survey include:
- Forty-two percent of New York City’s renter households are “rent burdened;” that is, adjusting for actual rent paid by each household (“out-of-pocket contract rent” plus utility costs) and food stamp benefits, they pay more than 30 percent of income in rent.
- Half of the rent burdened households are severely rent burdened, paying more than 50 percent of income in rent. Ninety-four percent of these severely rent-burdened households are low income.
- Low-income severely burdened households are disproportionately comprised of singles and seniors. They are also disproportionately households with children and located in the outer boroughs.
These findings show the affordability problem is severe among some portions of the population even though the city as a whole fares well in comparison to other cities.
How Large Is the Rental Affordability Problem in New York City?
Housing affordability is defined as the ratio of housing costs to household income. The standard threshold for deeming a household “rent burdened” is when rent exceeds 30 percent of income. This standard is widely used for housing policy decisions at the federal, state, and local level.3 Housing costs are generally measured as combined monthly contract rent and reported monthly utility costs, known as “gross rent.” Gross rent data are collected by the U.S. Census Bureau and are helpful for providing uniformity when comparing housing costs across the country. However, the data have important limitations.
The use of gross rent overstates the affordability problem because it does not account for subsidies and other support received by renters that reduce the actual amount of rent paid. For example, in cities like New York, where an array of subsidy programs exist to reduce the cost of housing, the difference between gross rent and the actual rent paid by tenants can be substantial. Thus a proper accounting of the rental affordability burden requires a more accurate measurement of the problem.
New York City contracts with the Census Bureau to conduct a separate housing survey every three years—the New York City Housing and Vacancy Survey (NYCHVS), last performed in 2014 and released in June 2015.4 The NYCHVS collects detailed data on household characteristics, including a figure for “out-of-pocket” rent. Out-of-pocket rent is the actual amount tenants report paying for housing costs on a monthly basis after receiving government subsidies and financial support from family or friends. This report uses out-of-pocket rent to calculate the housing affordability ratio because it is a more accurate indicator.5
More accurate measurement of the affordability ratio also requires adjusting household income for subsidies. Most forms of income support are already captured by the NYCHVS, but one source of income about which information is not collected is Supplemental Nutrition Assistance Program (SNAP) benefits, also known as “food stamps.”6 This report adjusts household income to provide a conservative estimate of additional income received from food stamps for households.7
Table 1 presents the number of burdened households by severity of rent burden. The “Gross Rent” column shows the number of households that are burdened when using gross rent divided by reported household income to determine the affordability ratio. The “Adjusted Income” column uses out of pocket rent and divides it by adjusted household income. (See definition box). Rent-burdened households in the final column also exclude all households receiving Housing Choice Vouchers or living in public housing operated by the New York City Housing Authority. (These households are, by definition, limited to paying “affordable” portions of their income toward housing under the rules of federal public housing support.) Finally, households that did not report income or rent are also excluded from the adjusted income column.8
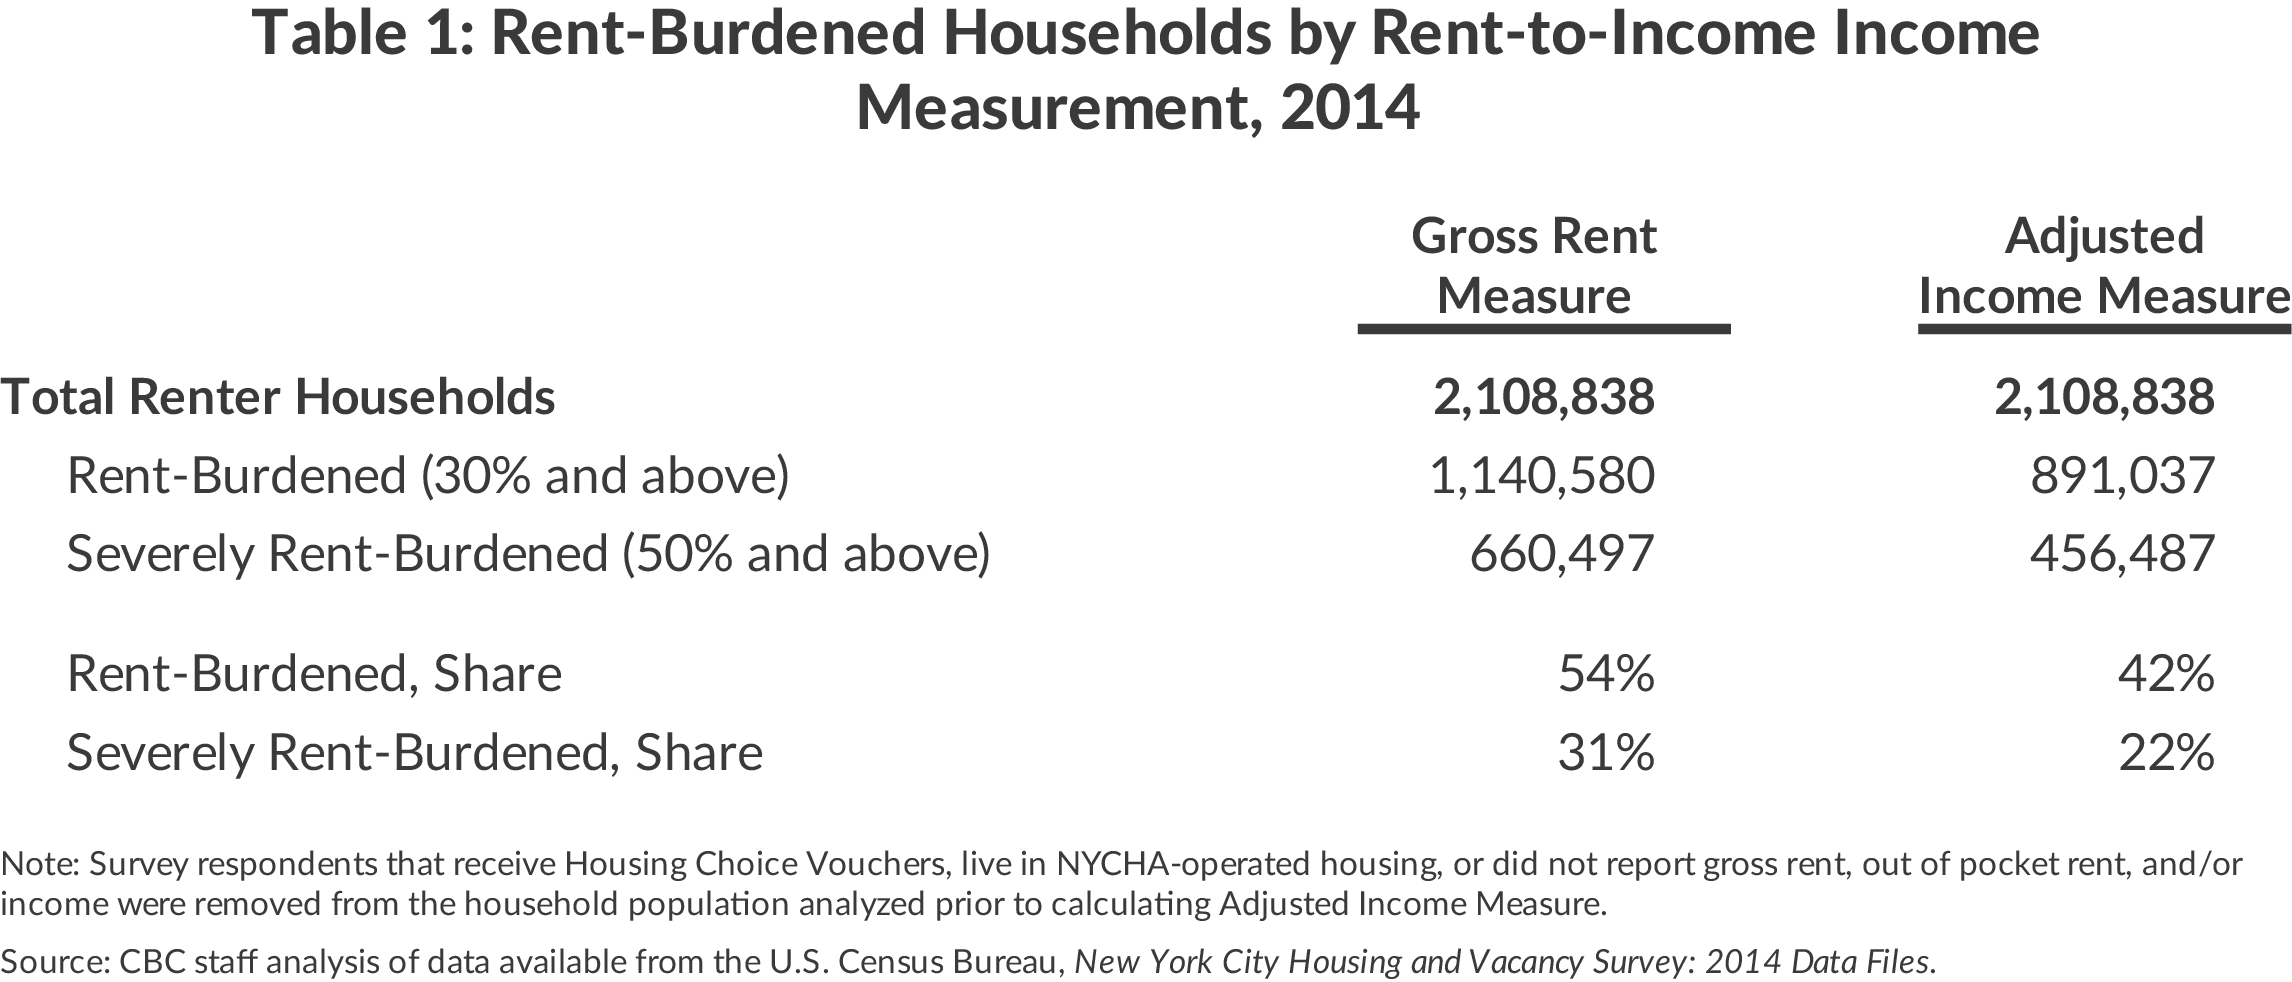
The gross rent measure overstates the extent of the housing burden in New York City; under that measure, about 54 percent of households are burdened. The number of burdened households is substantially reduced after adjustments are made for out-of-pocket rent and income support, dropping from more than 1.1 million to 891,037, or 42 percent of households.
Housing Affordability Ratios
Gross Rent Measure = Gross Rent Paid/Household Income
Adjusted Income Measure = Gross Out of Pocket Rent/Household Income + SNAP Benefits
Income Level of Burdened Households
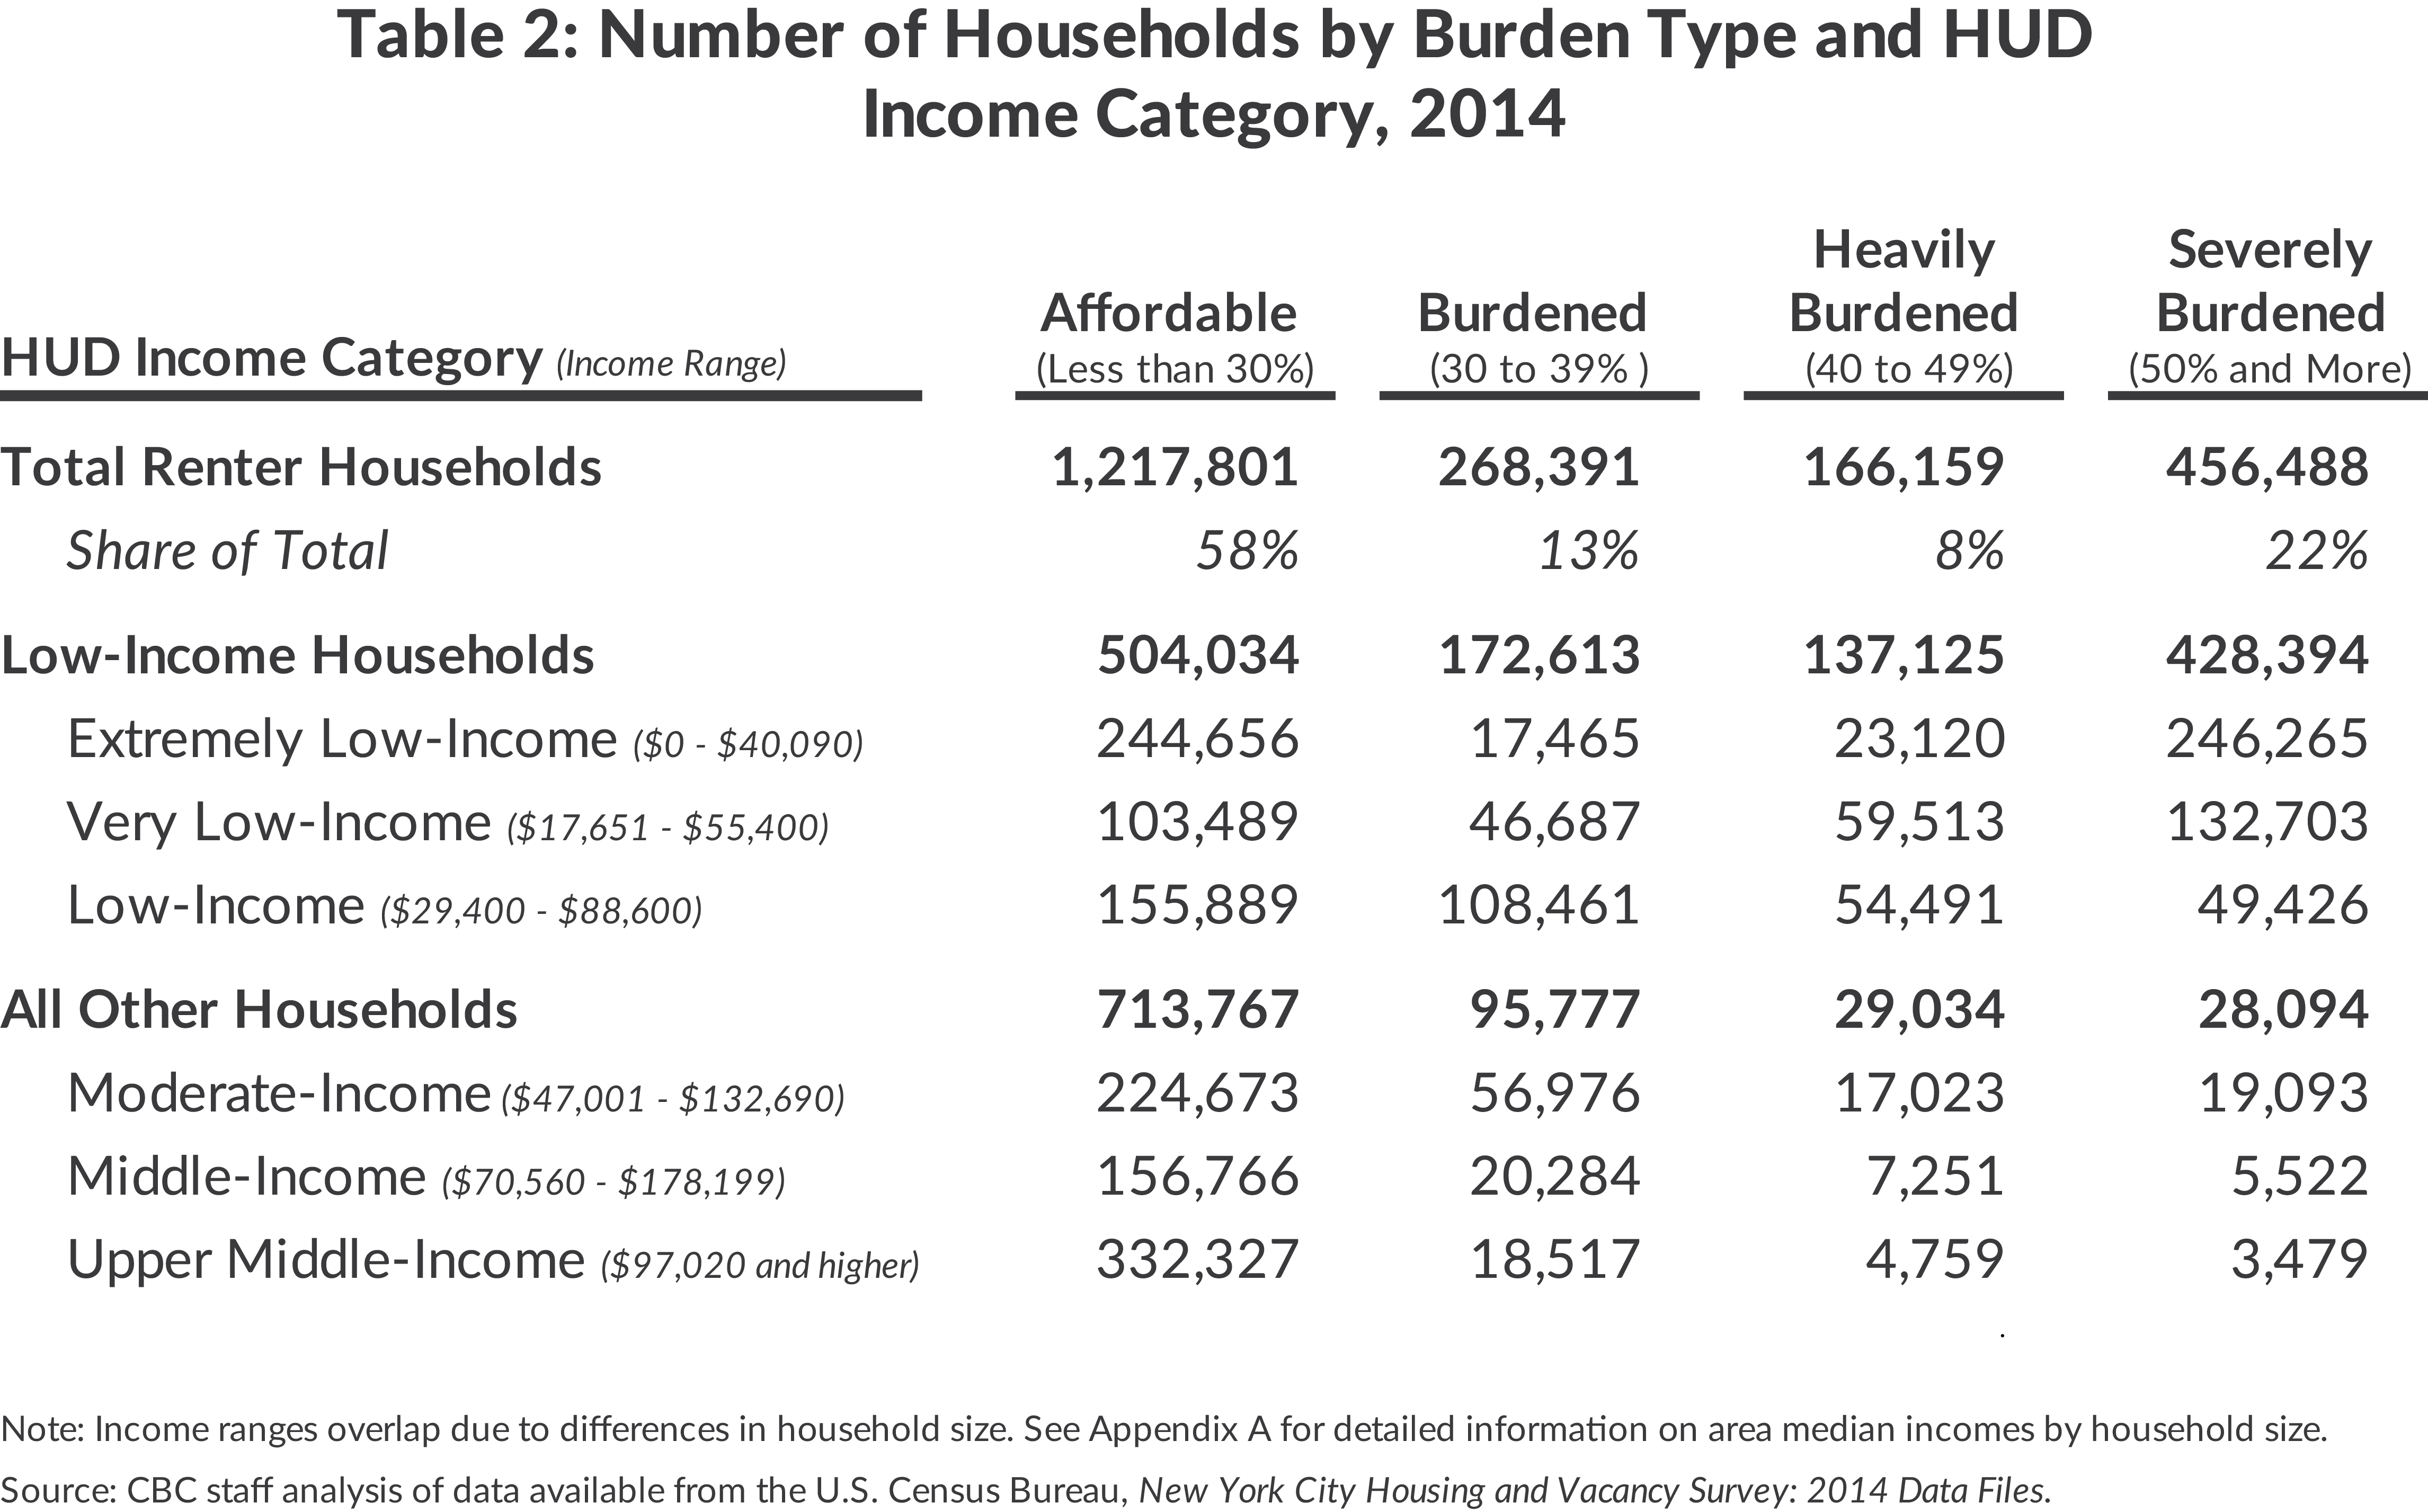
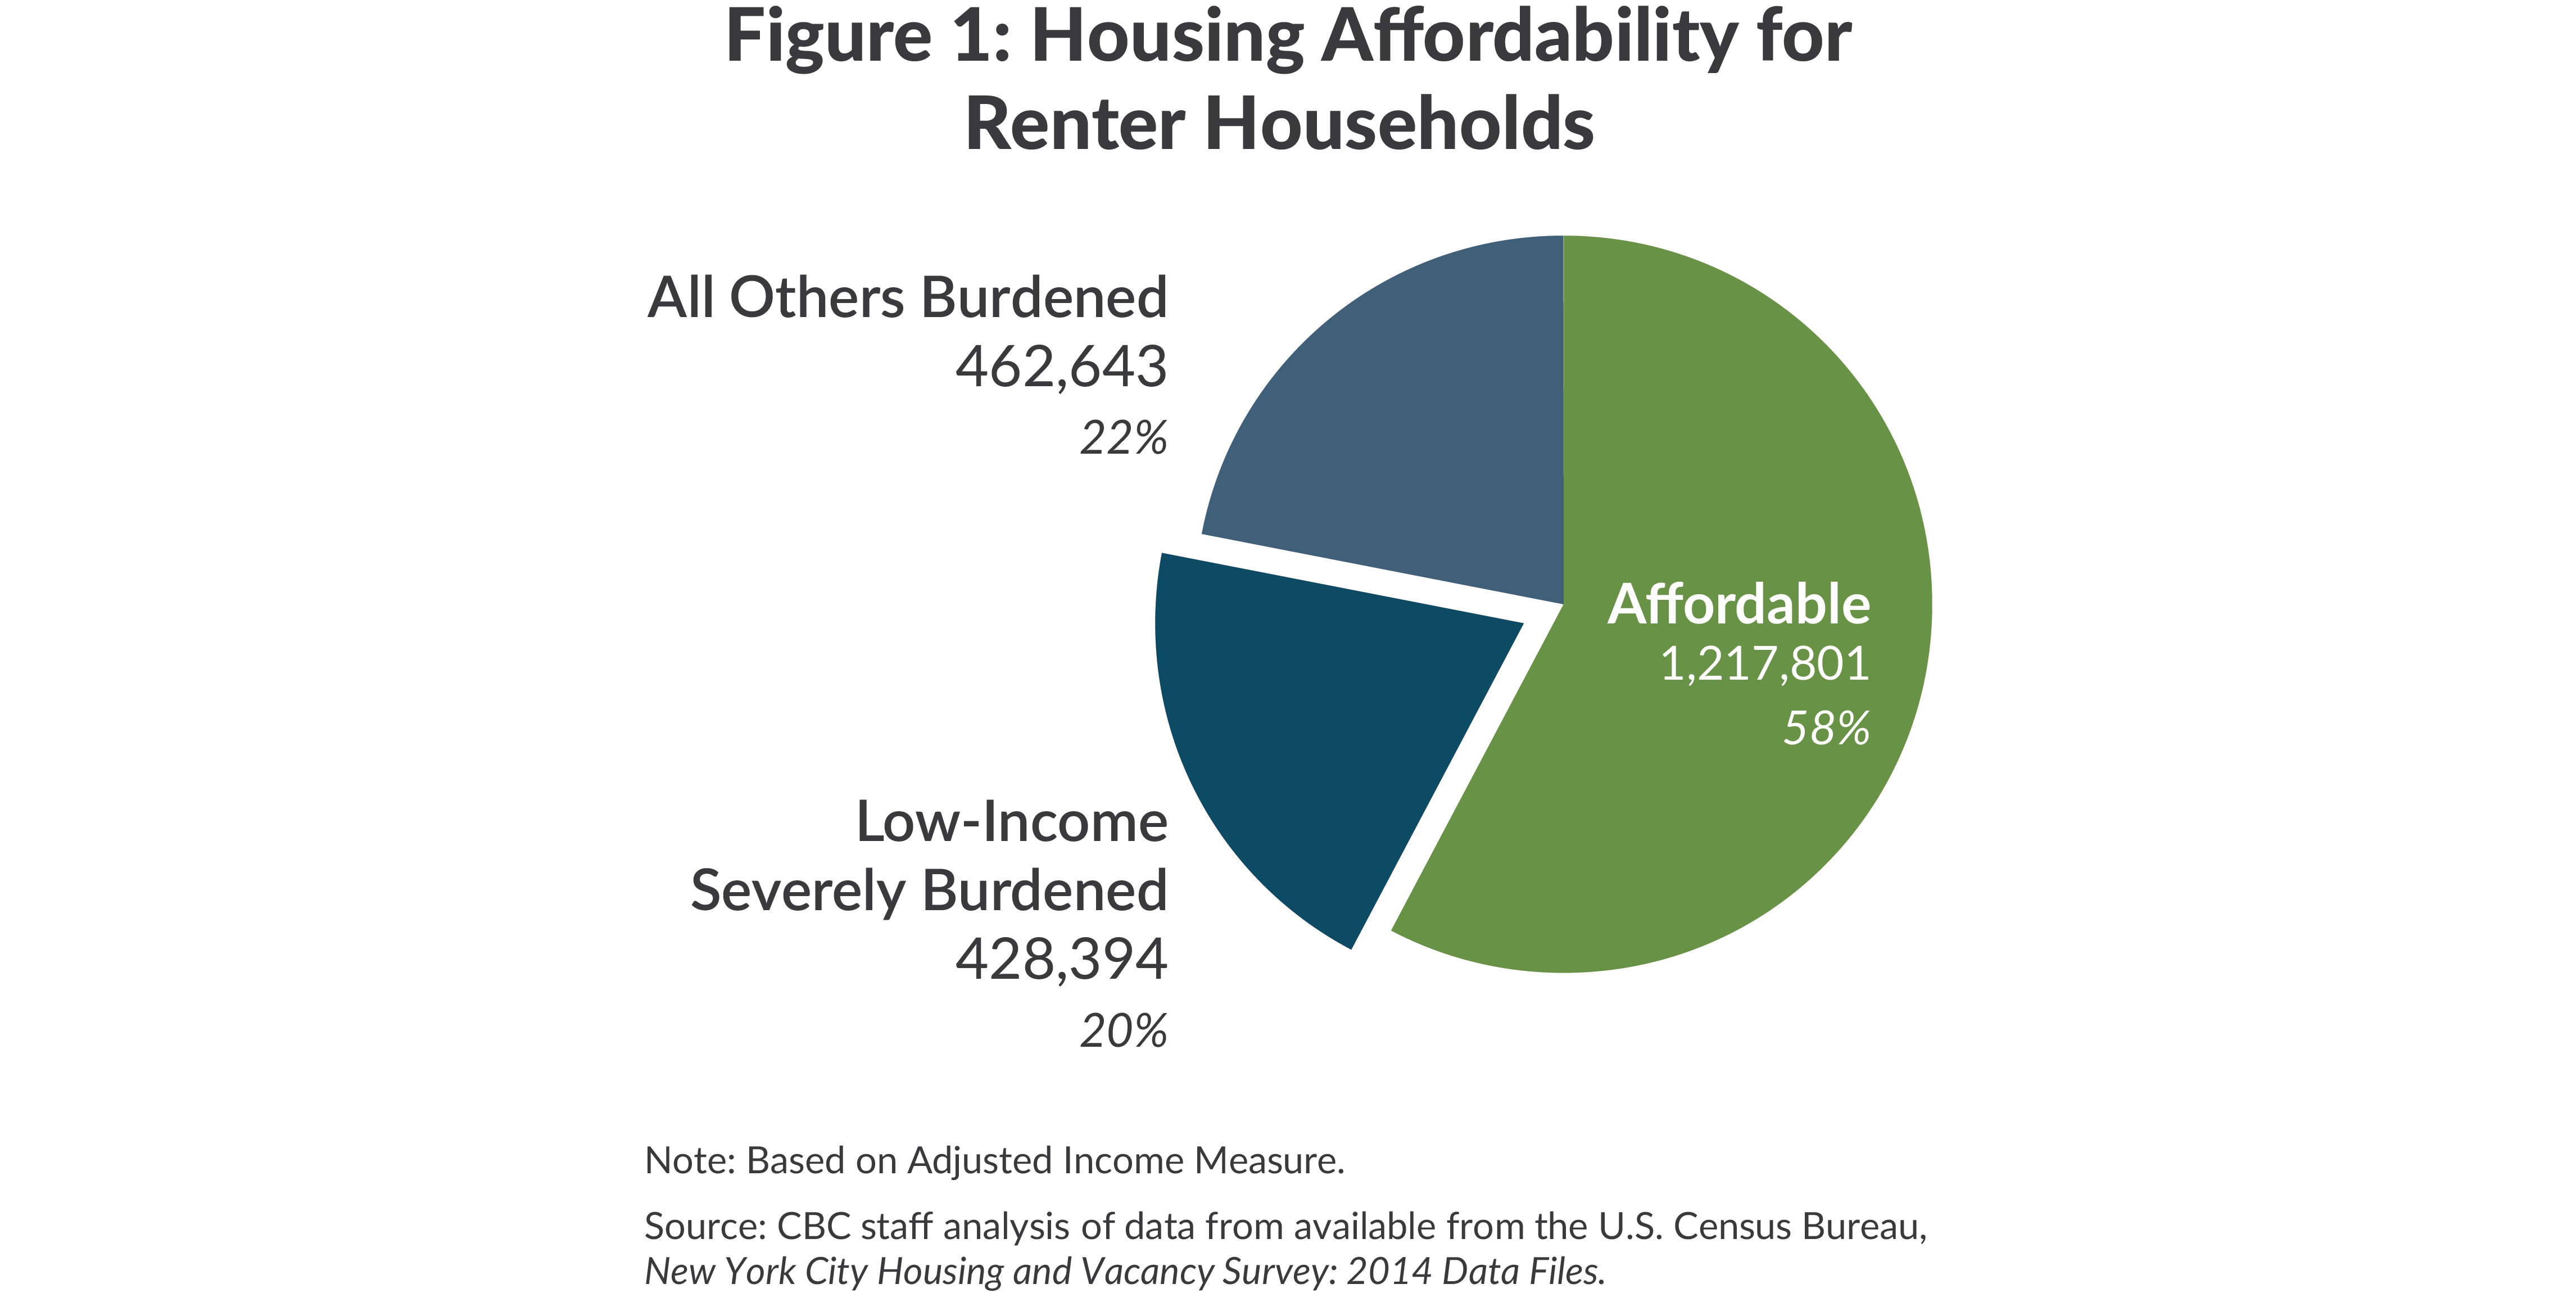
More than 1.2 million households, or 58 percent of renter households, do not face rent burdens. Of 42 percent of households that are burdened, 13 percent face housing costs between 30 and 40 percent of income, 8 percent face a “heavy” burden of 40 to 50 percent, and about 22 percent face a “severe” burden of more than 50 percent of income.
This report groups low-income burdened households into two categories: burdened households and severely-burdened households.9 There are 738,132 low-income burdened households (about 35 percent of all renter households) paying housing costs of more than 30 percent of income, of whom 428,394 are severely burdened. These low-income burdened households make up 94 percent of all households paying more than 50 percent of income for rent.
What Are the Characteristics of Low-Income Severely Burdened Households?
Given that 94 percent of severely burdened households are low income, it is clear that the housing affordability problem is in large part an income problem, and it is important to understand who among the low-income is most likely to face severe rent burdens. This section focuses on the demographics of low-income households that are severely burdened (428,394 or 20 percent of all New York City renter households). These households are assessed based on household composition and age as well as by the extent of their rent burdens. (See Table 3a.)Singles are the most numerous household type among the low-income severely burdened (183,394 or 43 percent of the total), and have the highest incidence of severe rent burden (25 percent), followed closely by single parents (24 percent). (See Table 3b for the share of household types in each category.) Looking at the age breakdown within these groups shows the group most severely burdened is single seniors, 32 percent of whom pay more than half of their income in rent.
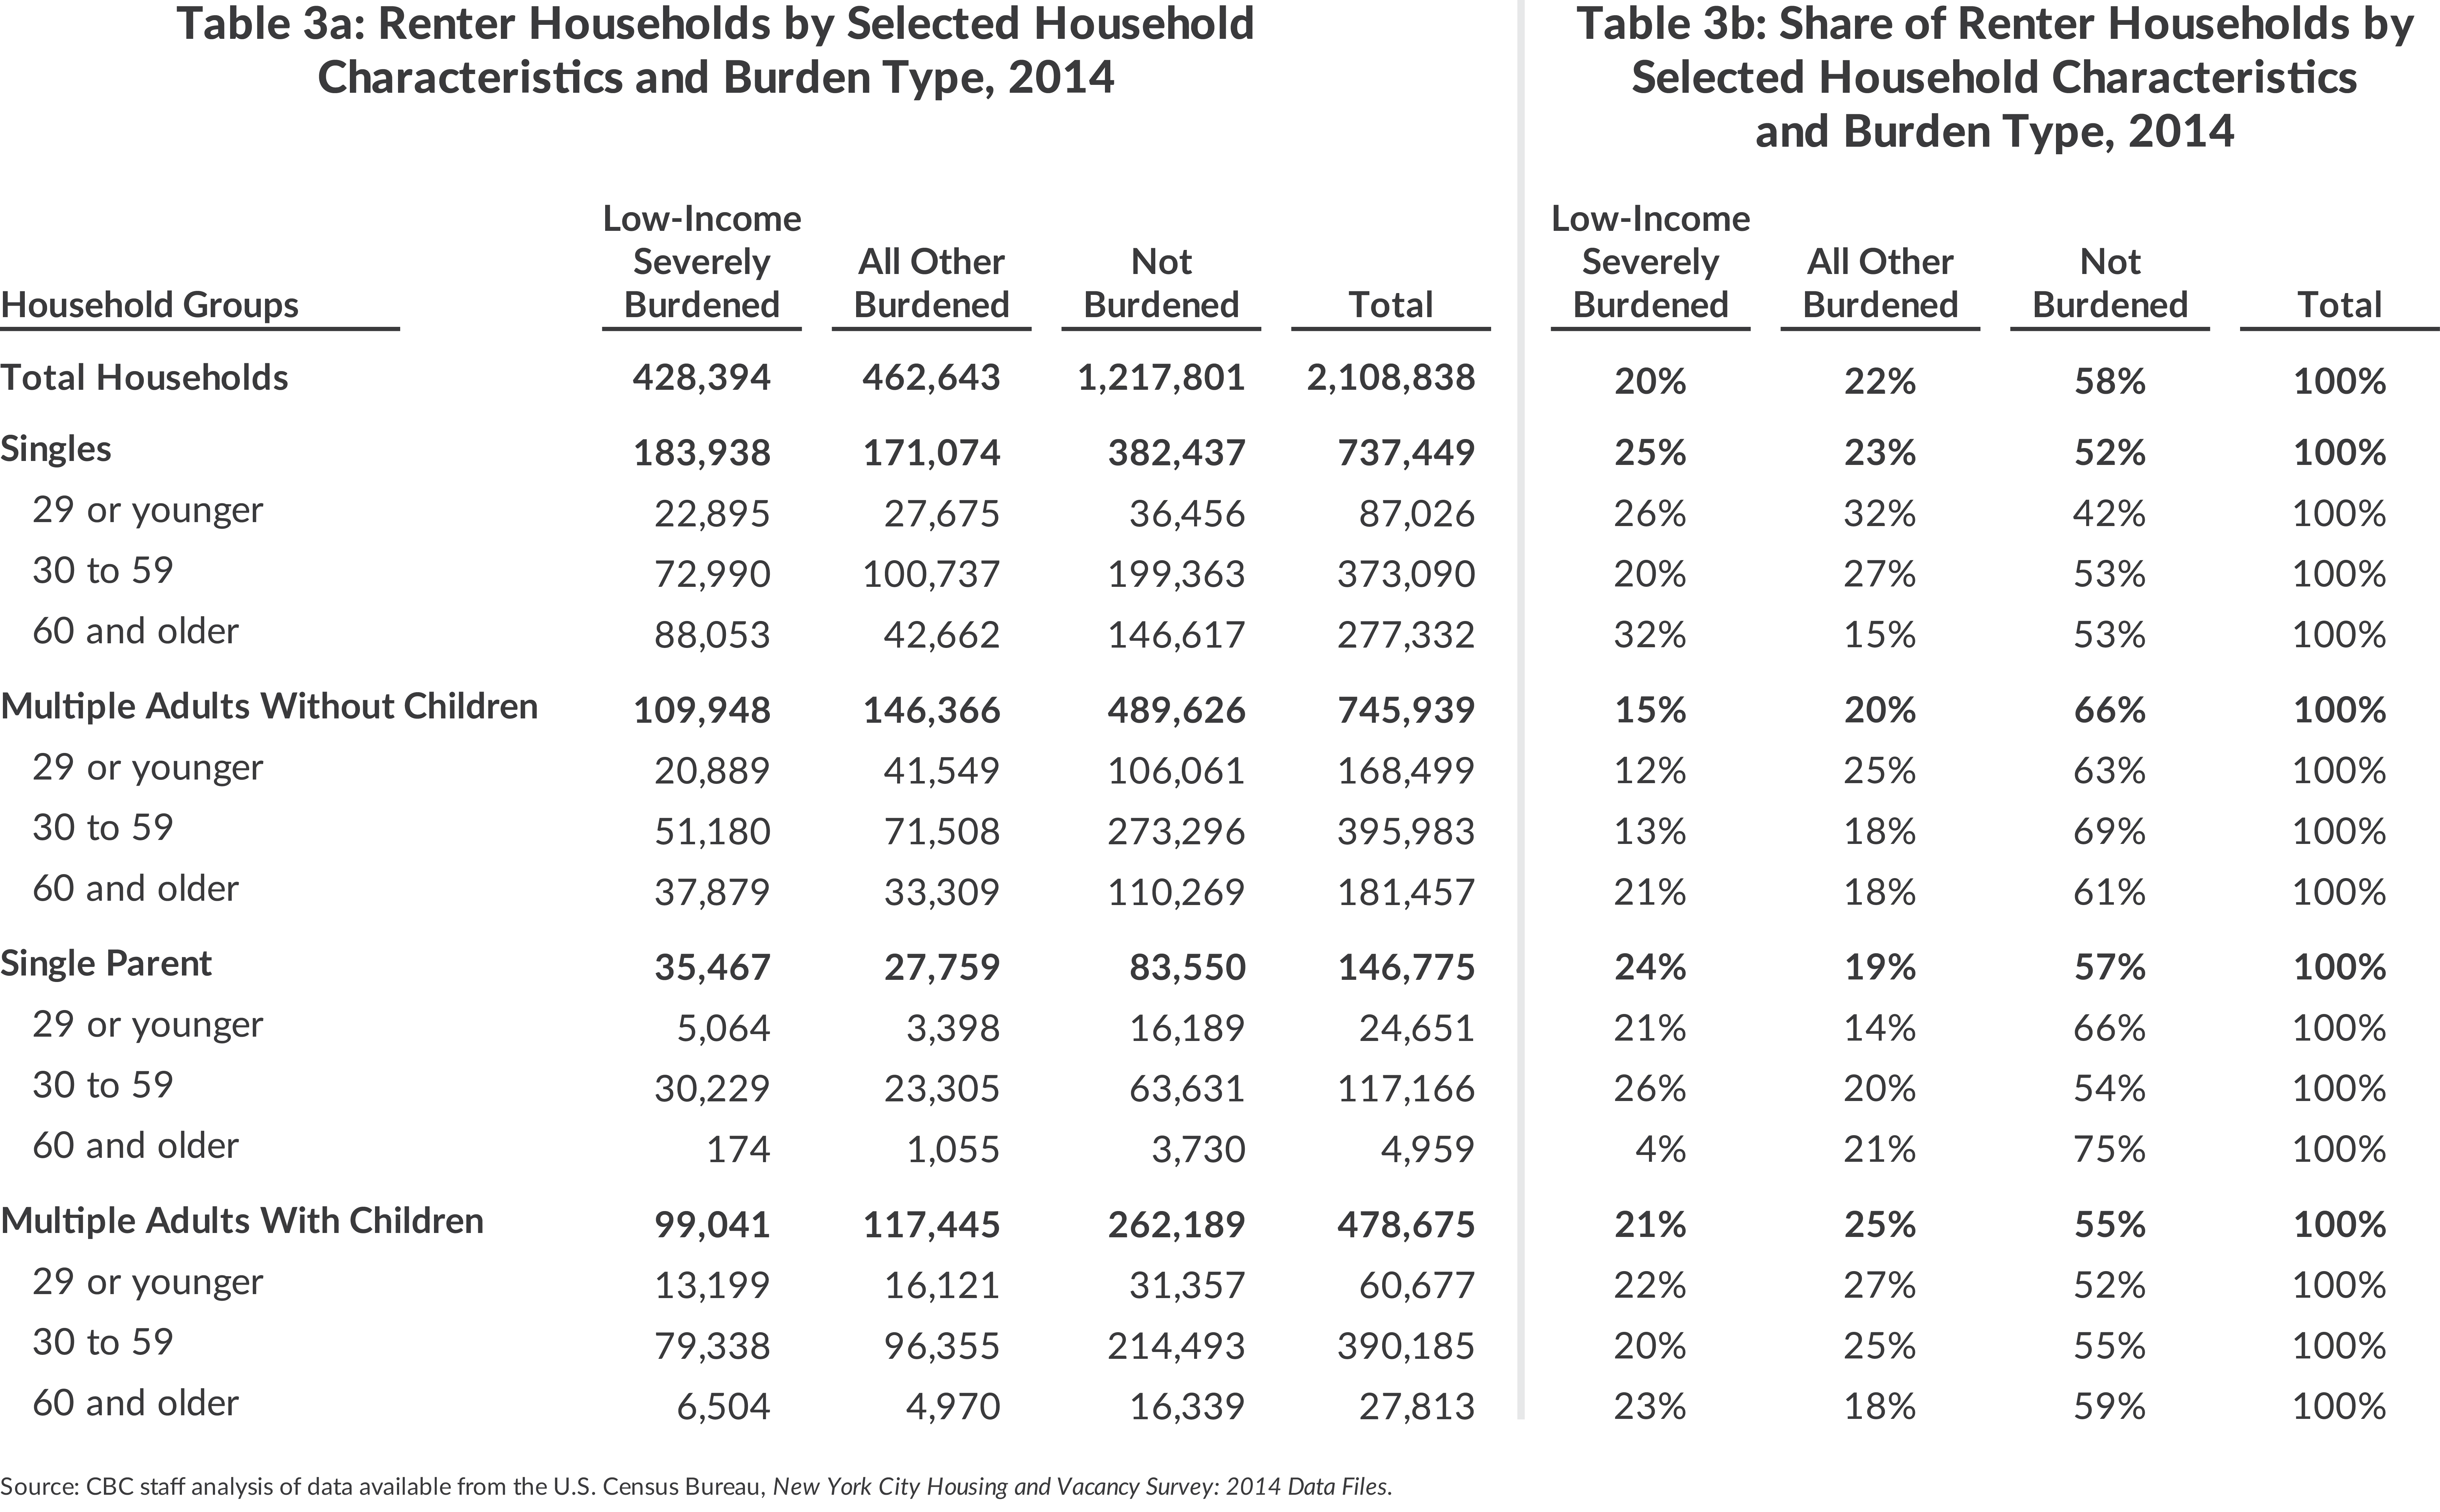
Multi-adult households without children (109,948) are also a large group of the low-income severely burdened; 15 percent were severely burdened. Within that group, 21 percent of those over 60 years old were severely burdened.
There are almost as many severely burdened multi-adult households with children (99,041) as there are without children (109,948) and they are notably more likely to face the high burdens than their counterparts without children at home.
The household composition type with the fewest households among the severely burdened is single parents, with 35,467 households in the city. Collectively, they were 24 percent of the low-income severely burdened. Within that group, those ages 30 to 59 had the greatest share of severely burdened—26 percent. Only single seniors had a greater share (32 percent).
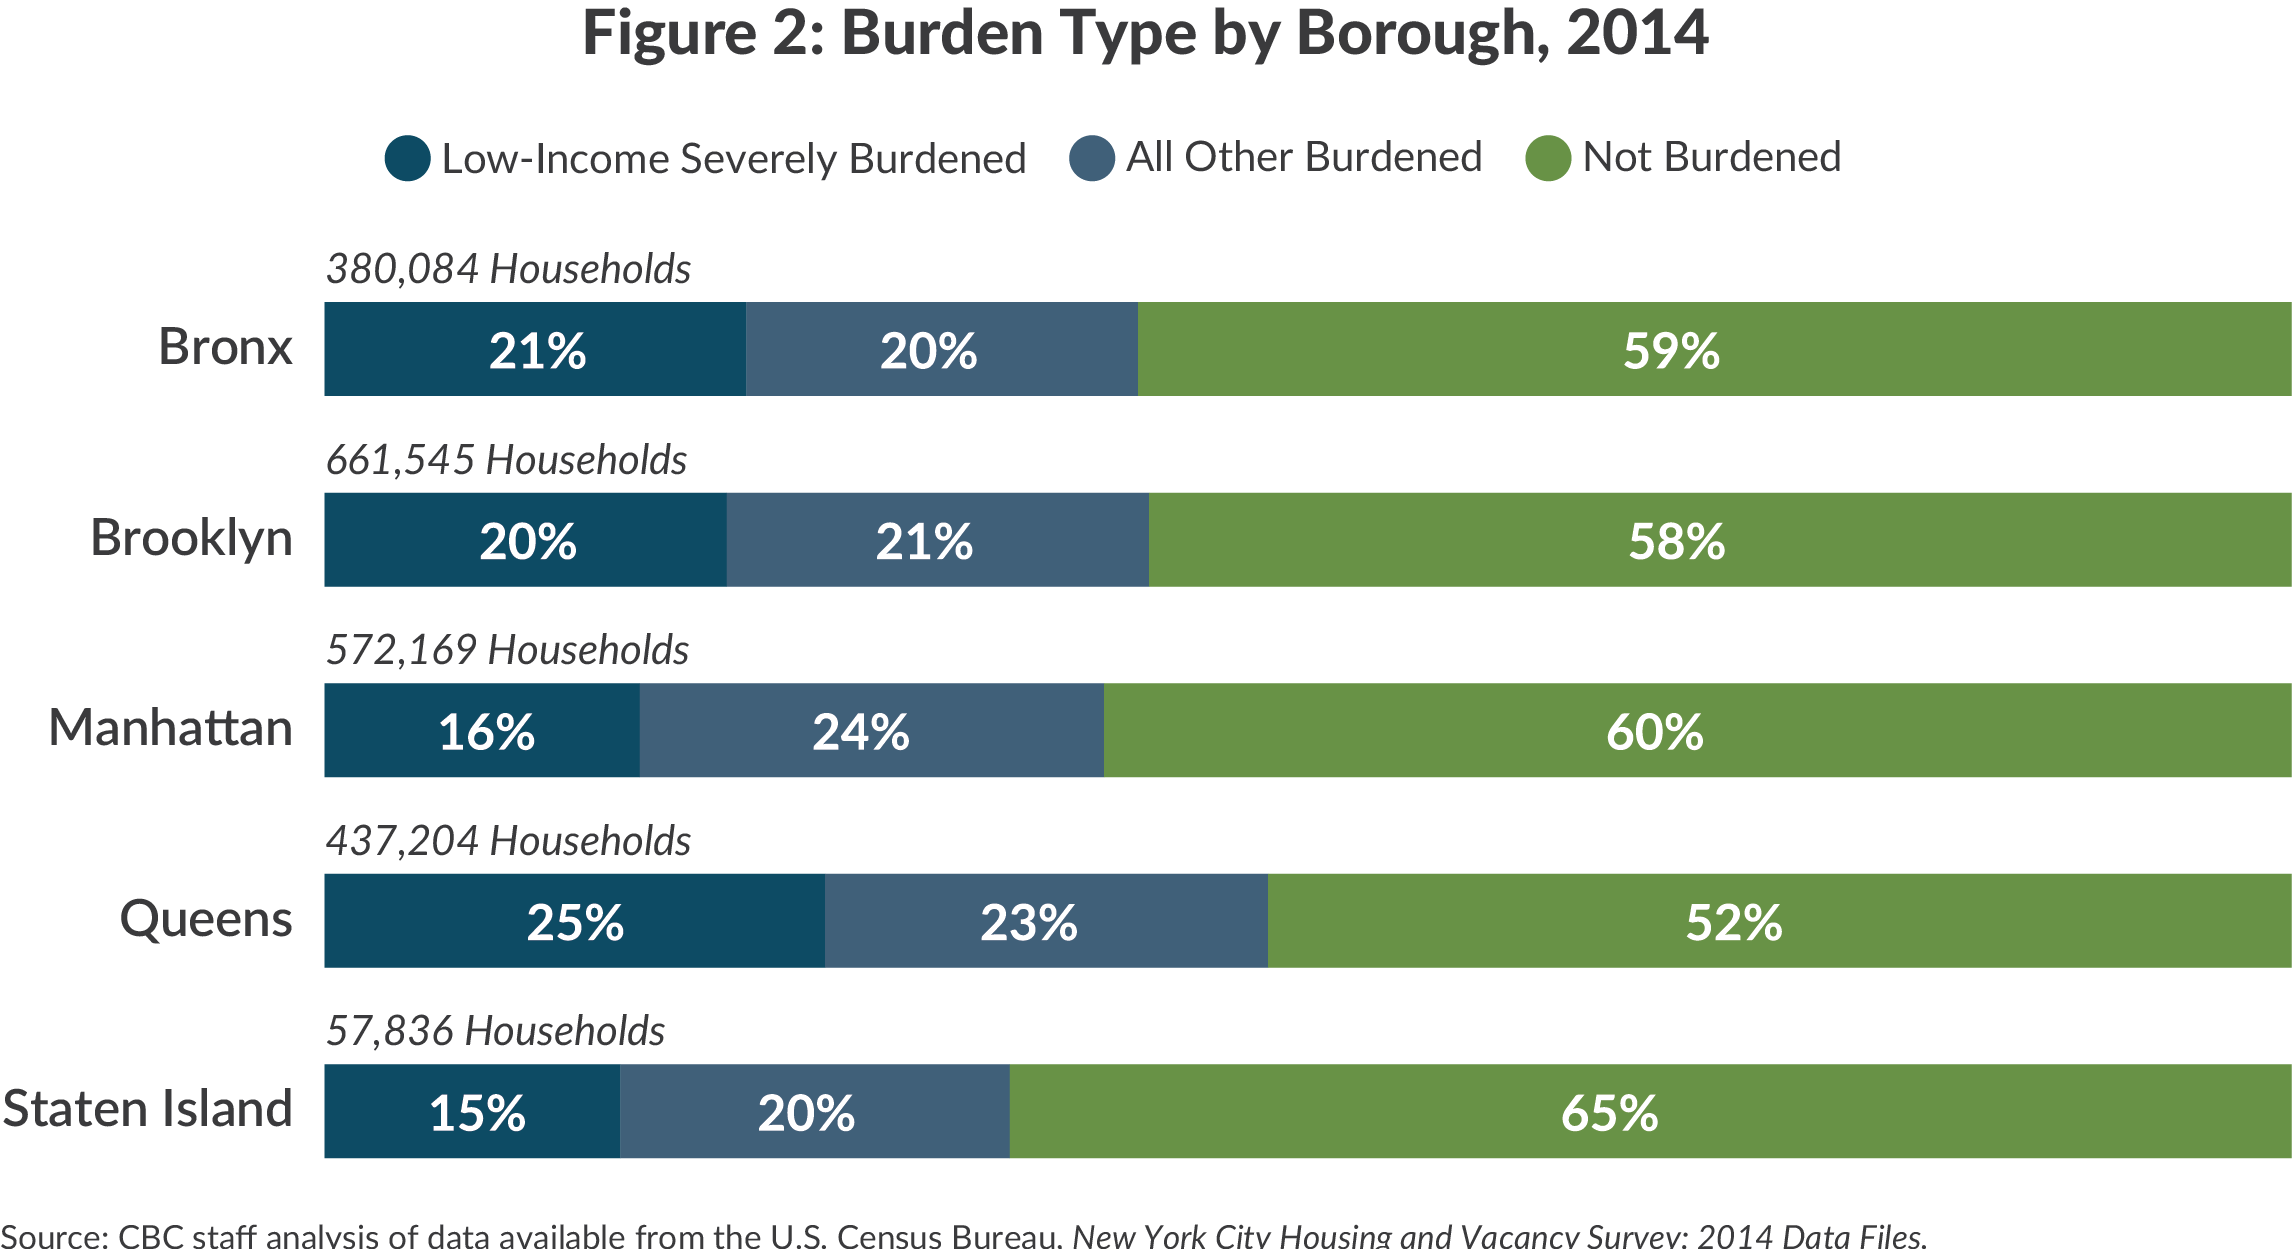
Housing costs also vary substantially based on location. Figure 1 shows households in Queens, Brooklyn, and the Bronx shoulder a larger share of the burden relative to the renter population in Manhattan and Staten Island. A quarter of the tenant households in Queens were low-income severely burdened, the highest rate among all boroughs.
Conclusion
As the de Blasio administration implements its plan to preserve and enhance the supply of affordable housing in New York City, it is useful to have an understanding of which households tend to struggle the most to meet housing costs. This analysis identified and analyzed renter households that pay more than 30 percent (burdened) and 50 percent (severely burdened) of income for housing costs. In 2014, there were 892,142 households that were burdened and 457,548 households that were severely burdened. The vast majority of these households were low-income, suggesting that the problem stems as much from the housing market itself as from income shortfalls. Attention should be paid in particular to single seniors and single parents in targeting programs to address affordability.10
Footnotes
- Citizens Budget Commission, The Affordable Housing Crisis: How Bad Is it in New York City? (policy brief, August 5, 2014); Citizens Budget Commission, Housing Affordability Versus Location Affordability: The Rent Is Too Damn High! But the MetroCard Is a Pretty Good Deal (policy brief, August 13, 2014); Citizens Budget Commission, Location Affordability in Large U.S. Cities: Variability Among Types of Households (policy brief, August 20, 2014).
- The Location Affordability Index is developed by U.S Department of Housing and Urban Development (HUD).
- U.S. Department of Housing and Urban Development, Affordable Housing, http://portal.hud.gov/hudportal/HUD?src=/program_offices/comm_planning/affordablehousing.
- Preliminary findings from the 2014 New York City Housing and Vacancy Survey, released on February 25, 2015, did not include microdata. The 2011 New York City Housing and Vacancy Survey are still the most recent data available for this analysis. No results in the 2014 overview were published regarding out-of-pocket rents. Data on median gross rent to income showed a slight increase since 2011, but suggest the findings of this report are still relevant and useful for analyzing New York City’s renter population.
- For this analysis, spending on utilities has been added to “out-of-pocket” rent to calculate a gross out-of-pocket rent figure in order to provide a fair comparison with gross rent. Definitions of out of pocket rent and electric, gas, water, and other fuel costs can be found at U.S. Census Bureau, New York City Housing and Vacancy Survey: 2014 NYCHVS Glossary, www.census.gov/housing/nychvs/data/2014/gloss14.pdf.
- Income sources included in reported income include wages and salary, net income from business ownership, capital gains, social security, retirement and disability pensions, veterans payments, unemployment compensation, child support, alimony, supplemental security income, temporary assistance for needy families, safety net assistance, and shelter allowance. The New York City Housing and Vacancy Survey does not include the Earned Income Tax Credit (EITC), and it is not calculated here because the amount received by any given household is not a direct function of income. The average federal EITC amount for households in New York State was $2,309 in 2013. New York State credits a fixed rate of 30 percent of the federal EITC amount, while New York City credits a fixed rate of 5 percent of the federal credit. More than 901,000 filers received the tax credit from New York City in 2012, the latest year where data are available. Sources: Internal Revenue Source, Statistics for Tax Returns with EITC (January 2015), www.eitc.irs.gov/EITC-Central/eitcstats; and New York City Department of Finance, Annual Report on Tax Expenditures: Fiscal Year 2015 (February 2015), www1.nyc.gov/assets/finance/downloads/pdf/reports/reports-tax-expenditure/ter_2015_final.pdf.
- The income adjustment for SNAP benefits was made for households that were not headed by an immigrant and also earned less than 125 percent of the federal poverty level. The amount is adjusted for household size. This adjustment is based on a calculation of SNAP benefits from the Manhattan Institute for Policy Research, Issue Brief No. 30: New York’s Rent-Burdened Households: Recalculating the Total, Finding a Better Solution (August 2015), www.manhattan-institute.org/pdf/ib_30.pdf. The per person benefit is estimated at $138.78 monthly from fiscal year 2014 estimates available from the U.S. Department of Agriculture, Supplemental Nutrition Assistance Program: Average Monthly Benefit per Person, www.fns.usda.gov/sites/default/files/pd/18SNAPavg$PP.pdf.
- A total of 117,817 households did not report income, gross rent, and/or out of pocket rent.
- A detailed table on area median income based on household income adjusted for household size is available in the Appendix of this report.
- Recent efforts to update New York City’s zoning regulations, such as the attention to “micro units” suggest the administration recognizes the concentration of burden among these households.