It’s Time for New York State to Heed SAGE Advice on Performance Management
INTRODUCTION
The COVID-19 pandemic continues to affect profoundly the people of New York State. State government has constructed a framework, “NY Forward,” to track the spread of and response to COVID-19, and establish goals and metrics to allow for a gradual reopening of industries, public spaces, and congregate social settings. NY Forward organized the planning, communication, and evaluation of regional conditions for transition, and its framework is disseminated through a written document and a regularly updated data dashboard which tracks regional progress.1 Governor Andrew Cuomo has stated that the value of NY Forward is to clearly and objectively inform public leaders, businesses, and all New Yorkers:
NY Forward shows the progress of the State’s regions in this pandemic, and also demonstrates the value of transparent, data-driven, forward-looking public management. The performance dashboard and the Governor’s daily briefings have proven to be popular and (more importantly) useful in understanding the difficult dynamics of re-opening.3 But the State’s difficult decisions go beyond the reopening processes. Broader budget and policy determinations, especially as the State confronts the pandemic’s fiscal impacts, would also benefit from goalsetting and performance management.
Currently, New York State lacks a systematic performance management system—one that tracks the right metrics for all agencies, authorities, major programs and services; analyzes them to determine if governmental activities are efficient, effective, and of high quality; and incorporates them into a structured management process to improve performance and ensure accountability. Elected officials and public managers should be accountable for agencies’ and authorities’ performance based on established benchmarks. Other states and localities have successfully implemented performance management systems. New York State should use these best practices to design and implement a performance management system that offers comprehensive data about agency and authority programs, staffing, and spending.
Such a system would benefit the public–which would receive better value services and insight into the performance of the public sector—and it would aid decision-makers, who could use performance information to inform resource allocation.
State leaders have previously considered implementing a performance management system. The “Key Item Reporting System” (KIRS) was enacted by the Legislature and Governor Hugh Carey as part of the Accounting, Financial Reporting and Budget Accountability Act of 1981, but it was repealed in 1992.4 New York State’s most recent effort to institute government-wide performance management was Governor Andrew M. Cuomo’s Spending and Government Efficiency (SAGE) Commission convened in 2011. The SAGE Commission recommended that the State develop and implement a performance management system, dubbed “NYPerforms,” which would draw on best practices from other states and “serve as both a means for reporting information to the public and a management tool for State officials.”5 Despite the SAGE Commission’s view that the system could be operational and public for some agencies before the end of 2013, no such system yet exists. A plan issued by the State’s Division of the Budget in 2018 serves as a strong basis for performance management, but the existing framework is incomplete and not public.6
This report identifies the key components of a quality performance management system, provides a system framework, identifies best practices and examples from other states’ systems, reviews the State’s past attempts at implementing a system, offers an example of how a performance measurement and management system would work, and makes implementation recommendations.
The Citizens Budget Commission (CBC) recommends the State implement a performance management system that:
- Identifies key agency and authority programs and establishes output and outcome goals for each program;
- Identifies metrics for each program, including input (such as staffing and resources), process, output, outcome, quality, and efficiency measures;
- Establishes performance targets for each program’s outputs, outcomes, quality, and efficiency;
- Establishes implementation benchmarks for new initiatives;
- Identifies risks and pressures to State programs from adverse shocks such as natural disasters or economic downturns;
- Institutes a management and accountability process to review metrics and incorporate findings into ongoing management;
- Allows for oversight and auditing of data;
- Links to the budget cycle to inform budget and policy decisions for elected officials, agency administrators, and staff;
- Provides public information about agency, authority and program performance that is accessible, readily understood, and provides quantitative measurements of service delivery efficiency, cost, and quality; and
- Is established through statutory provisions that promote consistency in reporting across agencies, authorities, and administrations.
PERFORMANCE MANAGEMENT SYSTEM COMPONENTS
A performance management system has two fundamental components: a) performance metrics and implementation benchmarks, and b) a management review process. Performance metrics are of little value unless they are used to manage and enhance accountability, and management needs the right data to improve programs and manage spending. Management reviews the metrics to evaluate practices and progress toward reaching established goals and priorities and to assess program quality and efficiency.
Component #1: Performance Measurement
Performance metrics should include readily collected and understood data that reflect program activities and performance accurately. To monitor established programs and inform management, a portfolio of performance metrics should include inputs, processes, outputs, outcomes, quality, and efficiency.7 New initiatives should include initial implementation benchmarks to ensure timely execution, followed by performance metrics that reflect the program’s activities.
Performance metrics should fulfill the following criteria:
- Complete: The measures should cover each program component to link resources and activities (inputs, processes, and outputs) with the results (outcomes, quality, and efficiency) of governmental performance.
- Consistent: The same metrics should be measured regularly to determine trends.
- Useful: Performance metrics should be tailored to inform management at each level of government, including line staff, managers, agency heads, and the executive. Data collected should reflect accurately the key program elements at the right accountability level. A line supervisor will need data pertaining to performance for his or her functional area; the agency head will need data on all of the agency’s functions. Collecting data that lacks a functional purpose or that does not inform program performance distracts from useful tasks and wastes resources. At the top level, the right metrics enable the executive to evaluate an administration’s achievement of policy goals, quantifying the processes of working toward those goals. Useful metrics reflect performance, inform planning and management, and allow for comparisons with similar programs in other agencies and jurisdictions.
- Feasible: Data collection should not be onerous. For example, if the State aims to measure traffic volume on a road, it should utilize mechanical vehicle counters, not assign staff to visually count the number vehicles. Since collecting data on each minute activity is not feasible, performance metrics should emphasize mission-critical programs and activities that require the most resources and have the greatest impact.
- Timely: Performance measurement data should be timely. Lagged data do not help inform contemporary decisions.
- Valid: To help guarantee the validity of performance data, oversight and auditing authority of reported performance should be granted to relevant bodies (such as the Legislature and State Comptroller) within the scope of existing authority and responsibilities.
- Public: High-level performance metrics should be publicly available to enable elected officials and the public to understand how State services are being delivered and how State resources are being expended.8 Some granular data may be used internally by management, but would have little value to the public and need not be published regularly.
Performance metrics offer data that may be used to demonstrate the process, efficiency, and effectiveness of operations, and identify areas that are exceeding, or lagging, their benchmarks. Performance metrics also facilitate comparisons among entities that offer similar services in other jurisdictions, or among entities that have similar procedures in different programs. Examples range from measuring customer waiting times for motor vehicle registration, tax submission processing times, or bridge maintenance performed.
Component #2: Management Review
Performance metrics should demonstrate the process, efficiency, and effectiveness of operations. However, measurements themselves will not lead to improvements in performance and accountability. That comes when there is an established management process that uses the data and established goals and benchmarks to review performance, identify problems and strategies to correct them, and hold managers accountable.9
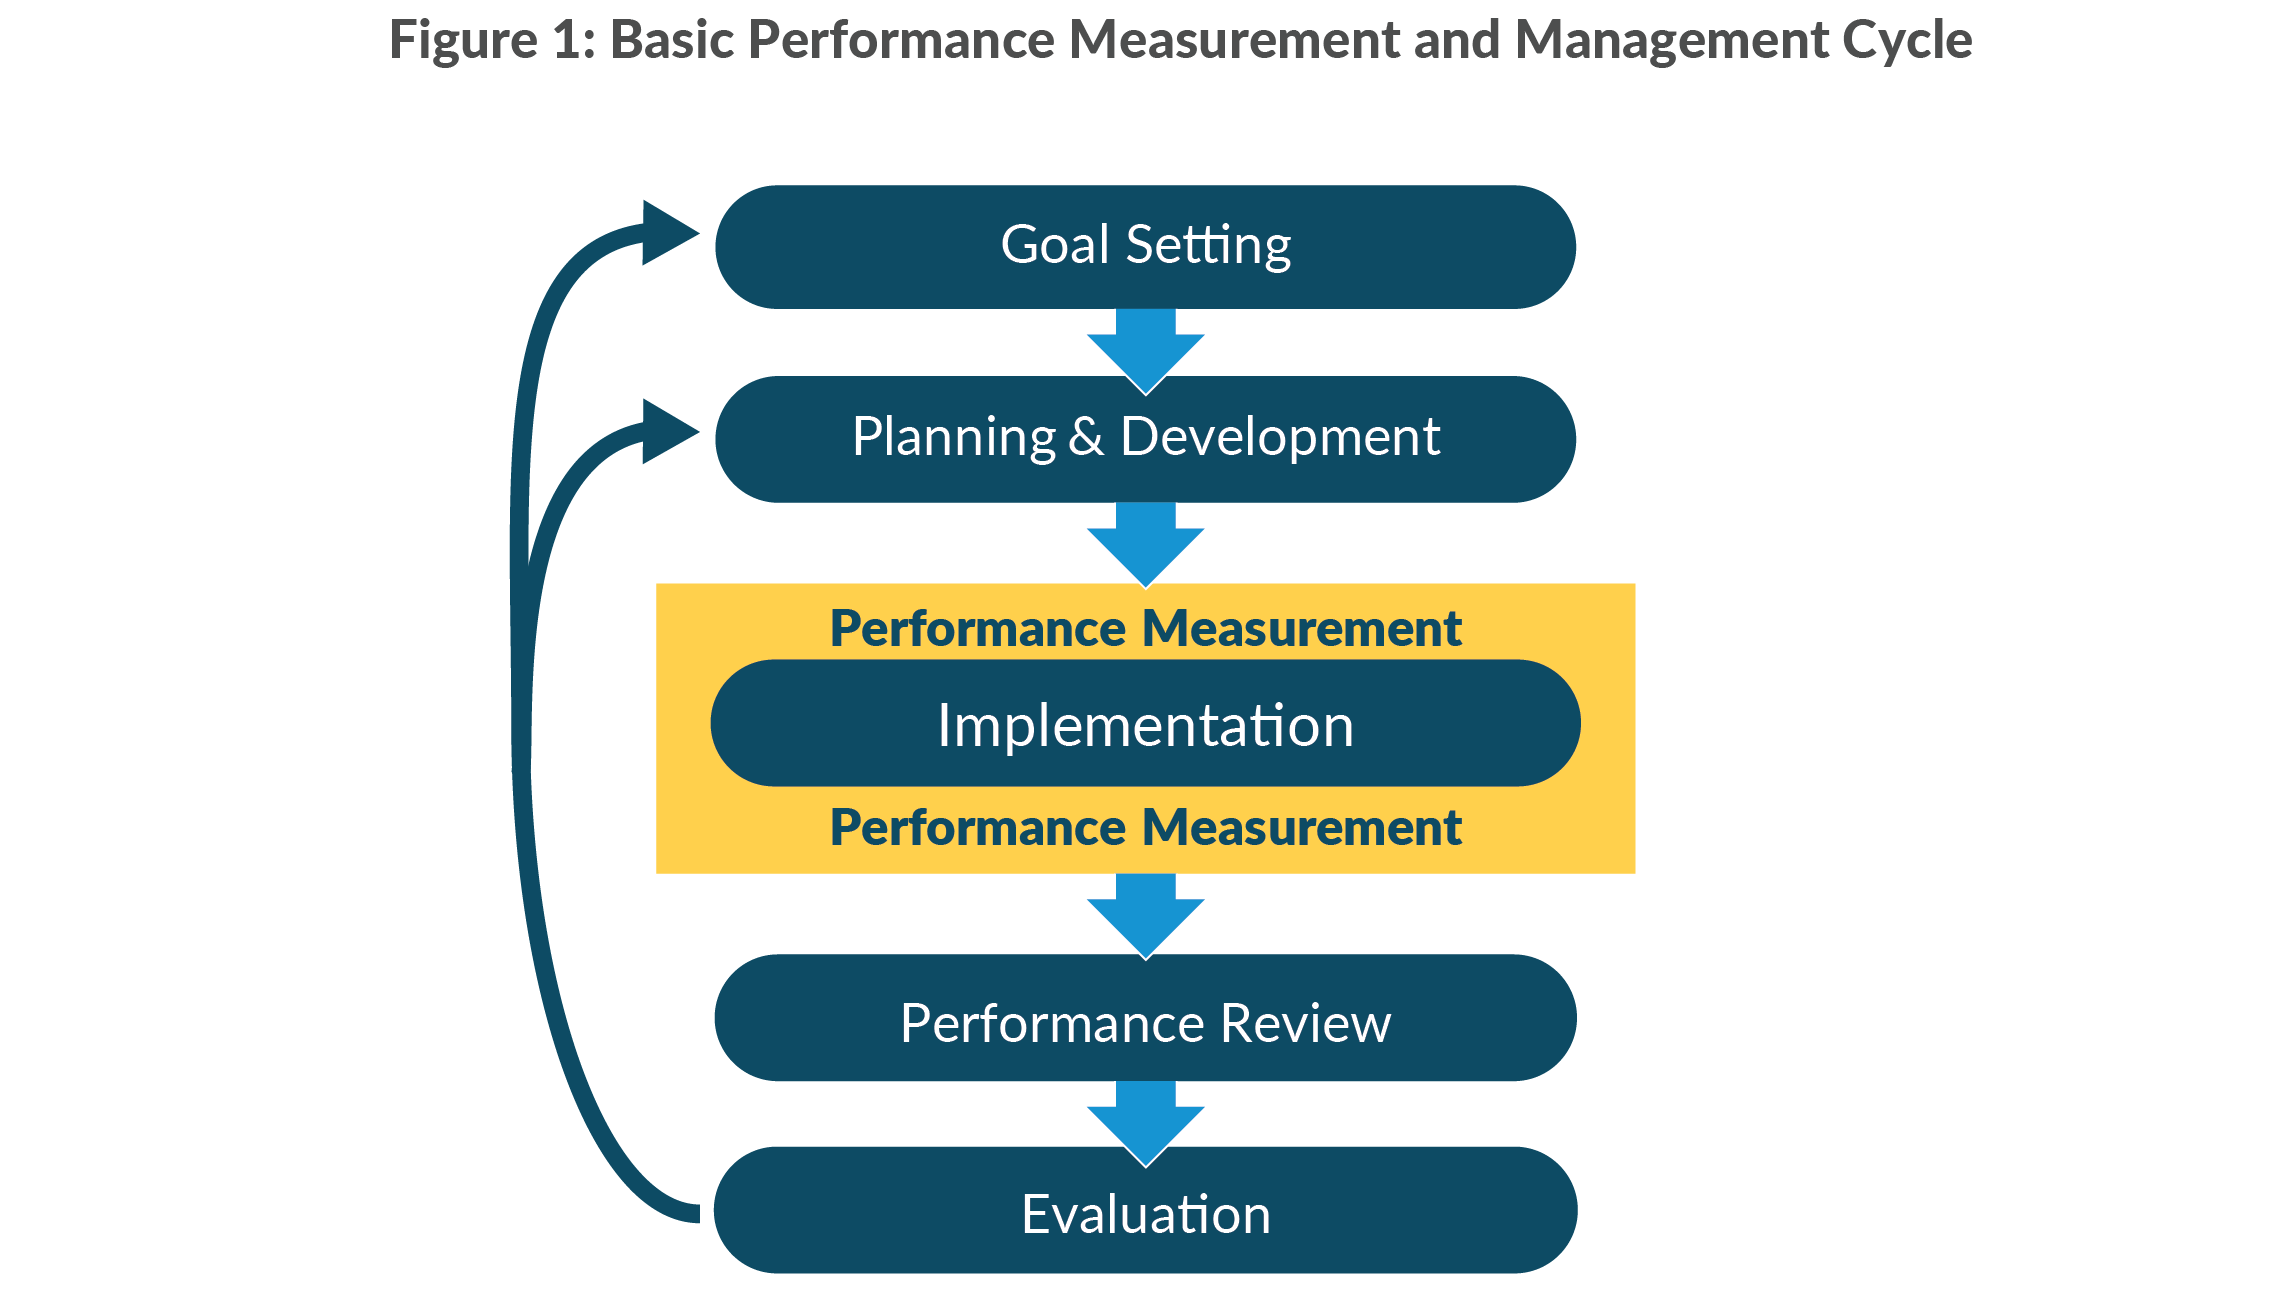
Figure 1 illustrates the management review process and its components:
- Goal-setting: Public officials set goals and priorities for public programming;
- Planning and Program Development: Leaders and managers develop plans and identify program models to achieve public policy goals;
- Implementation: Elected leaders support public policy with resources and agency managers implement planned programming.
- Program and Performance Review: The executive, agency heads, managers, and line staff hold regular periodic reviews to discuss performance based on experience and performance data collected throughout implementation.
- Evaluation: Public officials use the findings of performance review to develop management actions to improve performance. Management may adjust goals based on these findings and/or develop plans to implement selected actions.
Management relies on consistent and repeated assessment. Successful performance management requires participation throughout the administrative hierarchy—from the chief executive through agency heads, managers, and line staff.10 Managers and their supervisors should review the performance measurements together to identify shortcomings and successes, enhancements to improve overall program performance, and identify and develop solutions to performance deficiencies.11 Corrective actions identified in the process require consistent follow-up to ensure implementation, to evaluate the effect of identified solutions, and to adjust the actions as needed to address changing conditions.
BEST PRACTICES FROM OTHER STATES
Examining performance management systems in four states revealed commonalities in their development and implementation: Colorado’s State Measurement for Accountable, Responsive, and Transparent Government (“SMART”) Act system, Maryland’s “Managing for Results,” and “StateStat,” Virginia’s “Virginia Performs,” and Washington’s “Results Washington.”12 These systems are described in detail in Appendix B of this report. These states’ experiences offer four important considerations:
- Performance management systems often emerge from political change. The four states implemented their systems at the start of new gubernatorial administrations. Colorado’s system was enacted by the legislature in 2010 in response to fiscal stresses from the recession and immediately prior to the start of Governor John Hickenlooper’s first term. Governor Hickenlooper led the system’s implementation and recommended statutory amendments to the system’s design that were subsequently enacted. Maryland’s “StateStat” launched as a variation of CitiStat, a performance management system led by Governor Martin O’Malley during his preceding tenure as Mayor of Baltimore. “StateStat” was succeeded by “Managing for Results” with change of gubernatorial administration to Governor Larry Hogan. “Virginia Performs” was implemented by Governor Tim Kaine at the beginning of his term, and built on the work of the Council on Virginia’s Future, an advisory body convened in the first year of former Governor Mark Warner’s administration. “Results Washington” was created by executive order in Governor Jay Inslee’s first year in office.
These four experiences indicate that performance management systems are often initiated by new gubernatorial administrations, but ongoing administrations—particularly as they seek to leverage the success of their initiatives—can also drive the implementation of performance management to better manage resource allocations and spending priorities. On the other hand, the impact of administrative change can also result in a performance management system being diminished or eliminated. The requirement to establish and maintain a performance management system should be adopted in statute to assure that changing administrations will not eliminate a useful management tool.
- Systems are characterized by central responsibility and links to budgeting. Performance management functions are administered by a single responsible office, and often are linked to budgeting functions. In Colorado, the Lieutenant Governor functions as a central operating officer for the state and oversees its performance management system. In Maryland and Virginia, responsibility for performance management is housed within each state’s budget department. Washington is somewhat different; Washington’s Office of Financial Management has a role in performance reporting as part of the budget process, but Results Washington is a distinct function.
Relating program budgets to performance management allows for evaluation of programs’ efficiency and value. In all four states, budget offices use their systems for performance budgeting. Whether in the budget office or as a separate entity, linking performance management to budget functions offers a broad view of government operations as budget divisions interact with every agency and conduct cyclical work.
- Measurement must be actively linked with management to yield improvement. The case studies show differing approaches to linking measurement and management.13 Only Colorado has current statutory requirements linking measurement and management. In addition to quarterly reviews, Colorado’s agency heads and the Lieutenant Governor present performance plans to the legislature at least once per year. In Maryland, a regular, public system of meetings among multiple levels of staff was common practice until a change of gubernatorial administration diminished the process, which was possible since regular reviews were not required under state law. Quarterly progress updates are required under Virginia's system, and agency reviews are conducted with the Department of Planning and Budget through strategic planning and regular progress reports, but many of the statutory requirements of Virginia’s system have expired.14 Results Washington includes regular meetings to discuss performance. Results Washington previously tracked 200 various indicators; Governor Inslee modified the system to track 20 key program outcome measurements.
- Implementation requires investment. Implementing a performance management system requires initial investments and ongoing resources. Staff throughout the entire hierarchy should be involved, and training improves the effectiveness of the performance management system. Colorado, for example, offers an annual “Performance Management Academy.” The training program educates staff on performance management topics ranging from problem identification to performance management in action. Trained employees in Colorado report increases in competencies with performance management and recommend that their colleagues also take the training.15 Still, the relatively modest investments of staff time and fiscal resources for an appropriate system should be justified by vast improvements in transparency, accountability, and performance.
ILLUSTRATING THE POTENTIAL OF PERFORMANCE MANAGEMENT IN NEW YORK STATE
Past Efforts
Statewide performance management is not a new idea in New York State. The Key Item Reporting System (KIRS) was enacted during the tenure of Governor Hugh Carey in 1981.16 KIRS was implemented shortly thereafter under Governor Mario Cuomo. The Executive selected the agencies to be included in the KIRS system, but the effort was short-lived as agencies criticized the legislative requirements.17 The statute authorizing KIRS was repealed as part of broader budget reform legislation in 1992.18
Governor Andrew Cuomo’s 2011 Spending and Government Efficiency Commission (SAGE) Commission included experts from government and the private sector who were tasked to provide recommendations to “modernize and right-size state government, improve performance, increase accountability and save taxpayers' money.”19 In early 2013 the Commission recommended a three-part strategy to achieve that goal: reorganize government, reduce costs and improve service, and build a culture of performance and accountability.20
The SAGE Commission recommended the State develop and implement a performance management system. The SAGE report included screenshots of a sample performance data portal and projected that the first State agencies could implement fully NYPerforms before the end of 2013.21 CBC highlighted NYPerforms as “perhaps the most important, potentially transformative” recommendation of the SAGE Commission.22
Despite successful implementation of many of the SAGE Commission’s other recommendations and the view that NYPerforms could be operational for some agencies in less than a year, no comprehensive performance management system exists six years later.23 In 2018 the Division of the Budget (DOB) issued a guidance bulletin requesting certain agencies begin strategic planning and developing a performance review process. The guidance required many of the attributes of a comprehensive performance management system. Agencies were asked to set a mission, identify goals, and communicate how performance would be measured. The process would be directed by DOB and would inform budget-making decisions.24 The budget briefing book that accompanied the fiscal year 2020 Executive Budget proposal further expanded on the concept. The briefing book describes aspects of the intended performance management process and highlights positive performance indicators.25 Similarly, the Fiscal Year 2021 Executive Budget briefing book discusses the implementation of performance management. To date the system has many shortcomings:
Lack of Utility
Executive Budget briefing books serve as the source for description and dissemination of performance data associated with the DOB system. For example, the briefing book’s “Performance Profiles” for each subject area “highlight agency programs and achievements.”26 The Performance Profile related to transportation lists four panels with the following information: (1) the amount of funding contributed by the State to the Metropolitan Transportation Authority capital plan; (2) the amount of funding proposed for the two-year Department of Transportation (DOT) capital program; (3) the amount of funding within the DOT capital program for a new round of upstate airport projects; and (4) a benchmark date for implementation of cashless tolling on the Thruway system.27 The first three items have little value; they present planned inputs which are each already presented in greater detail in financial plan documents. The fourth panel is partially useful, presenting a target timeframe for implementation of a new initiative. To align with those best practices previously outlined in this report, the briefing book should present a portfolio of performance metrics measured relative to goals, reported consistently, and presented so can be used to inform decisions by elected officials and agency management by tying spending to results.
Lack of Comprehensiveness
The SAGE Commission recommended that NYPerforms include both State agencies and authorities. DOB’s 2018 guidance included 57 agencies and authorities but excluded major agencies and authorities such as the State Department of Education, the Metropolitan Transportation Authority (MTA), and the New York State Thruway Authority.28 These entities directly affect both the State’s overall fiscal and policy priorities, as well as those of related agencies and authorities. Moreover, the SAGE report explicitly mentioned transportation authorities, stating, “Including both agencies and authorities in a statewide performance management system will help to address a major obstacle to improving performance and increasing accountability – the lack of visibility into the operations of State authorities. Because agencies and authorities often work in the same functional area (for example, transportation), this lack of visibility makes it difficult to present an integrated view of the operations and performance of State government.”29
Lack of Transparency
The SAGE Commission recommended public disclosure of high-level agency information and performance data. The Commission’s report included snapshots of the proposed information that it recommended be available for public view.30 The data outlined in the 2018 DOB bulletin are being compiled and used for internal decision-making; however, none of the data have been made public.31 Making performance data publicly available for major initiatives as the DOB guidance bulletin outlines is necessary to increase transparency and accountability.
Lack of Statutory Provisions
Colorado, Maryland, Virginia, and Washington implemented performance management systems at the start of new administrations and through statute or executive order. The SAGE Commission report and the DOB framework are administrative documents advanced by administrative prerogative. Absent statutory requirements, the program outlined in the DOB memo and Executive Budget may not continue to be implemented and could easily be diminished or terminated. To be most effective, a more complete system should be supported by the Legislature and codified in statute.
Currently Available Data and Management Systems
The State should leverage its existing financial and programmatic data to build its performance management system. DOB has data on disbursements on individual programs and general government operations carried out by the State workforce. The data is compiled and reported in the State’s Financial Plan, Capital Program and Financing Plan, budgetary appropriations and program legislation, Open Budget, and the Statewide Financial System.
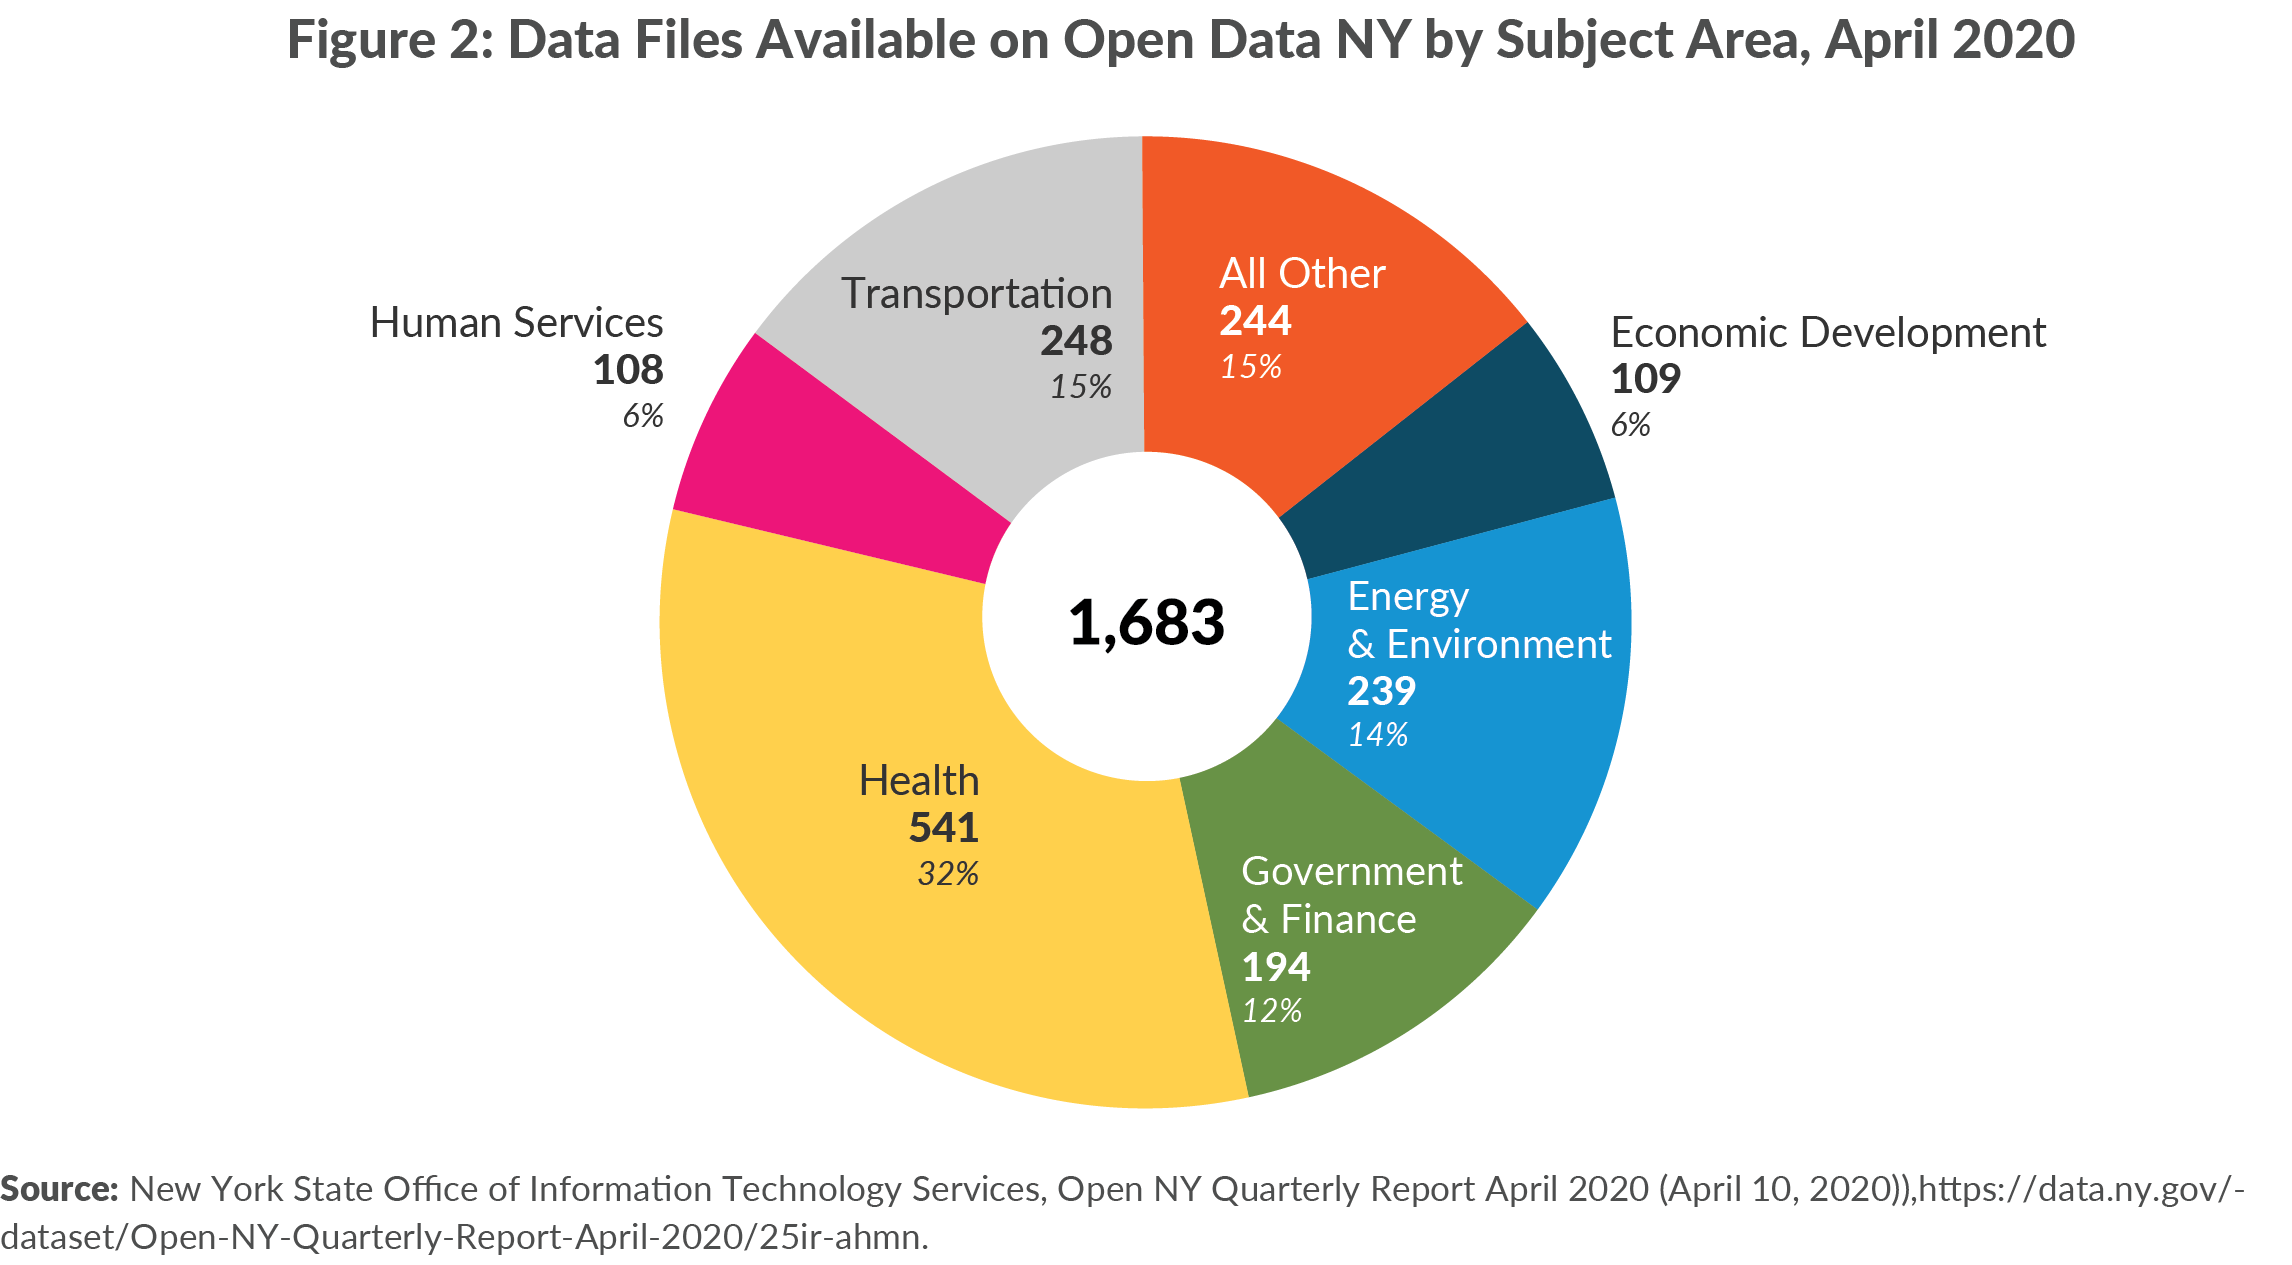
Other publicly available data cover some of the processes, outputs, and outcomes of State government. New York State launched the Open Data NY portal in March 2013 in accordance with the Governor’s Executive Order 95.32 When the portal launched, 244 data files were available. As of April 2020, there are 1,683 data files in its catalog, including open data provided by local governments.33 The catalogued data cover a broad range of topics, with the largest share of data related to health. Certain COVID-19 data are included on the portal, with six files from New York City government and one dataset on testing outcomes from the New York State Department of Health. (See Figure 2.)
The portal includes some helpful data on process, such as Department of Motor Vehicles’ data on the issuance of traffic tickets. The portal also includes relevant output data, such as the number of meals funded by the New York State Office of the Aging and some outcome data, such as recidivism in the criminal justice system. Alternately, some of the available data may be of interest to some members of the public but is not useful for measuring State government performance, such as past winning lottery numbers.34
Other performance data is available from individual agencies outside of the Open Data NY portal. For example, data on the condition of pavement on the State’s roadways is not available in the portal but is available on the Department of Transportation’s website.35
In addition to the useful available performance data, there are some existing examples of performance management. The Business Services Center operated by the New York State Office of General Services (OGS) is one successful example. In 2012 OGS launched the Business Services Center (BSC), a subdivision charged with unifying and improving procurement, human resources, and other functions.36 The BSC was quickly successful in improving performance related to its core functions. The BSC reduced transaction times, and interest costs to the State, and saved an estimated $34 million in workforce costs at State agencies in its first four years of operation.37
While the BSC provides an example of performance management in State workforce operations, the Department of Health’s (DOH) management of tobacco control programs offers an example of successful performance management in a grant-based portfolio. DOH sets regular goals related to reducing tobacco use, secondhand smoke exposure, and increasing access to cessation services. The agency regularly evaluates progress toward those goals, and tailors tobacco control programs as needed. In addition to internal measurement and management, DOH contracts for independent evaluations of its efforts. The evaluation strategy is required by State law and informed by a State advisory council on tobacco policy and by federal standards for evaluation. The success of tobacco control performance management illustrates that State agencies have the experience and capacity to execute performance management when required.38
Potential Application of Performance Management
Successful performance management systems’ characteristics can be illustrated with an example applied to maternal care programs currently administered by the New York State Department of Health (DOH). DOH’s maternal care goal is “to improve the health of under-served women, infants and children through improved access to and enhanced utilization of perinatal and prenatal care and related services." The State operates a multi-lingual hotline for expecting and new parents, promotes best practices in clinical care by providers, and provides education on postnatal care. DOH states that these strategies have helped New York State reduce infant mortality rates by 34 percent in the past decade.39
The State’s maternal care programs have the beginnings of a framework for comprehensive performance management. There is a codified goal with identified strategies implemented by DOH. These are positive steps, but much more can be done to improve performance management by developing performance metrics, collecting data, benchmarking against past results; analyzing the outcomes of various initiatives could enable DOH to reduce mortality rates further by focusing resources on the strategies that have proven to be most effective. Figure 3 lists sample metrics for each programmatic stage.
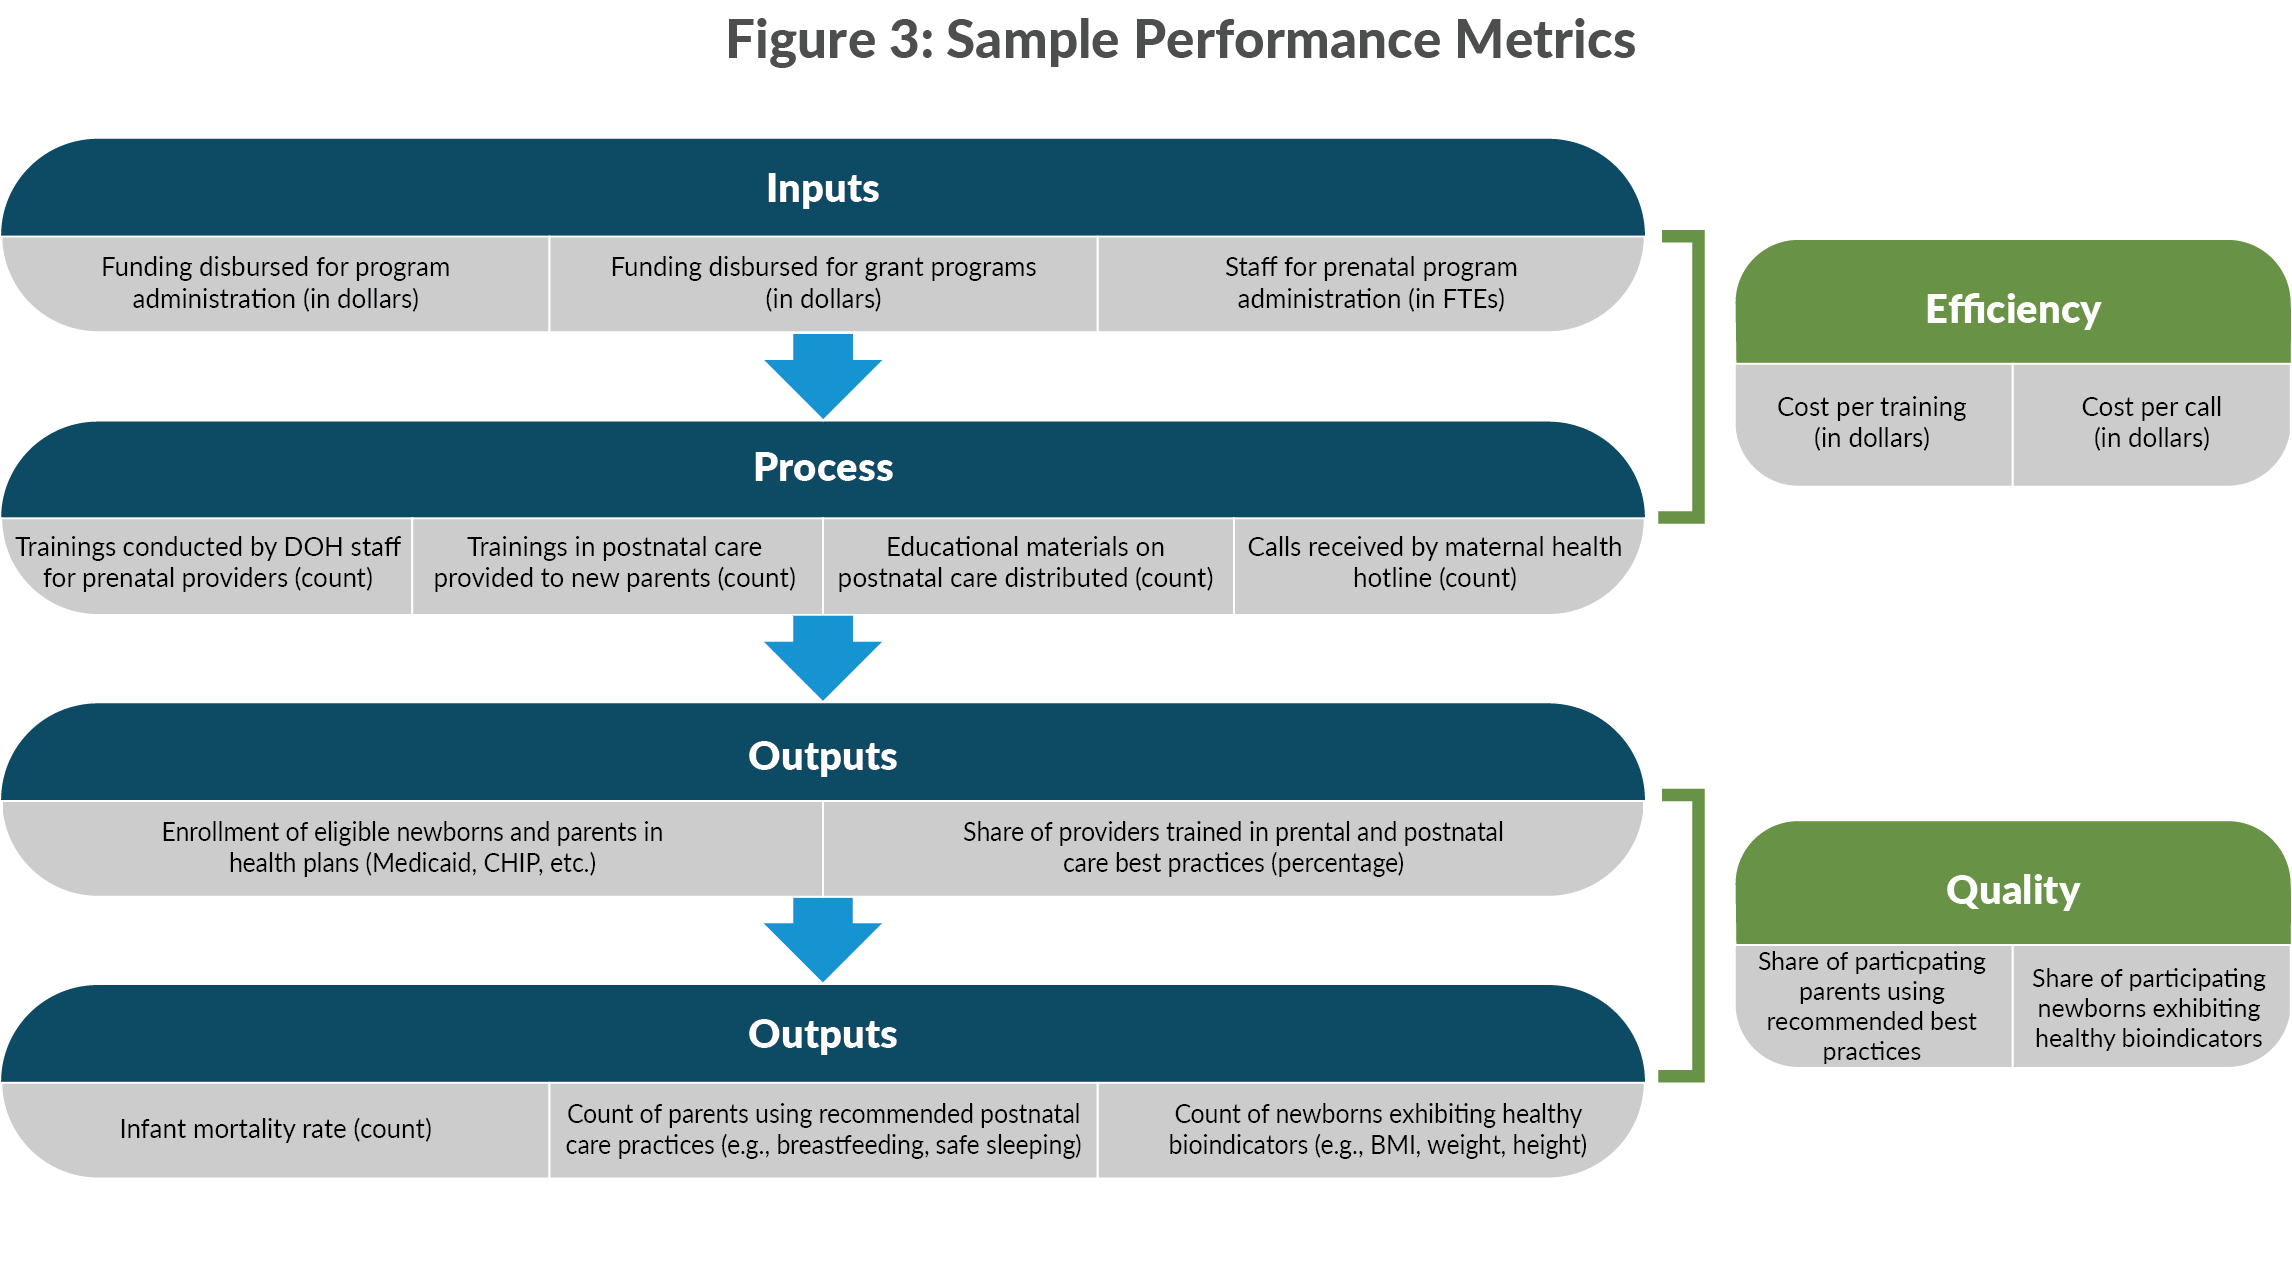
The sample metrics presented in Figure 3 would allow the State to evaluate its programs for maternal care on an ongoing basis. Unit costs of programs could be determined, and the reach of programs assessed. Importantly, program outcomes could be compared to programs in other states. Cross-sectional comparisons will reflect ways that the program can be better targeted on geographic and demographic bases.
In this example, the public would benefit from improved transparency in government performance. Public administrators would benefit from a robust, repeated process of measuring and managing performance. Elected leaders would benefit from having information to better direct resources to achieve the goal of reducing infant mortality.
This example is possible because the State has a stated goal for maternal health programming. While many areas of government lack this level of planning and transparency, implementing performance management would improve government performance by institutionalizing program goal setting, benchmarking, data gathering, and resource measurement to inform agency managers.
RECOMMENDATIONS
CBC recommends the State follow the SAGE Commission recommendations and other states’ best practices to implement a performance management system that:
- Identifies key agency and authority programs and establishes output and outcome goals for each program;
- Identifies metrics for each program, including input (such as staffing and resources), process, output, outcome, quality, and efficiency measures;
- Establishes performance targets for each program’s outputs, outcomes, quality, and efficiency;
- Establishes implementation benchmarks for new initiatives;
- Identifies risks and pressures to State programs from adverse shocks such as natural disasters or economic downturns;
- Institutes a management and accountability process to review metrics and incorporate findings into ongoing management;
- Allows for oversight and auditing of data;
- Links to the budget cycle to inform budget and policy decisions for elected officials, agency administrators, and staff;
- Provides public information about agency, authority and program performance that is accessible, readily understood, and provides quantitative measurements of service delivery efficiency, cost, and quality; and
- Is established through statutory provisions that promote consistency in reporting across agencies, authorities, and administrations.
CONCLUSION
New York State’s response to the COVID-19 pandemic has highlighted the usefulness of performance management and the value of implementing it across all agencies and authorities in State government. The State has proven capable of nimbly compiling and reporting much of the relevant data, and New Yorkers have benefitted from and appreciated the transparency. As the Governor’s response to the pandemic has shown, policy decisions are better informed using a data-driven, systematic approach.
State leaders should look beyond the pandemic to implement a complete, transparent performance management system. The continued failure to implement this system perpetuates a vacuum of accountability within State government. Creating the system will require an investment of fiscal and human resources that will yield long-term benefits. This framework is especially important as the State confronts the pandemic’s economic impacts. Lawmakers, managers, and the public will benefit from important data points for managing in an environment of fiscal stress.
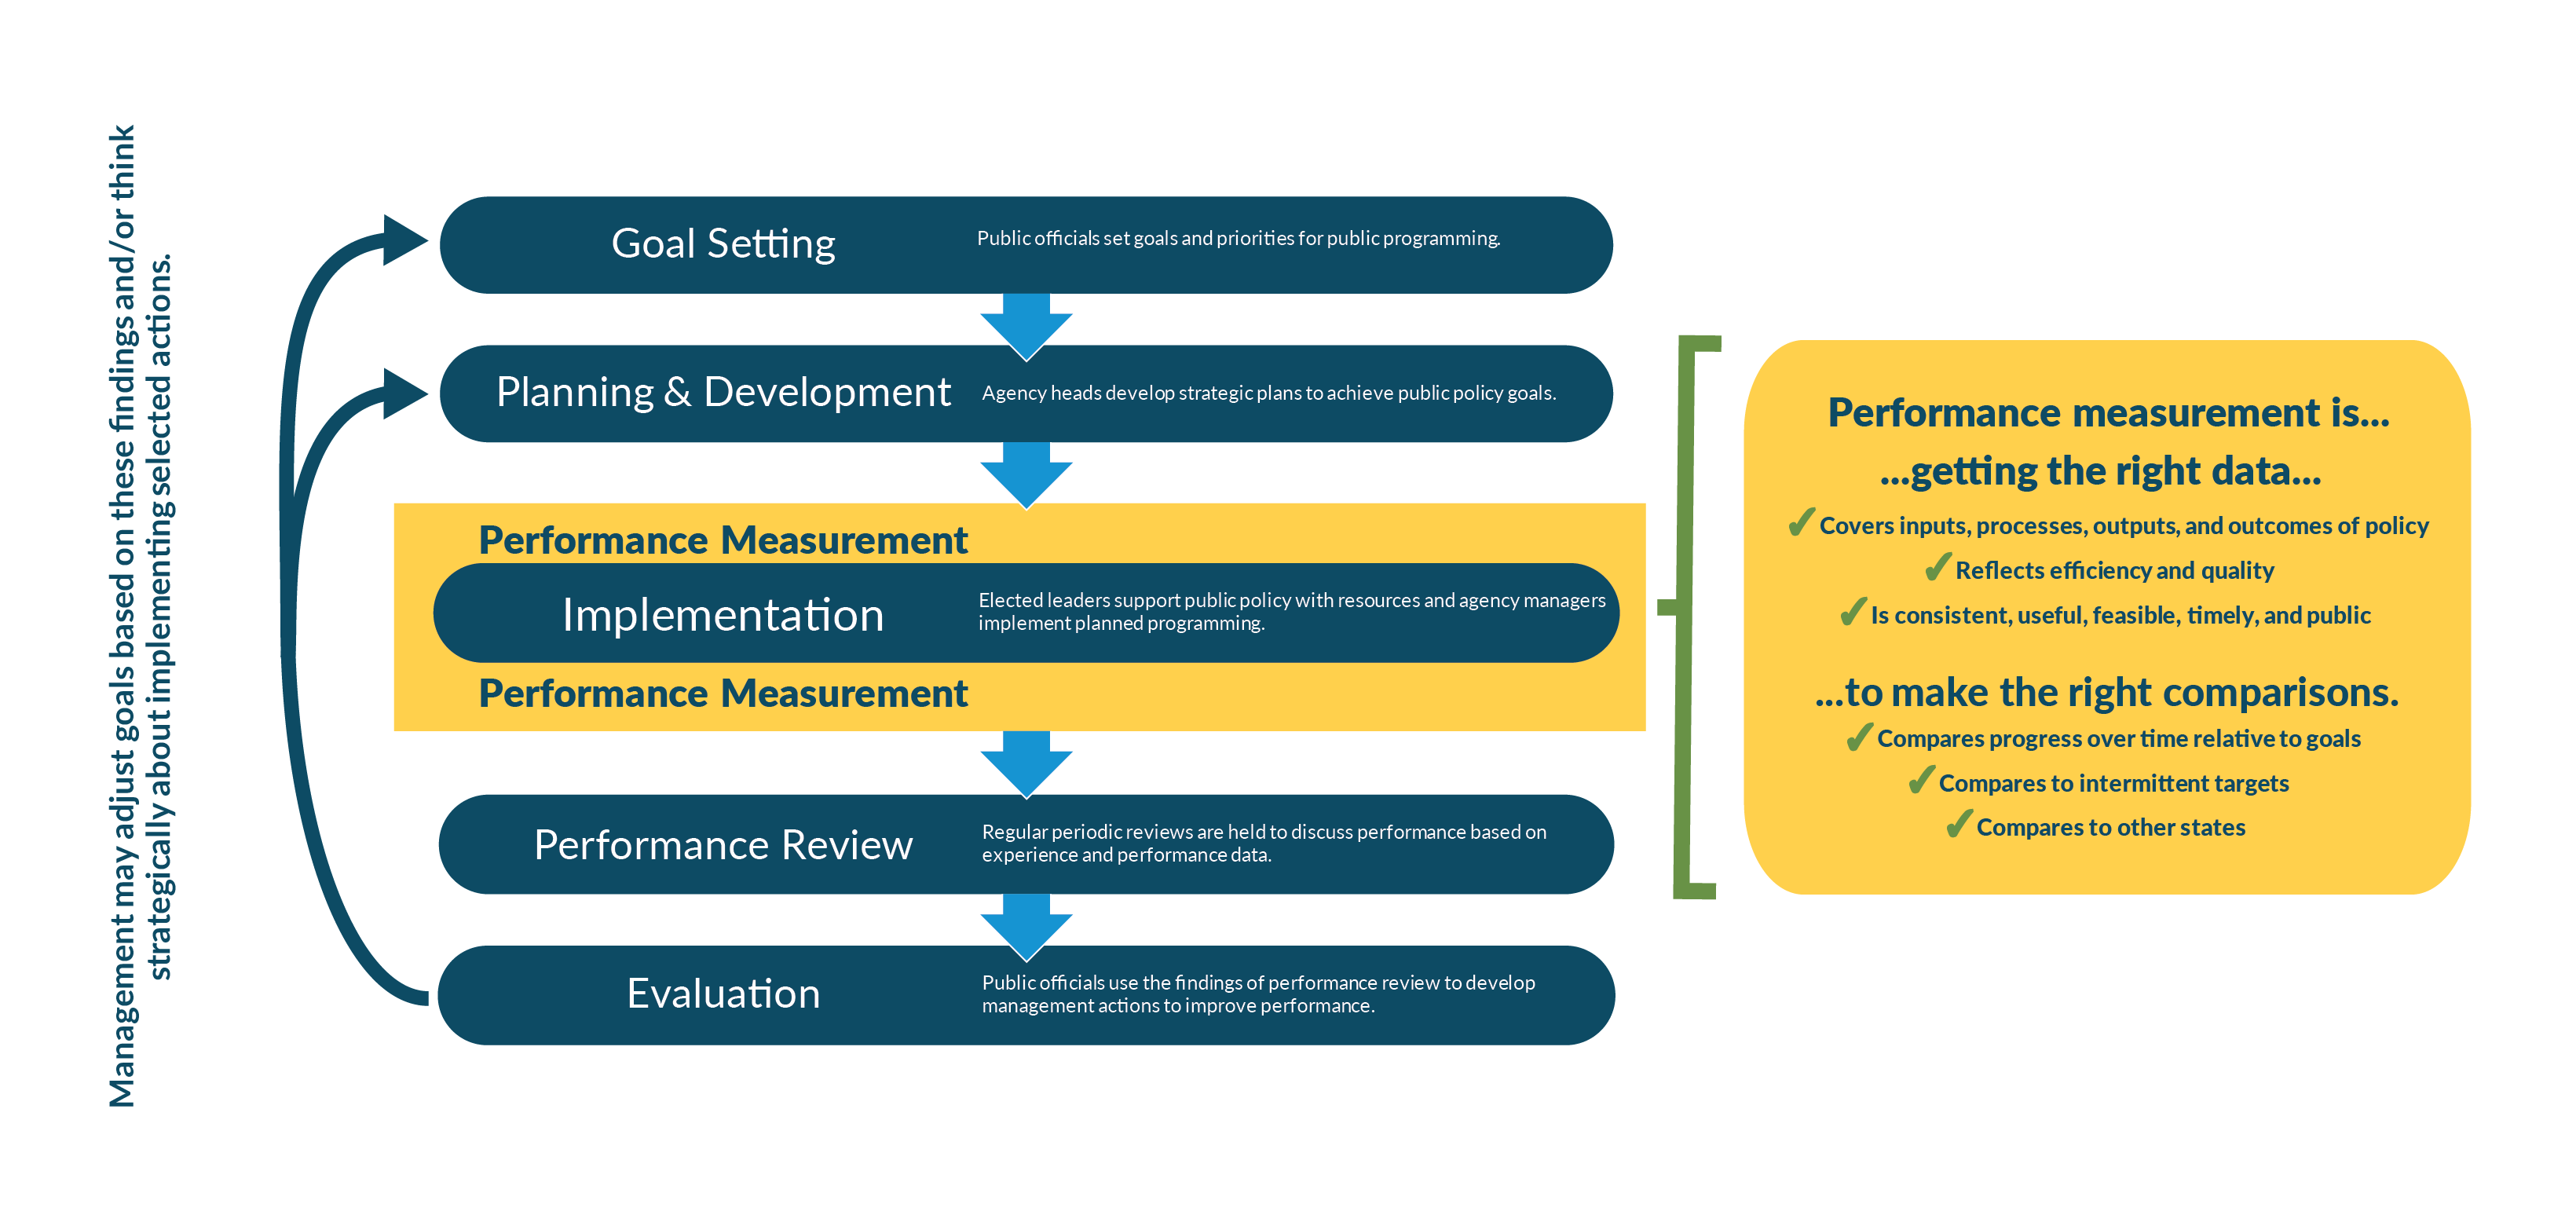
Appendix A: Basic Performance Measurement and Management Cycle (Expanded)
Appendix B: Summary of Performance Measurement Systems in Select States
| STATE | DESCRIPTION | PERFORMANCE MEASUREMENT EXAMPLE | POSITIVE COMPONENTS | POTENTIAL IMPROVEMENTS |
|---|---|---|---|---|
| COLORADO | Colorado's performance management system was first required by state legislation in 2010 with the State Measurements for Accountable, Responsive, and Transparent Government (SMART) Act. The SMART Act was driven by the state's legislators, seeking better information to make budgetary decisions in the aftermath of the Great Recession. The legislation required development of strategic plans by agencies and goal-setting. It created links between agencies and legislative budget functions, with legislators and staff to serve as liaisons. Agencies were required to submit annual strategic plans to the legislature, which then had an opportunity to offer comments and recommendations related to the plans. However, implementation of SMART was incomplete. Staff were untrained in how to develop performance management reports, timing of legislative hearings was suboptimal, and information was not publicly accessible. The SMART Act was overhauled in 2013, authorizing training of staff, giving oversight authority to the Office of State Planning and Budgeting, and normalizing performance reviews. Now, all agencies create strategic plans on an annual basis. The legislature has an opportunity to review those plans, and to hold hearings to speak directly with the Lieutenant Governor (who serves as the chief operating officer). A performance dashboard presents the most important performance metrics and targets. Annual performance plans and quarterly reviews for each agency are catalogued. Colorado offers performance management training to staff through the "Performance Management Academy." | Colorado's Department of Transportation has a slate of goals aimed at expanding modal transportation options to reduce vehicle miles traveled and improve environmental impacts. There are eight metrics related to that strategic goal, such as reducing per capita vehicle miles traveled and greenhouse gas emissions from transportation by 1 percent annually. |
|
The State's current performance dashboard is simply organized, but lacks trend data and valuable context for the public. Performance data is organized into four broad programmatic buckets, and only high-level metrics are posted. Data is generally timely and regularly updated. However, only current year results are presented on the dashboard. Some metrics are also presented without useful context, diminishing their value when viewed in isolation. Performance plans also lack retrospective trend data and are not formatted consistently across agencies. |
| MARYLAND | Maryland's primary performance management system is implemented through the Managing for Results (MFR) process. MFR is set forth in Maryland state law, and is defined as, "a planning, performance measurement, and budgeting process that emphasizes use of resources to achieve measurable results, accountability, efficiency, and continuous improvement in State government programs." The process requires agencies to create annual comprehensive plans with performance goals, and to measure performance relative to those goals. An annual MFR report is provided to the legislature and the public in January of each year. The MFR report includes a narrative of performance results on a Statewide basis, and individual agencies compile more specific trend data for performance metrics. Maryland law further creates the StateStat program to serve as an accountability check. StateStat is modelled on the CityStat model implemented in Baltimore (which was based on ComStat from the New York City Police Department). StateStat created the process by which agency heads coordinated implementation of improved performance. StateStat was ostensibly replaced by the Governor’s Office of Performance Improvement (GOPI) in 2015. GOPI was created via Executive Order following a change in gubernatorial administrations, but continues the function to serve as a coordinating office for performance. Most MFR functions are managed by the state Department of Budget and Management. | Maryland set a goal of increasing kindergarten readiness. The goal was set during the 2014-15 school year to increase in each subsequent year. In 2014-15 the rate of kindergarten readiness was 47 percent. In each year since then, the rate was below 47 percent. Maryland also reports other metrics related to the performance goals set in each department. There are 9 additional metric reported related to the goal of increasing kindergarten readiness, but targets are not listed for those metrics. |
|
StateStat utilized regular meetings between central staff and agency heads to discuss performance, a foundational tenet that has been reduced under GOPI. |
| VIRGINIA | Virginia launched the Virginia Performs system in 2007. Virginia Performs was developed and originally implemented by the Council on Virginia's Future (CVF). The CVF was created legislatively in 2003 with responsibility for developing long-term planning, budgeting, performance management, and continuous improvement process. CVF found that existing strategic planning at Virginia's agencies was inconsistent. Virginia Performs aligned performance measurement and management across the State's agencies. The CVF sunset in 2017, but Virginia's performance management systems include two main outputs: The Virginia Performs Scorecard and the Strategic Plan process. Both components are now managed by the Department of Planning and Budgeting (DPB). The Virginia Performs Scorecard is a basic, high-level annual summary of selected metrics that measure Virginia's performance in seven categories (economy, education, health and family, public safety, transportation, natural resources, and government and citizens). Each category has four to eight metrics, with 44 total metrics reported. Virginia Performs annually updates the Scorecard with relevant data, and reports the Scorecard on its website along with a description of the metric's importance and trend. The Strategic Plan process is more specific. With each biennial budget, each agency creates a strategic plan. The Strategic Plan outlines the agency's mission, financial overview, objectives, and other information. Importantly, each objective contains metrics by which objectives will be measured. Data related to each of these metrics is reported by the DPB. Trend data and targets reported in the DPB portal are available for 85 agencies and 808 metrics. | The Virginia Department of Motor Vehicles includes in its strategic plan an objective to "provide our customers with service in a method and location that meets their needs in a timely and effective manner." Success toward this goal is measured based on four metrics (average wait time using DMV Direct services, average wait time in Customer Service Centers, number of transactions performed, and the percentage of transactions conducted through preferred services). DPB reports the data in its public portal. The average wait time for DMV Direct services is reported in minutes and seconds from 2006 through 2018. The portal also includes goals for each metric. The current wait time is 13 minutes 14 seconds. The DMV targets to keep wait times below 15 minutes through 2020 and decrease wait time to 10 minutes by 2022. |
|
|
| WASHINGTON | The current statewide performance management system, Results Washington launched in 2013. Created by executive order by Governor Jay Inslee, Results Washington is organized around five general goals related to education, the economy, the environment, health and safety, and general government accountability. The system also includes data on a current governmental initiative: addressing the opioid crisis. Each of the major goal categories is divided into subcomponents or strategies. For example, the goal of providing a world class education to Washingtonians is divided into kindergarten readiness, economic security, effectiveness of the K-12 system, access to living wage jobs, retirement security, and young adult engagement. The outcomes of each of these educational subcomponents is measured on a selected group of performance measurements. Archived data on each of these metrics dating back to the launch of Results Washington is available on the website. Monthly meetings are also held, known as Results Reviews, during which one or more agencies presents regarding goals and progress toward those goals in greater depth. Results Reviews offer an opportunity for conversational assessment of the work of State agencies and programs toward Washington’s goals, including direct involvement by Governor Inslee. Results Reviews presentations and video recordings are archived and publicly available. The Office of Financial Management also reports performance data as part of the state's performance budgeting process. | Kindergarten readiness, for example, is assessed in terms of pre-k readiness assessments for incoming students, availability of preschool enrollment slots, volume of home visiting services, and ratings of preschool service providers. Pre-kindergarten readiness in 2014 was measured at 41 percent. Washington set a goal to increase performance on that metric by 2 percent each year thereafter, achieving 45 percent readiness by 2016. Actual performance toward this goal nearly achieved the target, rising to just above 44 percent in 2016. |
|
|
Sources (General): National Performance Management Advisory Commission, A Performance Management Framework for State and Local Government: From Measurement and Reporting to Management and Improving (June 2010), pp. 48-50, www.nasact.org/files/News_and_Publications/White_Papers_Reports/2010_06_01_NASACT_GFOA_A_Performance_Management_Framework.pdf.
Sources (Colorado): Colorado Department of Transportation, "FY2020 Performance Plan - Quarter 1 Evaluation" (accessed November 26, 2019), https://drive.google.com/file/d/17-F2OYm67BXQVT7X_51KoAsHlccJRtIL/view; Harvard John F. Kennedy School of Government, "The Government Performance Lab at Harvard Kennedy School Awards Technical Assistance to the State of Colorado" (November 21, 2017), www.hks.harvard.edu/announcements/government-performance-lab-harvard-kennedy-school-awards-technical-assistance-state; "Performance Management Academy" (accessed November 26, 2019), www.innovations.harvard.edu/performance-management-academy; National Lieutenant Governors Association, Colorado Office of Lt. Governor Statutory Duties (October 20, 2016), www.nlga.us/wp-content/uploads/COLORADO2.pdf; Pew Trusts, Colorado Dives Into Evidence-Based Policymaking (Issue Brief, December 2018), www.pewtrusts.org/-/media/assets/2018/12/results_first_co_dives_into_evidence-based_policymaking_issue_brief_v1.pdf; State of Colorado, "'SMART' Act" (accessed November 26, 2019), www.sos.state.co.us/pubs/newsRoom/SMART-Act/index.html; "Talent Development" (accessed November 26, 2019), https://operations.colorado.gov/talent-development; "Governor's Dashboard" (accessed November 26, 2019), https://dashboard.state.co.us/default.htm; "CDHS Performance Management Academy" (accessed November 26, 2019), www.colorado.gov/pacific/cdhs/performance-academy; and University of Denver Colorado Evaluation and Action Lab, Institutionalizing Performance: Colorado’s SMART Government Act (November 2019), https://coloradolab.org/wp-content/uploads/2019/11/Report-3-SMART-Government-Act.11.1.19.pdf.
Sources (Maryland): Maryland Department of Budget and Management, "From Measurement and Reporting to Management and Improving" (accessed August 25, 2019), https://dbm.maryland.gov/Pages/ManagingResultsMaryland.aspx; Managing for Results Annual Performance Report (January 2019), https://dbm.maryland.gov/Documents/MFR_documents/2019-MFR-Annual-Performance-Report.pdf; The State of Maryland Executive Department, Executive Order 01.01.2015.26 (January 2015), https://governor.maryland.gov/wp-content/uploads/2016/02/01.01.2015.26.pdf; Governor's Office of Performance Improvement, "About GOPI" (accessed August 25, 2019), https://gopi.maryland.gov/about-gopi/; Maryland State Finance and Procurement Law §3-1001; and J.B. Wogan, "How Stat Got Stuck -- in the Place That Made It Famous" (Governing, April 2017), www.governing.com/topics/mgmt/gov-baltimore-citistat-statestat-maryland.html; Jane Kusiak, Council on Virginia's Future (Virginia Institute of Government, Fall 2005), https://vig.coopercenter.org/sites/vig/files/thecolumn_fall2005.pdf.
Sources (Virginia): Virginia Department of Planning of Budget, Agency Planning Handbook (May 13, 2019), https://dpb.virginia.gov/sp/Agency%20Planning%20Handbook_2018-2020_May2019Update.pdf?Submit=Agency+Handbook; "Performance Management Overview" (accessed August 25, 2019), https://dpb.virginia.gov/sp/Overview.cfm; "State Agency Planning and Performance Measures" (accessed August 25, 2019), http://dpb.virginia.gov/sp/sp.cfm; Virginia Performs, "Scorecard at a Glance" (accessed August 25, 2019), http://vaperforms.virginia.gov/ScorecardatGlance.cfm; "Virginia Data Maps by Indicator Measure" (accessed August 25, 2019), http://vaperforms.virginia.gov/maps.cfm; "Measuring Virginia" (accessed August 25, 2019), http://vaperforms.virginia.gov/index.cfm; and "About Virginia Performs: Virginia's Performance Leadership and Accountability System" (accessed August 25, 2019), http://vaperforms.virginia.gov/about.cfm.
Sources (Washington): Results Washington, "Introduction to Results Washington" (accessed August 2019), https://results.wa.gov/; “Outcome Measures” (accessed December 12, 2019), https://results.wa.gov/measuring-progress/outcome-measures; "Results Washington History" (accessed August 25, 2019), https://results.wa.gov/who-we-are/our-story/results-washington-history; and Washington Office of Financial Management, "Agency Activity Inventory" (accessed August 25, 2019), www.ofm.wa.gov/budget/agency-activities-and-performance/agency-activity-inventory.
Footnotes
- Governor Andrew M. Cuomo, “New York Forward” (accessed May 26, 2020), www.governor.ny.gov/programs/new-york-forward.
- Governor Andrew M. Cuomo, “Video, Audio, Photos & Rush Transcript: Amid Ongoing COVID-19 Pandemic, Governor Cuomo Outlines Additional Guidelines for When Regions Can Re-Open” (May 4, 2020, accessed June 1, 2020), www.governor.ny.gov/news/video-audio-photos-rush-transcript-amid-ongoing-covid-19-pandemic-governor-cuomo-outlines-1.
- Siena College Research Institute, “Coronavirus Pandemic Pushes Cuomo to Record High Ratings; Voters Trust Cuomo over Trump on NY Reopening 78-16%” (press release, April 27, 2020) https://scri.siena.edu/2020/04/27/coronavirus-pandemic-pushes-cuomo-to-record-high-ratings-voters-trust-cuomo-over-trump-on-ny-reopening-78-16/.
- The “Key Item Reporting System” was enacted as part of the Accounting, Financial Reporting and Budget Accountability Act of 1981. The system was repealed with provisions of the “Quick Start” budget reforms in 1992. See: Chapter 957 of the Laws of 1981 and Chapter 762 of the Laws of 1992.
- State of New York, New York State Spending and Government Efficiency Commission Final Report (February 2013), p. 90, www.ny.gov/sites/ny.gov/files/atoms/files/SAGEReport_Final_2013.pdf.
- See: New York State Division of the Budget, Budget Bulletin L-1220 (July 26, 2018), www.budget.ny.gov/guide/bprm/l/l-1220.html.
- Government Finance Officers Association, “Performance Measures” (March 2018), www.gfoa.org/performance-measures.
- These criteria are informed by performance measure criteria recommended by the Government Finance Officers Association. See: Government Finance Officers Association, “Performance Measures” (March 2018), www.gfoa.org/performance-measures.
- National Performance Management Advisory Commission, A Performance Management Framework for State and Local Government: From Measurement and Reporting to Management and Improving (June 2010), www.nasact.org/files/News_and_Publications/White_Papers_Reports/2010_06_01_NASACT_GFOA_A_Performance_Management_Framework.pdf.
- Michael J. Mucha, A Performance Management Framework (Government Finance Officers Association, October 2009), www.gfoa.org/sites/default/files/GFR_OCT_09_51.pdf.
- National Performance Management Advisory Commission, A Performance Management Framework for State and Local Government: From Measurement and Reporting to Management and Improving (June 2010), p. 8, www.nasact.org/files/News_and_Publications/White_Papers_Reports/2010_06_01_NASACT_GFOA_A_Performance_Management_Framework.pdf.
- The four states profiled in this report do not represent an exhaustive list of states with performance management systems; they have been identified by CBC staff as best practice states. Additional states utilizing performance management in their operations are regularly highlighted in other reports. See: Pew Trusts, “Minnesota and New Mexico Demonstrate the Power of Evidence in Policymaking” (November 5, 2019), www.pewtrusts.org/en/research-and-analysis/issue-briefs/2019/11/minnesota-and-new-mexico-demonstrate-the-power-of-evidence-in-policymaking.
- Government Finance Officers Association, “Establishment of Strategic Plans” (March 2005), www.gfoa.org/establishment-strategic-plans.
- Provisions relating to the Council on Virginia’s Future and the Government Performance and Results Act enacted in Chapter 900 of the Laws of 2003 have each expired. See: §2.2-2683 and §2.2-5510 of the Code of Virginia.
- Harvard John F. Kennedy School of Government, "Performance Management Academy" (accessed November 26, 2019), www.innovations.harvard.edu/performance-management-academy.
- The New York Times, “Excerpts from Carey’s Message to the Legislature on the 1982-83 State Budget,” (January 20, 1982, accessed June 18, 2020), www.nytimes.com/1982/01/20/nyregion/excerpts-from-carey-s-message-to-legislature-on-the-1982-83-state-budget.html; and New York State Division of the Budget, Budget Summary (February 1983), p. 9, https://openbudget.ny.gov/historicalFP/classic/MidYear8384.pdf.
- Dall Forsythe, Quicker, Better Cheaper? Managing Performance in American Government (Rockefeller Institute Press, 2001), p. 523.
- See: Chapter 762 of the Laws of 1992.
- State of New York, “Governor Cuomo Announces Members of SAGE Commission to Modernize and Right-Size State Government” (press release, April 19, 2011), www.governor.ny.gov/news/governor-cuomo-announces-members-sage-commission-modernize-and-right-size-state-government.
- State of New York, New York State Spending and Government Efficiency Commission Final Report (February 2013), www.ny.gov/sites/ny.gov/files/atoms/files/SAGEReport_Final_2013.pdf.
- State of New York, New York State Spending and Government Efficiency Commission Final Report (February 2013), p. 90, www.ny.gov/sites/ny.gov/files/atoms/files/SAGEReport_Final_2013.pdf.
- Elizabeth Lynam and Tammy Gammerman, “Little Noticed but Significant: The Sound Recommendations of the SAGE Commission,” Citizens Budget Commission Blog (April 15, 2013) https://cbcny.org/research/little-noticed-significant-sound-recommendations-sage-commission.
- State of New York, New York State Spending and Government Efficiency Commission Final Report (February 2013), p. 90, www.ny.gov/sites/ny.gov/files/atoms/files/SAGEReport_Final_2013.pdf.
- New York State Division of the Budget, Budget Bulletin L-1220 (July 26, 2018), www.budget.ny.gov/guide/bprm/l/l-1220.html.
- New York State, Fiscal Year 2020 Executive Budget Briefing Book (January 2019), p. 158, www.budget.ny.gov/pubs/archive/fy20/exec/book/briefingbook.pdf.
- New York State Division of the Budget, FY 2021 Executive Budget Briefing Book (January 2020), p. 133, www.budget.ny.gov/pubs/archive/fy21/exec/book/briefingbook.pdf.
- New York State Division of the Budget, FY 2021 Executive Budget Briefing Book (January 2020), p. 133, www.budget.ny.gov/pubs/archive/fy21/exec/book/briefingbook.pdf.
- New York State Division of the Budget, Attachment H: Agencies Impacted by L-1220 (July 2018), www.budget.ny.gov/guide/bprm/l/l-1220-attach-h.pdf.
- State of New York, New York State Spending and Government Efficiency Commission Final Report (February 2013), p. 89, www.ny.gov/sites/ny.gov/files/atoms/files/SAGEReport_Final_2013.pdf
- State of New York, New York State Spending and Government Efficiency Commission Final Report (February 2013), p. 91, www.ny.gov/sites/ny.gov/files/atoms/files/SAGEReport_Final_2013.pdf.
- New York State Division of the Budget, email to Citizens Budget Commission staff (June 16, 2020).
- New York State, No. 95: Using Technology to Promote Transparency, Improve Government Performance and Enhance Citizen Engagement (Executive Order, March 11, 2013), www.governor.ny.gov/news/no-95-using-technology-promote-transparency-improve-government-performance-and-enhance-citizen.
- The New York State open data portal also incorporates open data from portals maintained by New York City, Buffalo, and the NYS Department of Health. See: New York State Office of Information Technology Services, Open NY Quarterly Report July 2019 (July 25, 2019), https://data.ny.gov/dataset/Open-NY-Quarterly-Report-April-2020/25ir-ahmn.
- See: New York State Office of Information Technology Services, “Open NY” (accessed August 25, 2019), https://data.ny.gov/.
- New York State Department of Transportation, “Pavement Management Unit” (accessed October 17, 2019), www.dot.ny.gov/divisions/engineering/technical-services/pavement-management.
- New York State Office of General Services Business Services Center, “About the BSC” (accessed August 25, 2019), https://bsc.ogs.ny.gov/content/about-bsc.
- New York State Office of the State Comptroller, Business Services Center Shared Services (December 2016), https://osc.state.ny.us/audits/allaudits/093017/16s16.pdf.
- See: New York State Department of Health, “Tobacco-Related Reports,” (August 2019), www.health.ny.gov/prevention/tobacco_control/reports.htm; and Sections 1399-ii and 1399-jj of the Public Health Law of New York State.
- New York State Department of Health, “Prenatal Care in New York State” (November 2016, accessed January 14, 2020), www.health.ny.gov/community/pregnancy/health_care/prenatal.