State School Aid
The Neediest Districts Could Be Spared $750 million in Cuts through Better Targeted Reductions
School aid is the State’s largest expenditure item, comprising fully $21.2 billion or one-quarter of the State operating budget.[1] To help close a $10 billion gap in the coming year’s budget, Governor Andrew Cuomo proposed reducing school aid by nearly $1.7 billion to $19.5 billion. From the vantage of school districts, whose fiscal year (beginning July 1) differs from the State’s fiscal year (beginning April 1), the year-to-year reduction would be $1.5 billion or 7.4 percent.[2] The overall reduction is necessary to bring spending to a more sustainable level, but the cuts’ impacts on individual districts should be modified. More of the burden than is necessary is placed on the neediest districts. If the cuts were better calibrated by ability to pay, the neediest school districts could be spared $750 million in budget pain.
The Underlying Problem
The main role of state school aid is to address the great disparities in local districts’ wealth. The wealthiest 10 percent of the districts have, on the average, a local tax base per pupil more than 10 times greater than the statewide median, or $5.5 million per pupil compared with $548,789 per pupil. (See Table 1.) At the other end of the spectrum, the poorest 10 percent of the districts on average have a local tax base per pupil that is less than half the statewide median. The wealthiest districts are able to raise substantial revenue for their schools with relatively little “tax effort” (measured as the tax collected divided by the tax base.) The tax effort in the wealthiest 10 percent of districts is half the statewide median—$8.00 versus $15.96 per $1,000 of tax base. In contrast districts in the poorest decile have a tax effort 128 percent of the median and nearly triple that of the districts in the wealthiest decile.
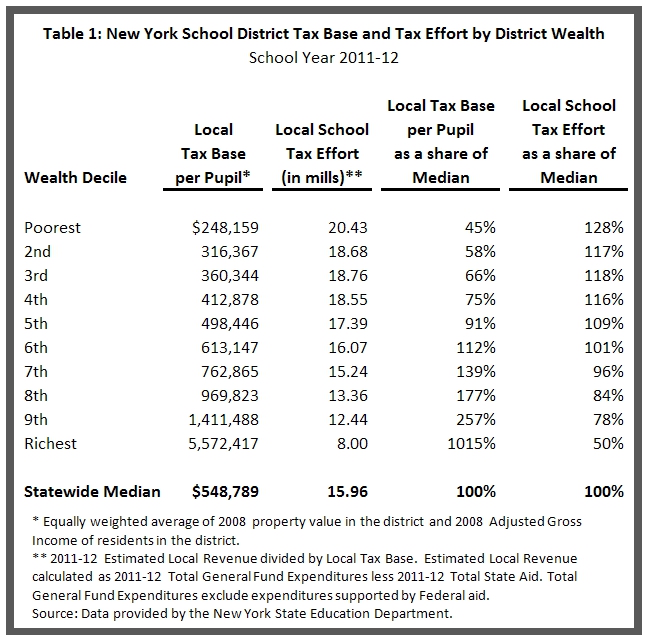
With their relatively low tax effort the wealthier districts raise the resources to support their educational priorities. Estimated average per pupil expenditures in the top 10 percent of districts is $30,192, nearly twice the statewide median of $16,065.[3] The next most-wealthy districts in the ninth decile average $20,084 per pupil, or a quarter more than the statewide median.
The Problem with the Governor’s Proposal
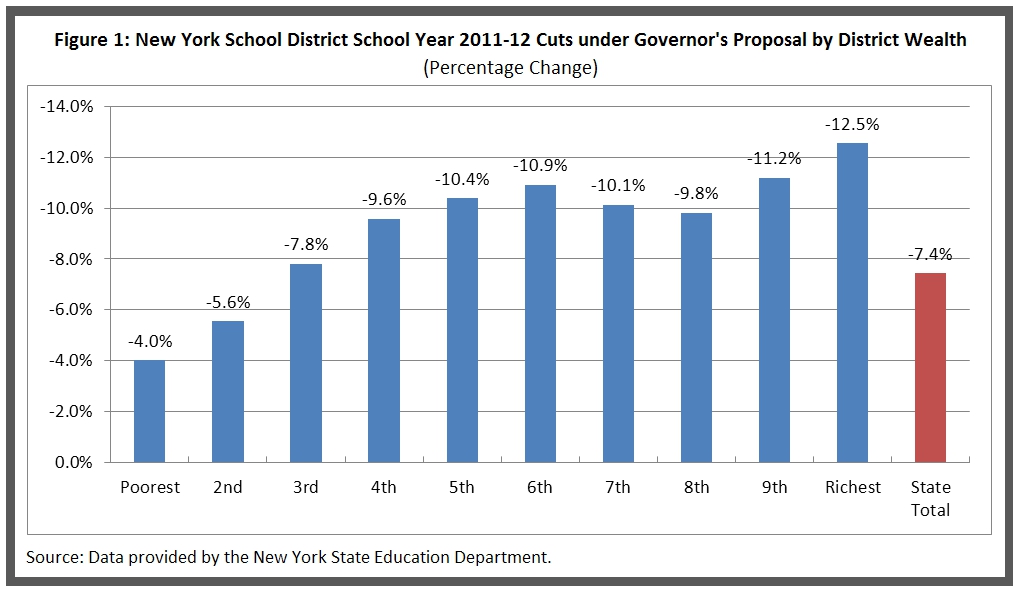
The Governor’s proposal for school aid cuts is targeted in a limited fashion; a better approach is to make the cuts more progressive. In the Governor’s plan the poorest 10 percent of districts would have 4 percent of their aid cut while the richest 10 percent would have 12.5 percent of their aid cut. (See Figure 1.) However, percentage cuts in the seventh and eighth wealthiest deciles are less than those proposed for their less well off counterparts in the fifth and sixth deciles—10.1 percent and 9.8 percent versus 10.4 percent and 10.9 percent, respectively. A more progressive distribution of cuts would increase more significantly in inverse proportion to district wealth; cuts to the poorest 10 percent would be less than 4 percent, cuts to the seventh and eighth wealthiest deciles would be greater than those in the less well-off fifth and sixth deciles, and cuts to the richest 10 percent would be greater than 12.5 percent.
The unusual and arguably inequitable pattern of cuts in the Governor’s proposal is rooted in the way in which the plan deals with the two major types of school aid – foundation aid and special categorical aid programs. Foundation aid began with the Education Reform Act of 2007, which consolidated about 30 categorical aid programs that comprised about 70 percent of the total school aid. It required these funds be distributed according to each district’s student needs and its ability to support its schools on its own tax base; that is, the foundation aid formula ensures that most school aid is distributed in greater proportion to the neediest school districts. In the first two years of the foundation aid program about $2.3 billion was added to the foundation aid pot,[4] but foundation aid has been effectively frozen at the 2008-09 level for the past two years.
About 20 categorical aid programs were left out of foundation aid. These programs give aid to districts based on their past expense or on some other special provision. They have little or no redistributive effect.
The Governor’s approach to setting amounts for each district’s cuts involves four elements: (1) Foundation aid is frozen at last year’s amount;[5] (2) categorical aid program payments are set at their projected levels using existing formulas; (3) each district’s total aid amount is cut using a progressive formula that adjusts for wealth and student needs; (4) the cuts resulting from the formula are limited by special provisions applied to qualifying districts.
As noted earlier, the freezing of foundation aid is a continuation of an approach taken in each of the past two fiscal years. The approach taken for the categorical programs and the limits on cuts are the major sources of the inequities. Funding for these programs, which is primarily based on district expenses, is allowed to grow under the formulas in the current law. Cuts are then taken against the increased projected payments. Allowing these types of aid payments to increase in their base amounts reduces the progressive nature of the cuts.
Furthermore, two special provisions applied to the reduction formulas reduce the overall share of the reductions borne by the districts in the four wealthiest deciles. The first of these provisions is a ceiling imposed on the reductions, set at 23 percent of most types of aid including foundation aid. This provision has the greatest effect on districts in the ninth and tenth wealthiest deciles. Among the top 10 percent wealthiest all but one district’s cuts are reduced, and in the ninth wealthiest of the deciles the cuts for 48 of the 67 districts are reduced.
A second provision allows 166 districts to receive smaller cuts than they otherwise would, presumably because they are deemed to have excessive tax burden relative to their wealth.[6] These districts fall under an alternative reduction formula that yields smaller cuts than the primary formula does. Despite the fact that many of the poorest districts in the State have high tax effort, the majority of the districts that get the break under this provision fall in the 7th and 8th wealth deciles—92 out of 135 districts, or more than two-thirds. This clause helps to explain why districts in these two deciles would experience, on the average, lower cuts than the relatively poorer districts in the fifth and sixth deciles. (Refer to Figure 1.)
An Option to Improve Targeting
In acting on the Governor’s proposal, the legislature should focus on improving the distribution of aid cuts to make them more targeted and improve their progressivity. The two provisions that diminish and distort the overall targeting of the cuts should be removed from the formula by which the cuts are allocated. If the provisions for a maximum reduction limit and for lowered reductions for certain “high tax” districts were dropped, then $750 million would be generated from deeper cuts in aid to the wealthiest 30 percent of the districts. If that amount were applied to reducing the proposed cuts to the poorer districts, a total of 380 low wealth districts would not have a cut in State aid next year. Districts in the sixth decile would experience cuts of 1.0 percent increasing to 9.8 percent in the seventh decile. (See Figure 2.) For the top thirty percent of districts the cuts would rapidly increase from 26.8 percent to 86.2 percent, but they would still receive some aid.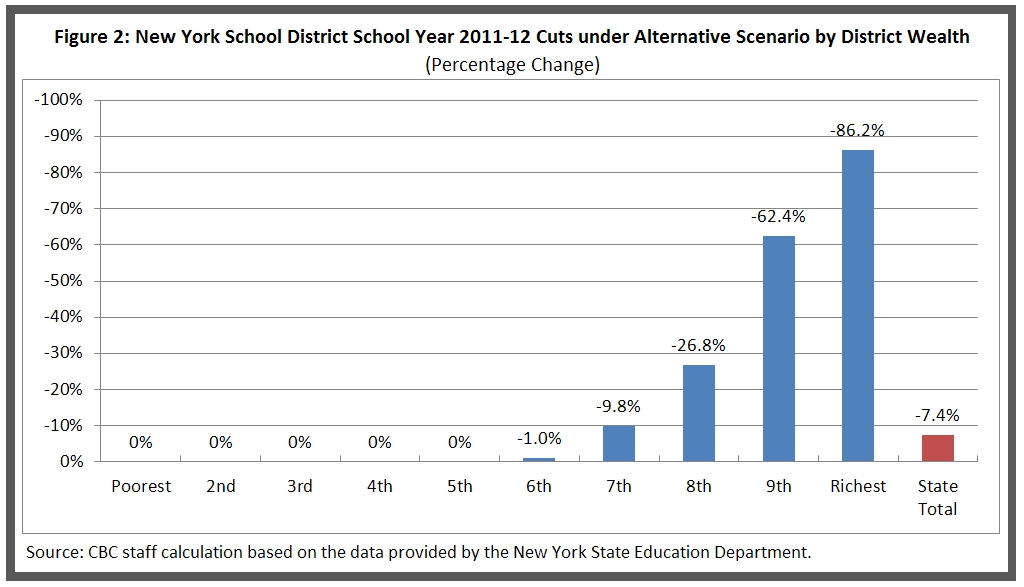
It is useful to illustrate the effect of this option with examples of school districts at opposite ends of the wealth spectrum. Under the Governor’s budget proposal, Scarsdale, a wealthy suburban district in Westchester, would see an 11.7 percent cut in school aid, which for that district amounts to $138 per pupil. Roosevelt, a poor suburban district on Long Island that is much more heavily reliant on State aid, would experience a cut of 6.6 percent or $856 per pupil. Under the suggested alternative scenario Scarsdale would get a cut of 66.4 percent, or $781 per pupil, whereas Roosevelt would be entirely spared the cuts. New York City would get the same cut under the two scenarios—$392 per pupil, or 6.4 percent.
School aid cuts are necessary, but they should be implemented in a way that does the least harm to the schools and students that are the most dependent on State support. As the budget for fiscal year 2011-12 is modified by the Legislature, the formula by which school aid reductions are made should be improved so that the burden is borne more squarely by those who can most easily absorb the cuts.
Footnotes
- This total includes $1.3 billion in federal stimulus funds that replace State funds.
- The school year and State fiscal year data are from New York State Division of the Budget, 2011-12 Executive Budget, Five-Year Financial Plan, February 2011, pp.75-76. The fiscal year change is larger than the $346 million reduction reported in the Five-Year Financial Plan because it includes the loss of $1.3 billion in federal stimulus funding.
- Calculated as 2011-12 Total General Fund Expenditure divided by 2009-10 Total Wealth Pupil Unit (TWPU), or pupil count weighted for grade level and special needs. Data is based on the 2011-12 Executive Budget recommendations for school aid and provided by the State Education Department.
- New York State Education Department, Fiscal Analysis and Research Unit, Analysis of School Finances in New York State School Districts, 2008-09 Report, http://www.oms.nysed.gov/faru/Analysis/cover.html (February 28, 2011).
- Frozen aid programs also include Universal Pre-Kindergarten and a few other categorical aids.
- The alternative formula for reductions is applied to districts with a Tax Effort Ratio (defined as a district’s residential levy divided by district income) greater than 4.5 and a Combined Wealth Ratio for Foundation Aid less than 1.5. No rationale is provided for the selection of these two benchmarks.