7 Facts About the NYC Department of Buildings
The New York City Department of Buildings (DOB) is charged with enforcing building and zoning codes, permitting construction activity, licensing construction trades, and ensuring safety in construction in New York City. The agency’s budget has grown rapidly in recent years, in part due to investments in technology and a broadening of scope to include implementation and enforcement of environmental laws pertaining to construction. CBC’s review of the agency’s budget presents trends in spending, revenues, staffing, and outputs.
1. THE DEPARTMENT OF BUILDINGS FISCAL YEAR 2023 BUDGET IS $322 MILLION.
Total spending on the DOB in fiscal year 2023 is projected to be $322.1 million, comprised of a $238.7 million operating budget and $83.3 million of centrally-allocated costs for fringe benefits ($60.6 million) and pensions ($22.7 million). (See Figure 1.) Fully 80 percent of the spending is on Personal Services (PS) costs for employee compensation, while the remaining 20 percent is for Other than Personal Services (OTPS).

2. DOB SPENDING, INCLUDING COVID-SPECIFIC PROGRAMS, DOUBLED OVER THE PAST NINE YEARS, GROWING TWICE AS FAST AS TOTAL CITY SPENDING.
Between fiscal year 2014 and fiscal year 2022, agency spending excluding centrally allocated costs and COVID-19 specific programs, increased 7.2 percent annually, from $98.7 million to $172.5 million. (See Figure 2.) Including $25 million in COVID-19 related spending in fiscal year 2022, total DOB spending reached $196.4 million, an increase of 9.0 percent per year and twice as fast as the overall City budget, which increased 4.5 percent per year.1
DOB spending excluding COVID-19 related funds peaked in fiscal year 2020, at $187.3 million before decreasing to $184.0 million in fiscal year 2021 and $171.5 million in fiscal year 2022; it is not clear whether DOB responsibilities associated with the NYC Situation Room for Department of Education (DOE) school closings crowded out spending in other areas of DOB or whether demand for DOB services declined due to lower permit and construction activity.
The current modified budget of fiscal year 2023 is $239.7 million, including $10.8 million on COVID-related functions. This would represent a 22 percent increase over fiscal year 2022 actual spending, including COVID-related funding, putting the fiscal year 2023 DOB budget at 142 percent higher than fiscal year 2014. However, the final spending for the current fiscal year may be higher or lower than the current modified budget; the data will not be available until October 2023.

3. DOB’S MAIN FUNCTIONS ARE PERMITTING, INSPECTIONS, ENFORCEMENT, SAFETY, AND LICENSING.
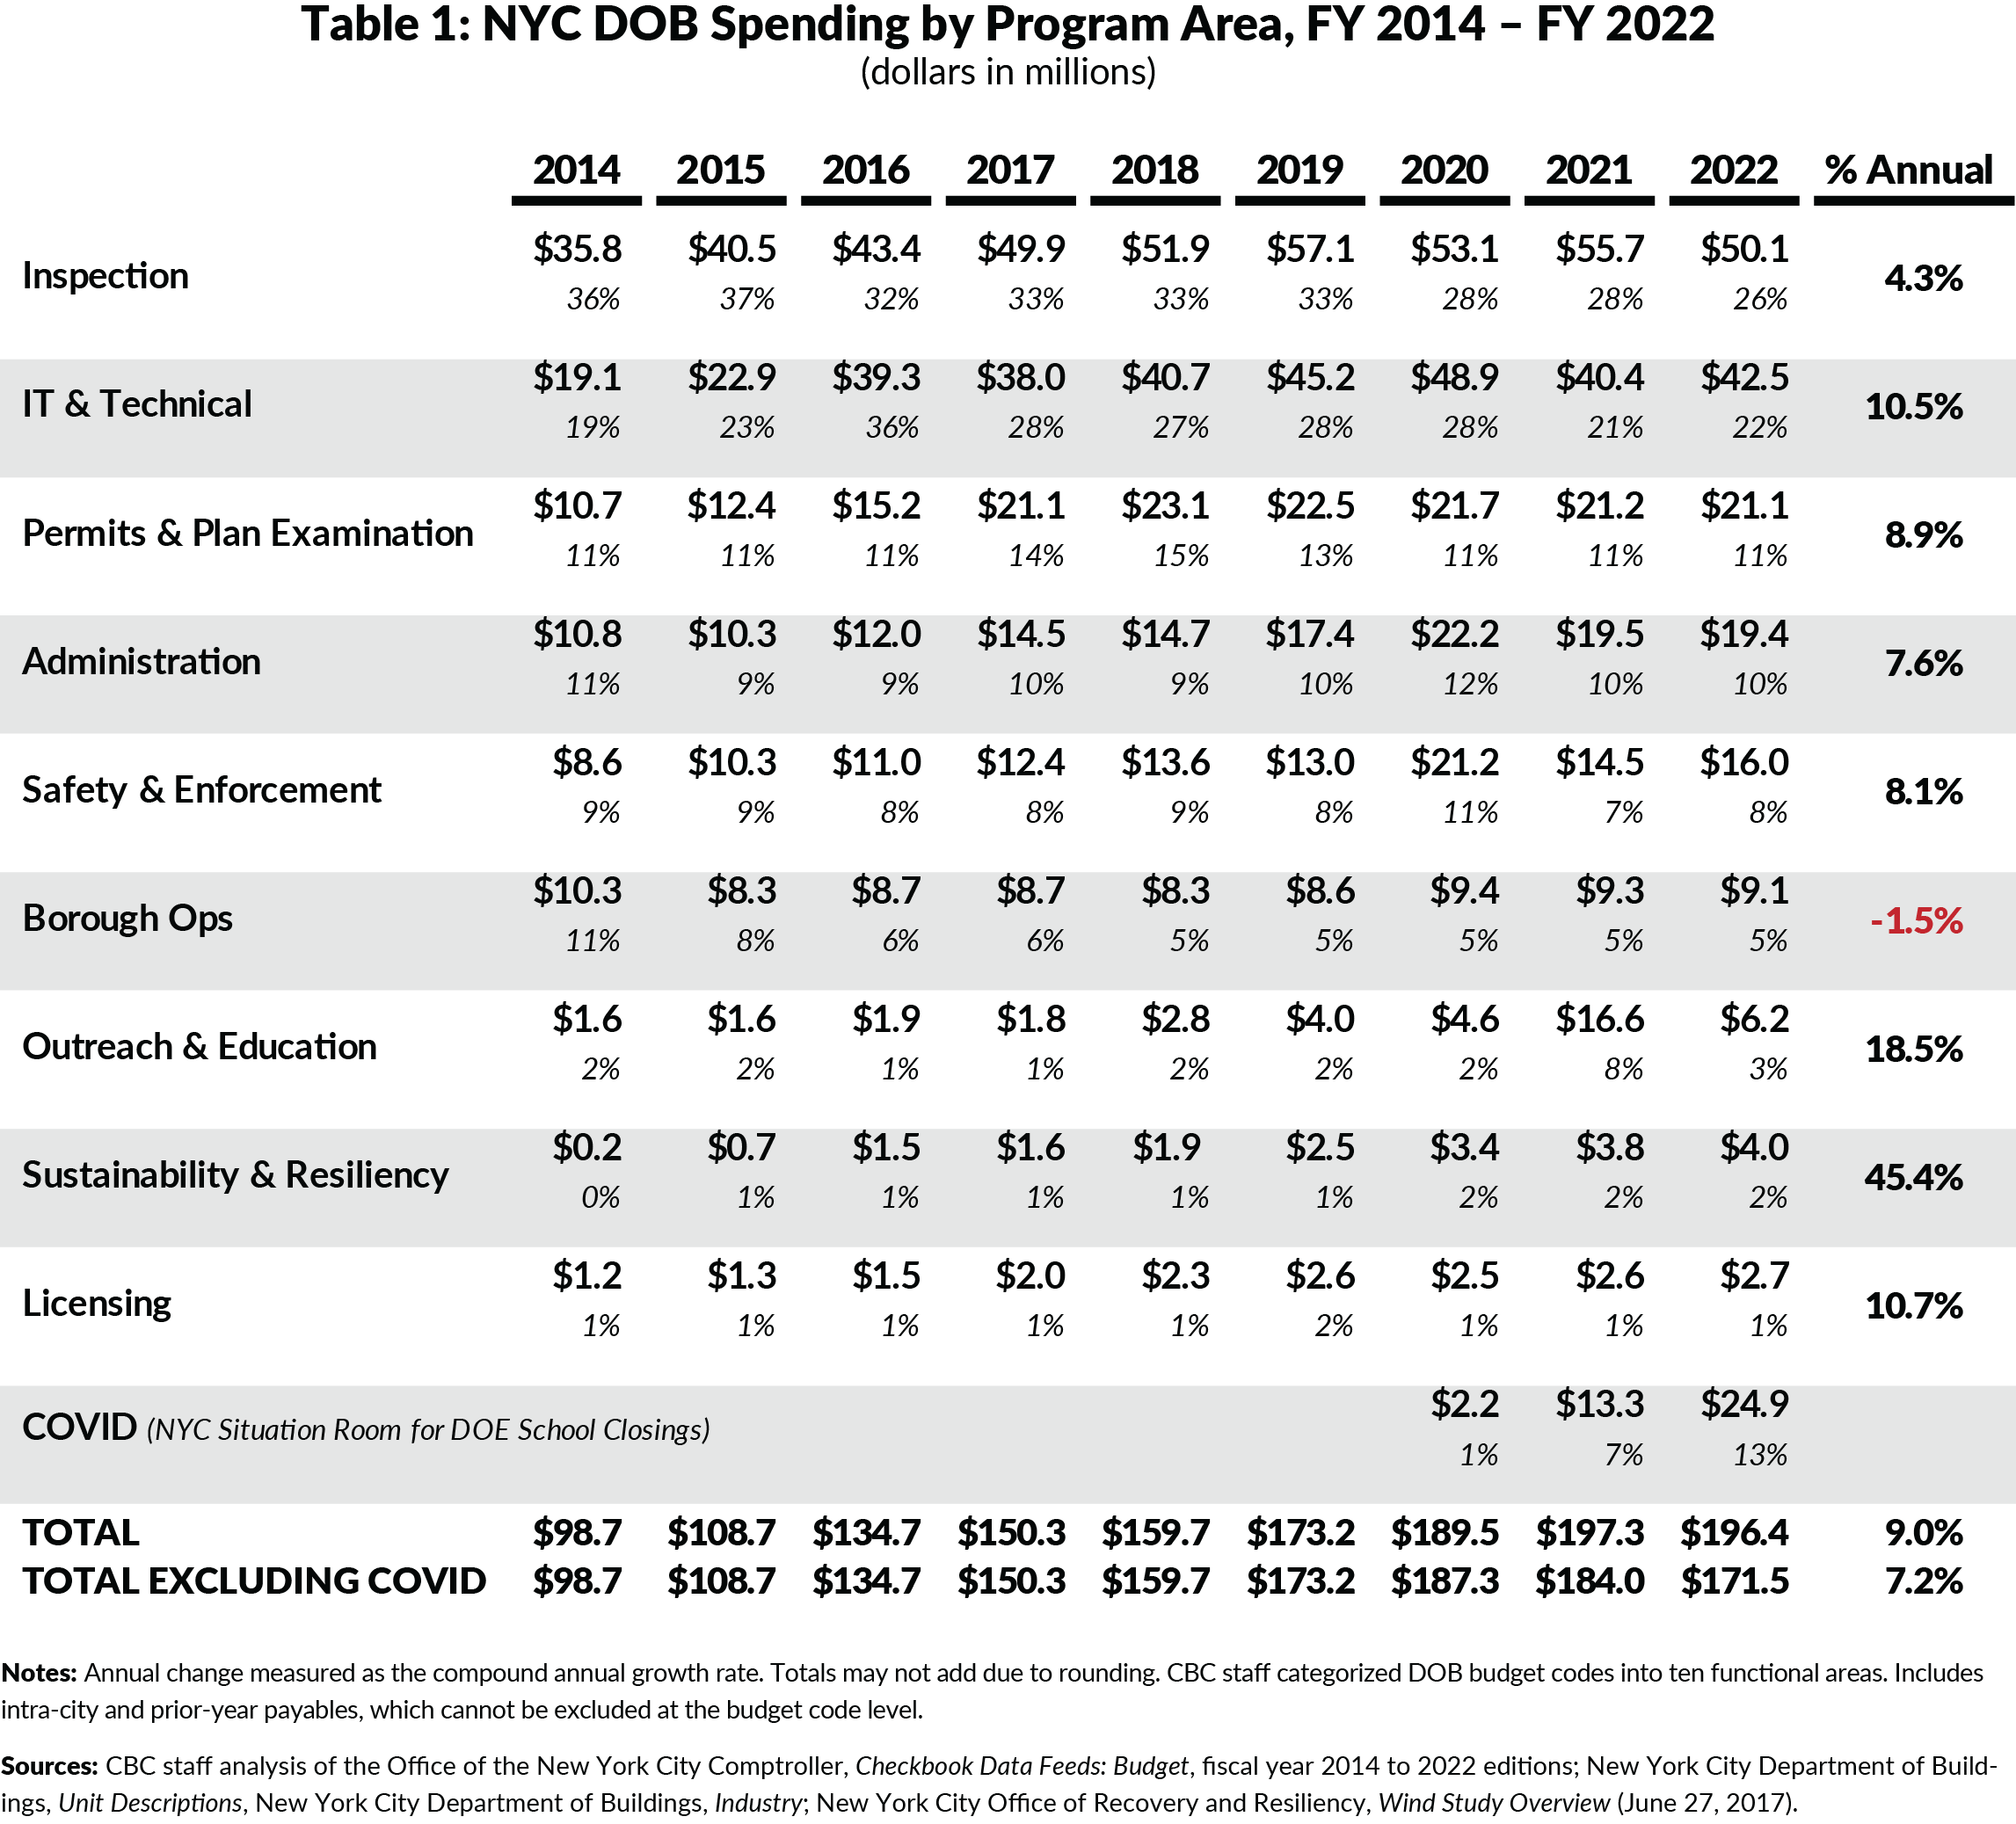
DOB activities comprise 10 program areas. Spending growth for each varied between fiscal year 2014 and fiscal year 2022, reflecting new priorities and responsibilities. However, nearly 13 percent of fiscal year 2022 spending, about $25 million, is for expenditures related to the COVID-19 pandemic Situation Room, which monitored cases and school closures at the DOE.
The largest share of DOB spending is for construction and building inspections. While spending on inspections increased $14 million, to total $50 million in fiscal year 2022, its share of total spending decreased from 36 percent to 26 percent as other functions grew more rapidly. (See Table 1.)
The next largest portion of spending is on information technology (IT) and code-related technical work, which comprises about 22 percent of DOB spending. This spending increased rapidly, 123 percent or $23 million, between fiscal years 2014 and 2022 with most growth early in the period, due to the development and rollout of DOB NOW, the department’s new online self-service tool.
Permits and plan examination grew at the same rate as the overall budget and constituted 11 percent of spending in both fiscal years 2014 and 2022. Similarly, spending on safety and enforcement maintained a steady 8 percent to 9 percent of spending.
While sustainability and resiliency remain a small share at 2 percent ($4 million), it has grown the fastest as DOB has taken on more responsibilities in this space; this area of spending will likely grow in future years with the implementation of Local Law 97.2
4. DOB’S $317 MILLION AVERAGE ANNUAL REVENUE BETWEEN FISCAL YEARS 2014 AND 2022 EXCEEDED AGENCY SPENDING.
DOB collects revenue from permitting, licensing, and fines from enforcement of building and construction codes. Annual revenue increased from $246.1 million in fiscal year 2014 to a peak of $388.5 million in fiscal year 2019. During the pandemic, revenues declined to $343.7 million in fiscal year 2020 and $306.1 million in fiscal year 2021, before increasing modestly to $336.3 million in fiscal year 2022. (See Figure 3.)
Construction and building permits are the largest revenue source, peaking at $249.4 million in fiscal year 2019 before declining in fiscal years 2020 and 2021, likely due to lower construction activity during the pandemic. Fines from enforcement of building and construction codes are the second largest revenue source; fine revenue grew before the pandemic, from $42.4 million in fiscal year 2014 to $90.2 million in fiscal year 2019. Fees are a smaller amount, between $40 million to $50 million annually, while licensing yields around $3 million annually.3

5. MOST OF DOB’S BUDGET GOES TO PERSONAL SERVICE COSTS (PS), BUT OTHER THAN PERSONAL SERVICE (OTPS) SPENDING IS GROWING MORE QUICKLY.
Fully 72 percent of DOB’s fiscal year 2023 agency budget is PS spending for salaries and wages, additional gross pay (including overtime, longevity, assignment, shift differentials, holiday pay, and terminal leave), and some fringe benefits; most fringe benefits and pensions are budgeted centrally. OTPS spending, including supplies, heat, light, and power, and professional services contracts, consumes the remaining 28 percent.4
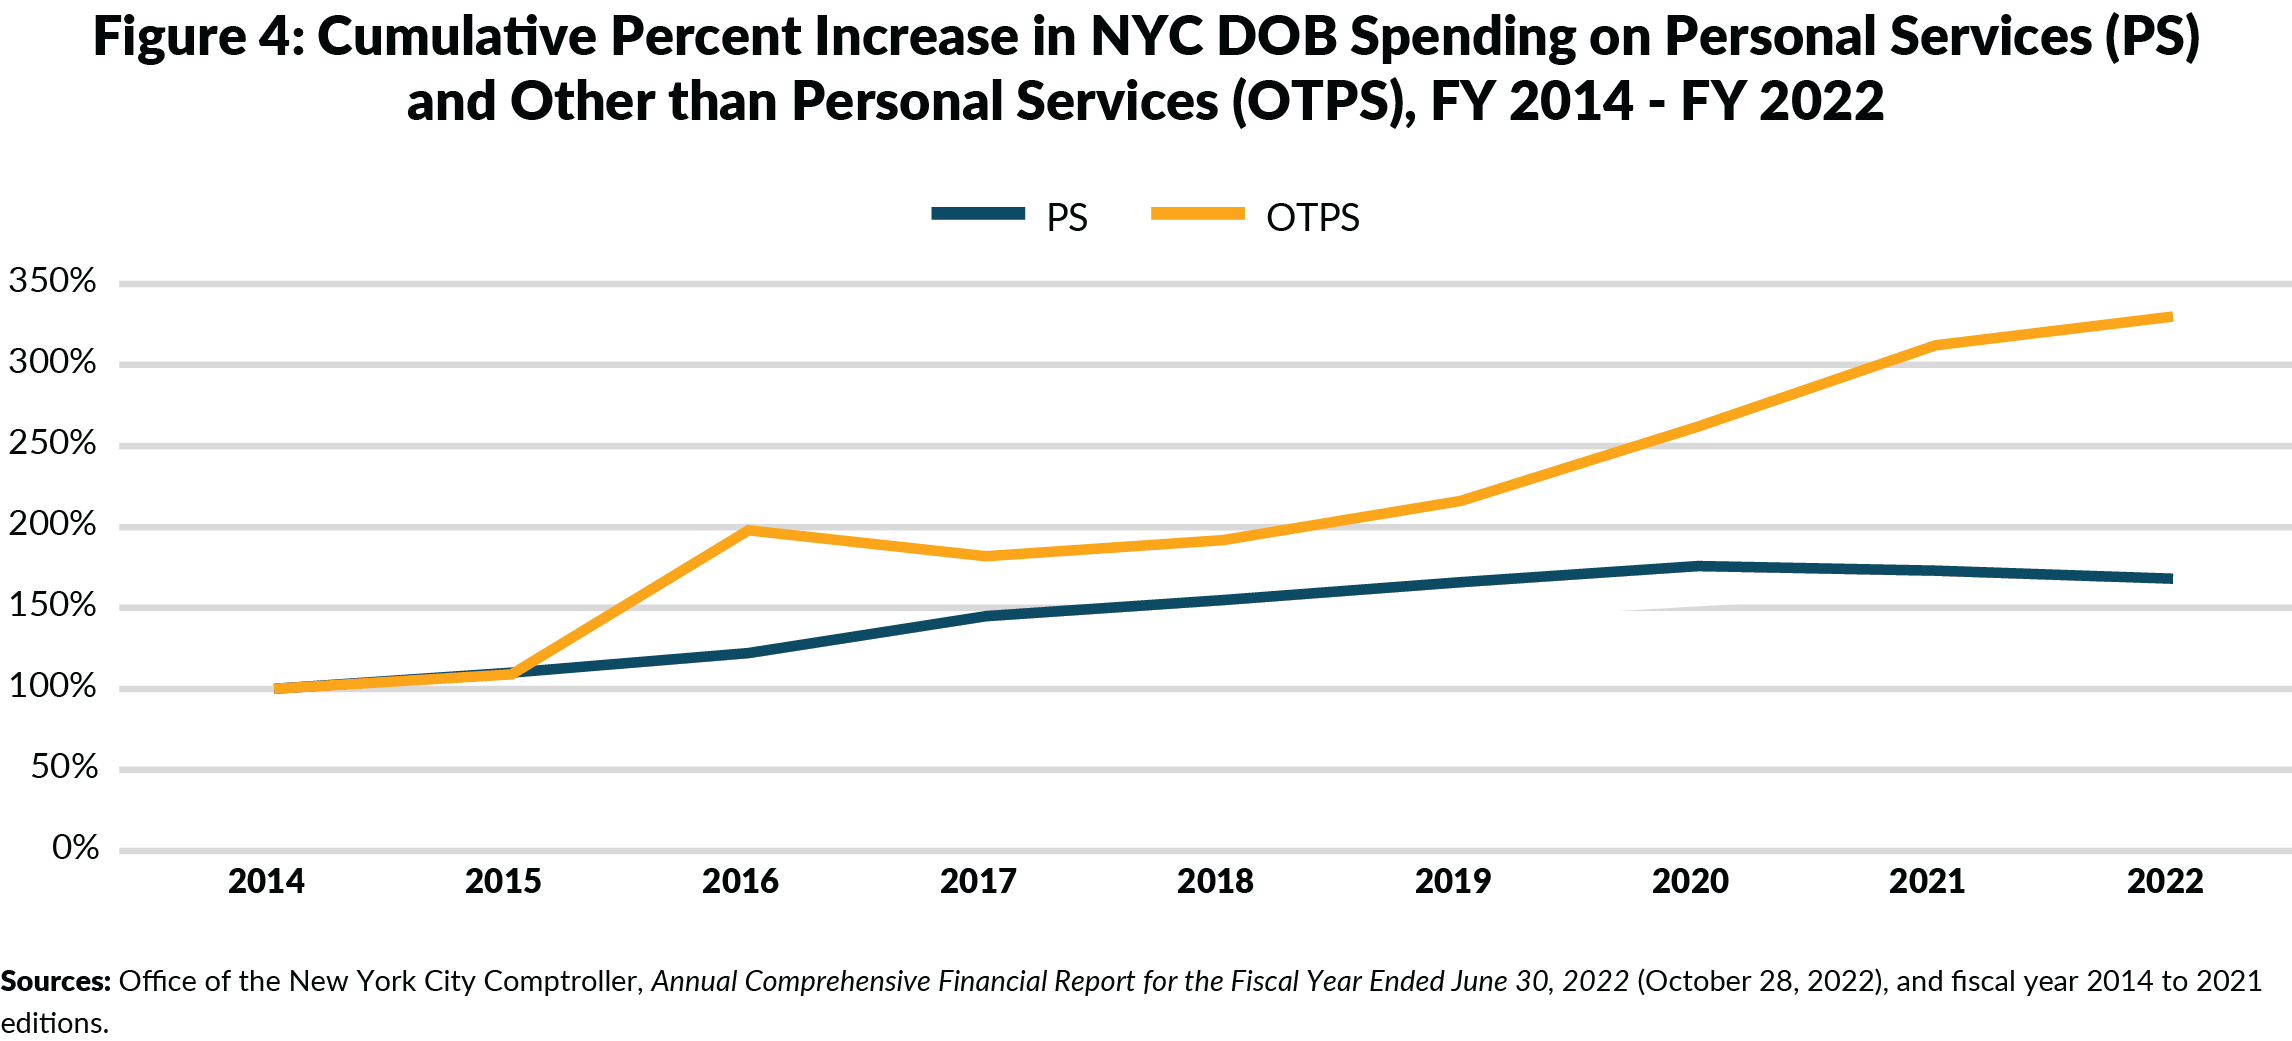
PS spending increased 6.9 percent annually from fiscal year 2014 to fiscal year 2022, while OTPS spending grew more than twice as fast, 16 percent annually. (See Figure 4.) This growth was driven by an increase in spending on contractual services, property, and equipment, and supplies and materials.
6. DOB’S ON-BOARD STAFF GREW 45 PERCENT TO 1,560 FROM FISCAL YEAR 2014 TO FISCAL YEAR 2022; STILL 18 PERCENT OF DOB’S AUTHORIZED FULL-TIME POSITIONS ARE VACANT.
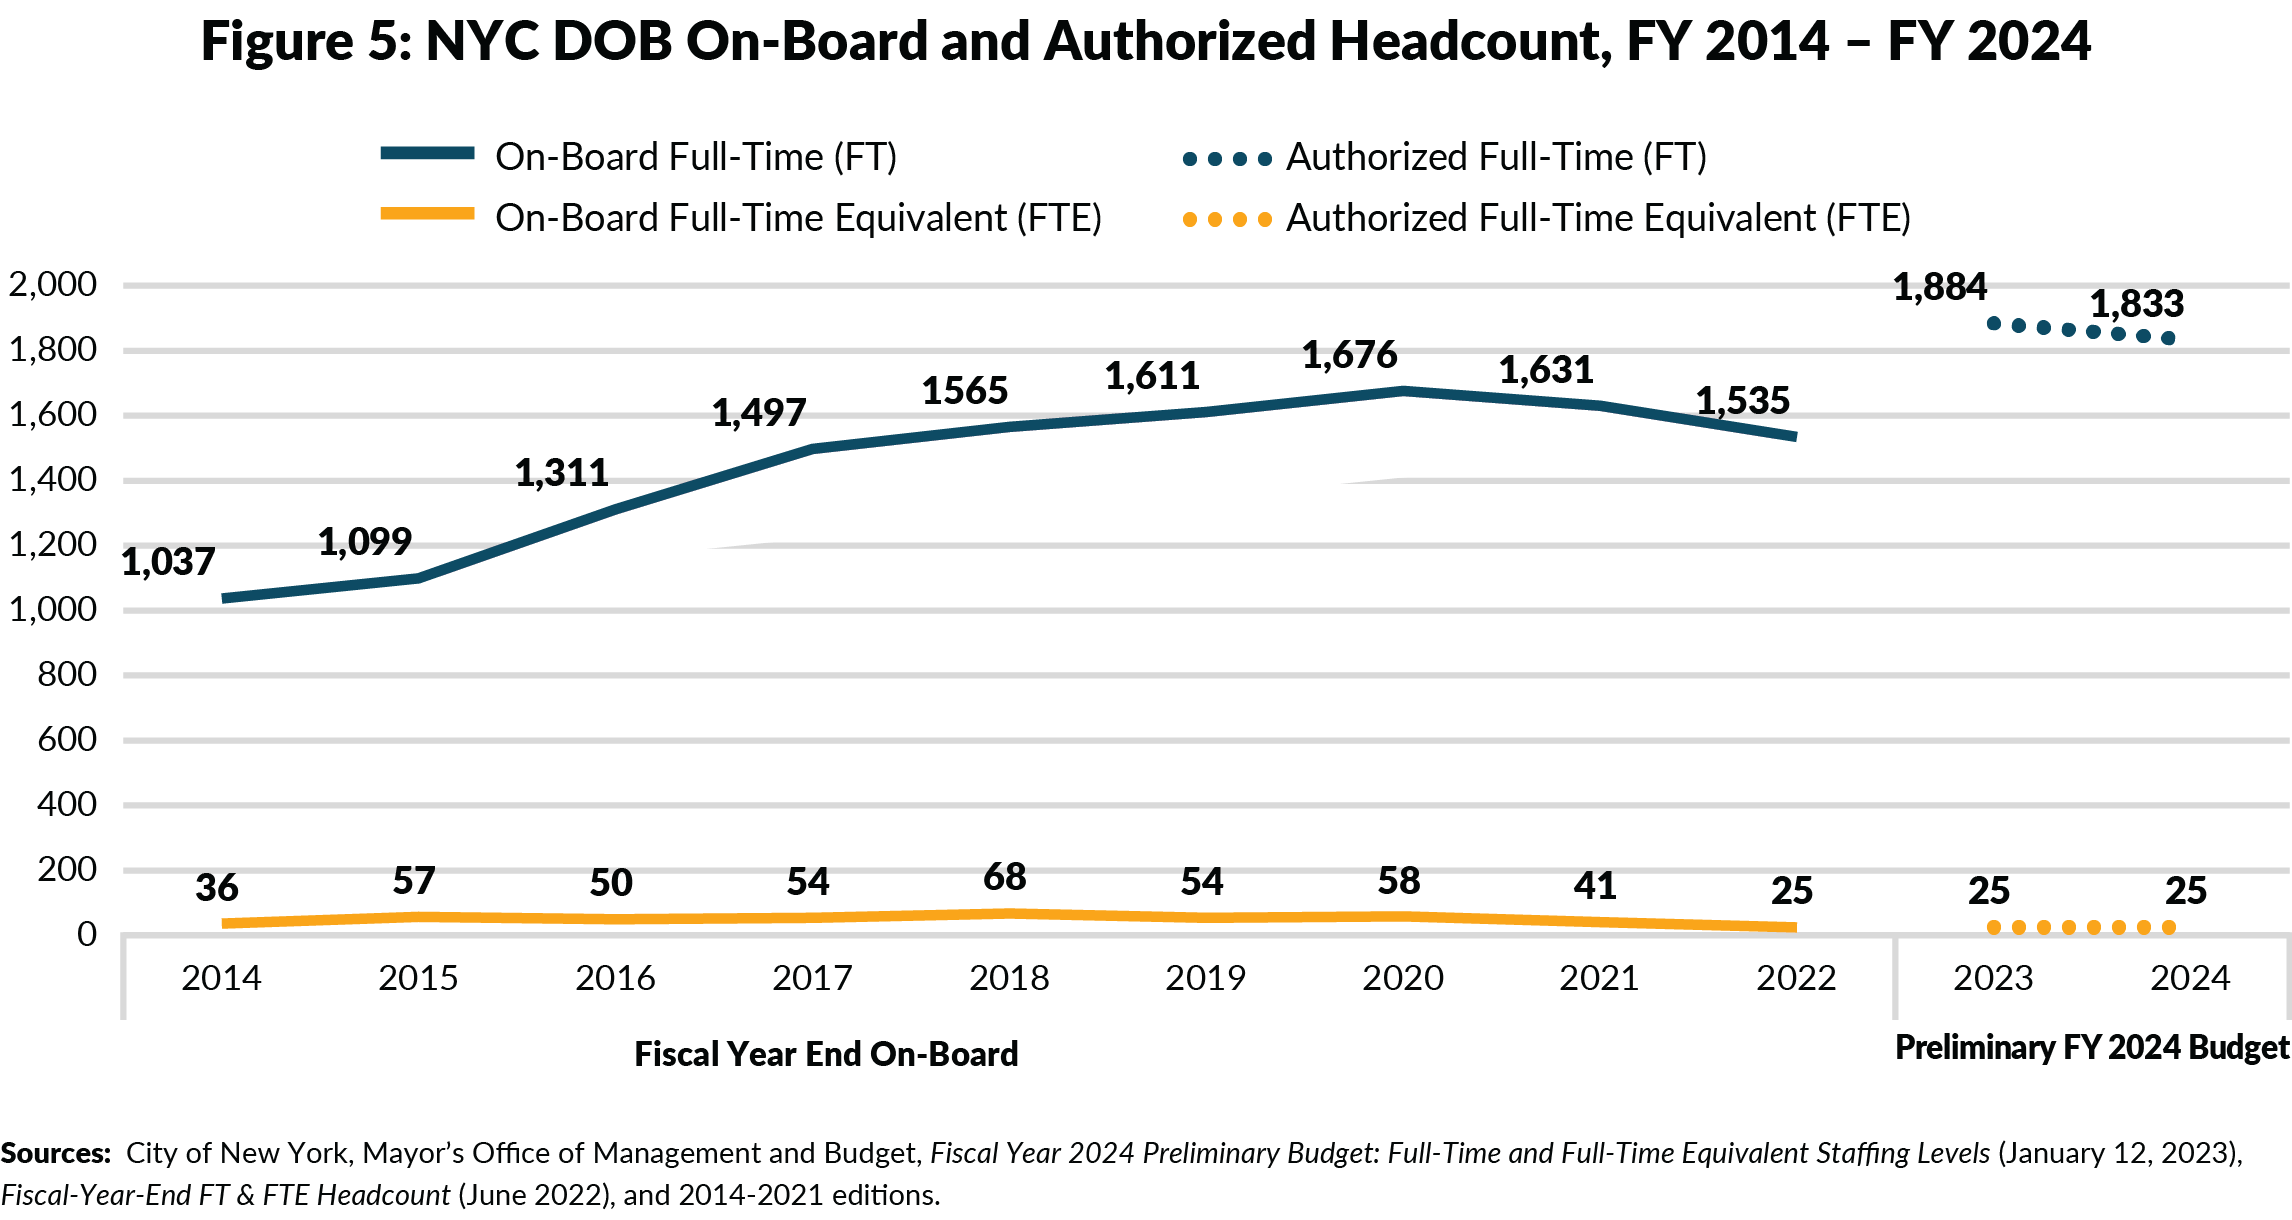
Between fiscal year 2014 and fiscal year 2022, DOB on-board total (full-time and full-time equivalent) headcount increased 45 percent from 1,073 to 1,560. (See Figure 5.) On-board headcount stood at 1,560 at the end of January 2023, the most recent data available.5
In November 2022, the City directed agencies to reduce their civilian full-time vacant positions by 50 percent with exceptions for health and safety, revenue-generation, and Mayoral priorities; building inspector vacancies at DOB were exempted.6 DOB total authorized full-time headcount for fiscal year 2023 was reduced from 1,978 in November 2022 Financial Plan to 1,884 in the Fiscal Year 2024 Preliminary Budget.
DOB vacancies were reduced by 21 percent for fiscal year 2023 and 33 percent for fiscal year 2024. As of November 30, 2022, 442 authorized full-time positions were unfilled, a vacancy rate of 22 percent. In the Fiscal Year 2024 Preliminary Budget, the authorized full-time headcount was reduced by 94 positions in fiscal year 2023 and by 51 additional full-time positions in fiscal year 2024.
These vacancy reductions are not significant enough to constrain hiring. The DOB still has 334 vacant full-time positions, an 18 percent vacancy rate. Furthermore, the authorized level following the vacancy reduction is still around 200 positions higher than DOB’s peak on-board staffing level of 1,676 at the end of fiscal year 2020.
7. DOB MAINTAINED PERFORMANCE IN SOME AREAS DURING PANDEMIC, BUT OTHERS DETERIORATED.
The pandemic shutdown is reflected in DOB metrics by reduced permits and inspections in 2020 and 2021. Permit activity decreased from more than 181,000 in fiscal year 2019 to 148,324 in fiscal year 2020 before partially rebounding to 158,984 in fiscal year 2021 and 164,264 in fiscal year 2022. (See Figure 6.) Similarly, there were fewer construction inspections during the pandemic; this decrease continued into fiscal year 2022 despite the rebound in permit activity.7

While wait times for inspections and responses to complaints largely remained constant during the pandemic, the wait time for certain plan reviews required to proceed with construction increased significantly. Plan reviews for new buildings files in borough offices doubled, from 4.4 days in fiscal year 2019 to 8.5 days in fiscal year 2022. The time to review plans for major renovation projects increased even more sharply, from around 5 days in fiscal year 2019 to 10.4 days for Hub projects and 18.7 days for borough office projects. (See Figure 7.)

Furthermore, DOB is auditing significantly fewer professionally certified jobs—just 2 percent in FY 2022—compared to a range of 13 to 23 percent in fiscal years 2016 to 2019. Professionally certified jobs are construction projects for which a licensed engineer or architect certifies that the submitted plans are accurate and conform to relevant codes. (See Figure 8.) With DOB typically identifying errors leading to revocation notices in between 30 percent to 45 percent of the audited jobs, such a low audit rate may put workers and residents at risk if buildings are not compliant with relevant codes.

CONCLUSION
DOB spending has grown significantly as its responsibilities broadened. However, despite increases in authorized headcount, the agency’s vacancy rates have been in excess of 18 percent as it struggles to hire staff. The pandemic reduced construction activity in New York City temporarily, but there are some concerning trends to monitor in, such as, wait times for plan reviews, fewer audits of jobs, and fewer construction inspections. Improving hiring at DOB remains a priority, especially as the first year of compliance with Local Law 97 nears.
Download Report
7 Facts About the NYC Department of BuildingsFootnotes
- CBC adjusted all-funds spending growth excludes interfund agreements, deposits to the Retiree Health Benefit Trust, and adjusts for the impact of prepayments.
- New York City Local Law 97 of 2019, https://legistar.council.nyc.gov/View.ashx?M=F&ID=7529949&GUID=0D2D0436-D609-4C68-AEC9-E2998431C0ED.
- Office of New York City Comptroller, Annual Comprehensive Financial Report for the fiscal year ended June 30, 2022 (October 28, 2022) https://comptroller.nyc.gov/wp-content/uploads/documents/ACFR-2022.pdf.
- City of New York, Office of Management and Budget, Fiscal Year 2023 Adopted Budget Financial Plan Expense (June 14, 2022) https://www.nyc.gov/assets/omb/downloads/pdf/adopt22-fp.pdf.
- City of New York, Mayor’s Office of Management and Budget, FT and FTE Headcount, November 2022 Actuals, email to Citizens Budget Commission staff (April 7, 2023).
- Joe Anuta, “Adams announces another round of budget cuts,” (PoliticoPro, 11/21/2022), https://subscriber.politicopro.com/article/2022/11/adams-announces-another-round-of-budget-cuts-00070253; and Annie McDonough, “New York City will cut some of its 21,000 vacant government positions,” (City & State New York, November 22, 2022), https://www.cityandstateny.com/policy/2022/11/new-york-city-will-cut-some-its-21000-vacant-government-positions/380107/.
- City of New York, Mayor’s Office of Operations, Preliminary Mayor’s Management Report: Fiscal Year 2023 (January 2023) https://www.nyc.gov/assets/operations/downloads/pdf/pmmr2023/2023_pmmr.pdf.