Bumpy Road
Transportation Capital Planning in New York State
Government investment in infrastructure is garnering significant media attention. President Donald Trump campaigned on a promise to invest $1 trillion over the next 10 years to rebuild America’s roads, bridges, ports, airports and various other infrastructures. Likewise, Governor Andrew Cuomo has prioritized infrastructure investment to promote economic development and competitiveness.
New York State’s transportation assets are vast, including 115,000 centerline miles of roads, 17,000 bridges, 3,400 railroad miles, and 136 public airports. The New York State Department of Transportation (DOT) is responsible for maintenance and construction on and around a substantial portion of this infrastructure.1 With disbursements in excess of $4.9 billion annually, DOT’s are the largest capital expenses for the State of New York each year, representing 36 percent of projected capital spending by New York State agencies.2 The importance, scope, and size of DOT’s capital investments make it essential that these investments are guided by a strong capital planning process. The most recent capital program, cobbled together by the State, covers a five-year period, fiscal years 2016 through 2020. A review of how this plan was created and implemented indicates the State did not follow best practices, and procedural improvements should be made to ensure that resources are targeted toward the greatest needs and in line with a broader strategy.
The DOT Capital Planning Process
The generally accepted “best practice” for effective capital planning requires setting priorities, tying investments to documented needs or projected economic benefits, setting affordability parameters, and effectively managing capital projects. An effective planning process features the following five steps:
- Establish priorities and goals as part of a strategic planning process;
- Conduct a thorough needs assessment;
- Identify resources available for a capital improvement plan;
- Devise a capital improvement plan based on goals, needs and available resources; and
- Implement the plan, including authorizing funding, developing project schedules, managing projects and maintaining assets.
Each of the capital planning steps should inform the next and should yield a capital plan that is aligned with the State’s goals, needs, and resources and that maintains accessibility and quality of vital infrastructure over the long term.3(See Figure 1.)

Establishing Priorities and Goals as Part of a Strategic Planning Process
The capital planning process should begin with a vision for New York’s transportation assets, and that vision should be linked to measurable, achievable goals for the transportation system. In recent years, the State has authored a few disjointed documents, which do not offer a holistic structure or strategy for transportation capital planning. The State’s capital priorities were broadly outlined most recently in the NY Works plan, compiled in 2013. The NY Works plan briefly describes the State’s intent to maintain safety and efficiency while also broadly linking all transportation assets to economic and community development, but it served as more of a compilation of anticipated spending by statewide agencies and public authorities than a strategic document establishing criteria and goals for infrastructure projects.4
DOT’s last strategic planning document, “Strategies for a New Age: New York State’s Transportation Master Plan for 2030,” was published in 2006. That document set five main themes for DOT capital investments: Mobility and Reliability, Safety, Security, Environmental Sustainability, and Economic Competitiveness. For each theme, issues and strategies were identified in order to plan strategically for achieving the goals of the plan.5 The 2006 strategic plan is now over a decade old and has not been revised or updated. Since it was authored, major adverse weather events have occurred, economic development strategies have shifted, and demographics have evolved. Additionally, the goals set forth in this document were not tied to performance metrics and targets for specific assets.
In 2009, DOT published the 2010-2015 “Capital Program Proposal,” which included specific goals to reconstruct 1,300 miles of State roads, repave another 1,600 miles, and rehabilitate more than 900 bridges. It was compelled by one-time State statutory provisions, which have not been reproduced since.6 The 2010-2015 Proposal effectively described the State’s assets and strategies, while also outlining specific performance measures and the metrics by which goals would be evaluated; however, the report was superseded by a memorandum of understanding (MOU) negotiated between elected officials for fiscal years 2014 and 2015, and the MOU process was also used for the most recent five-year period from fiscal years 2016 to 2020.7
Conducting a Thorough Needs Assessment
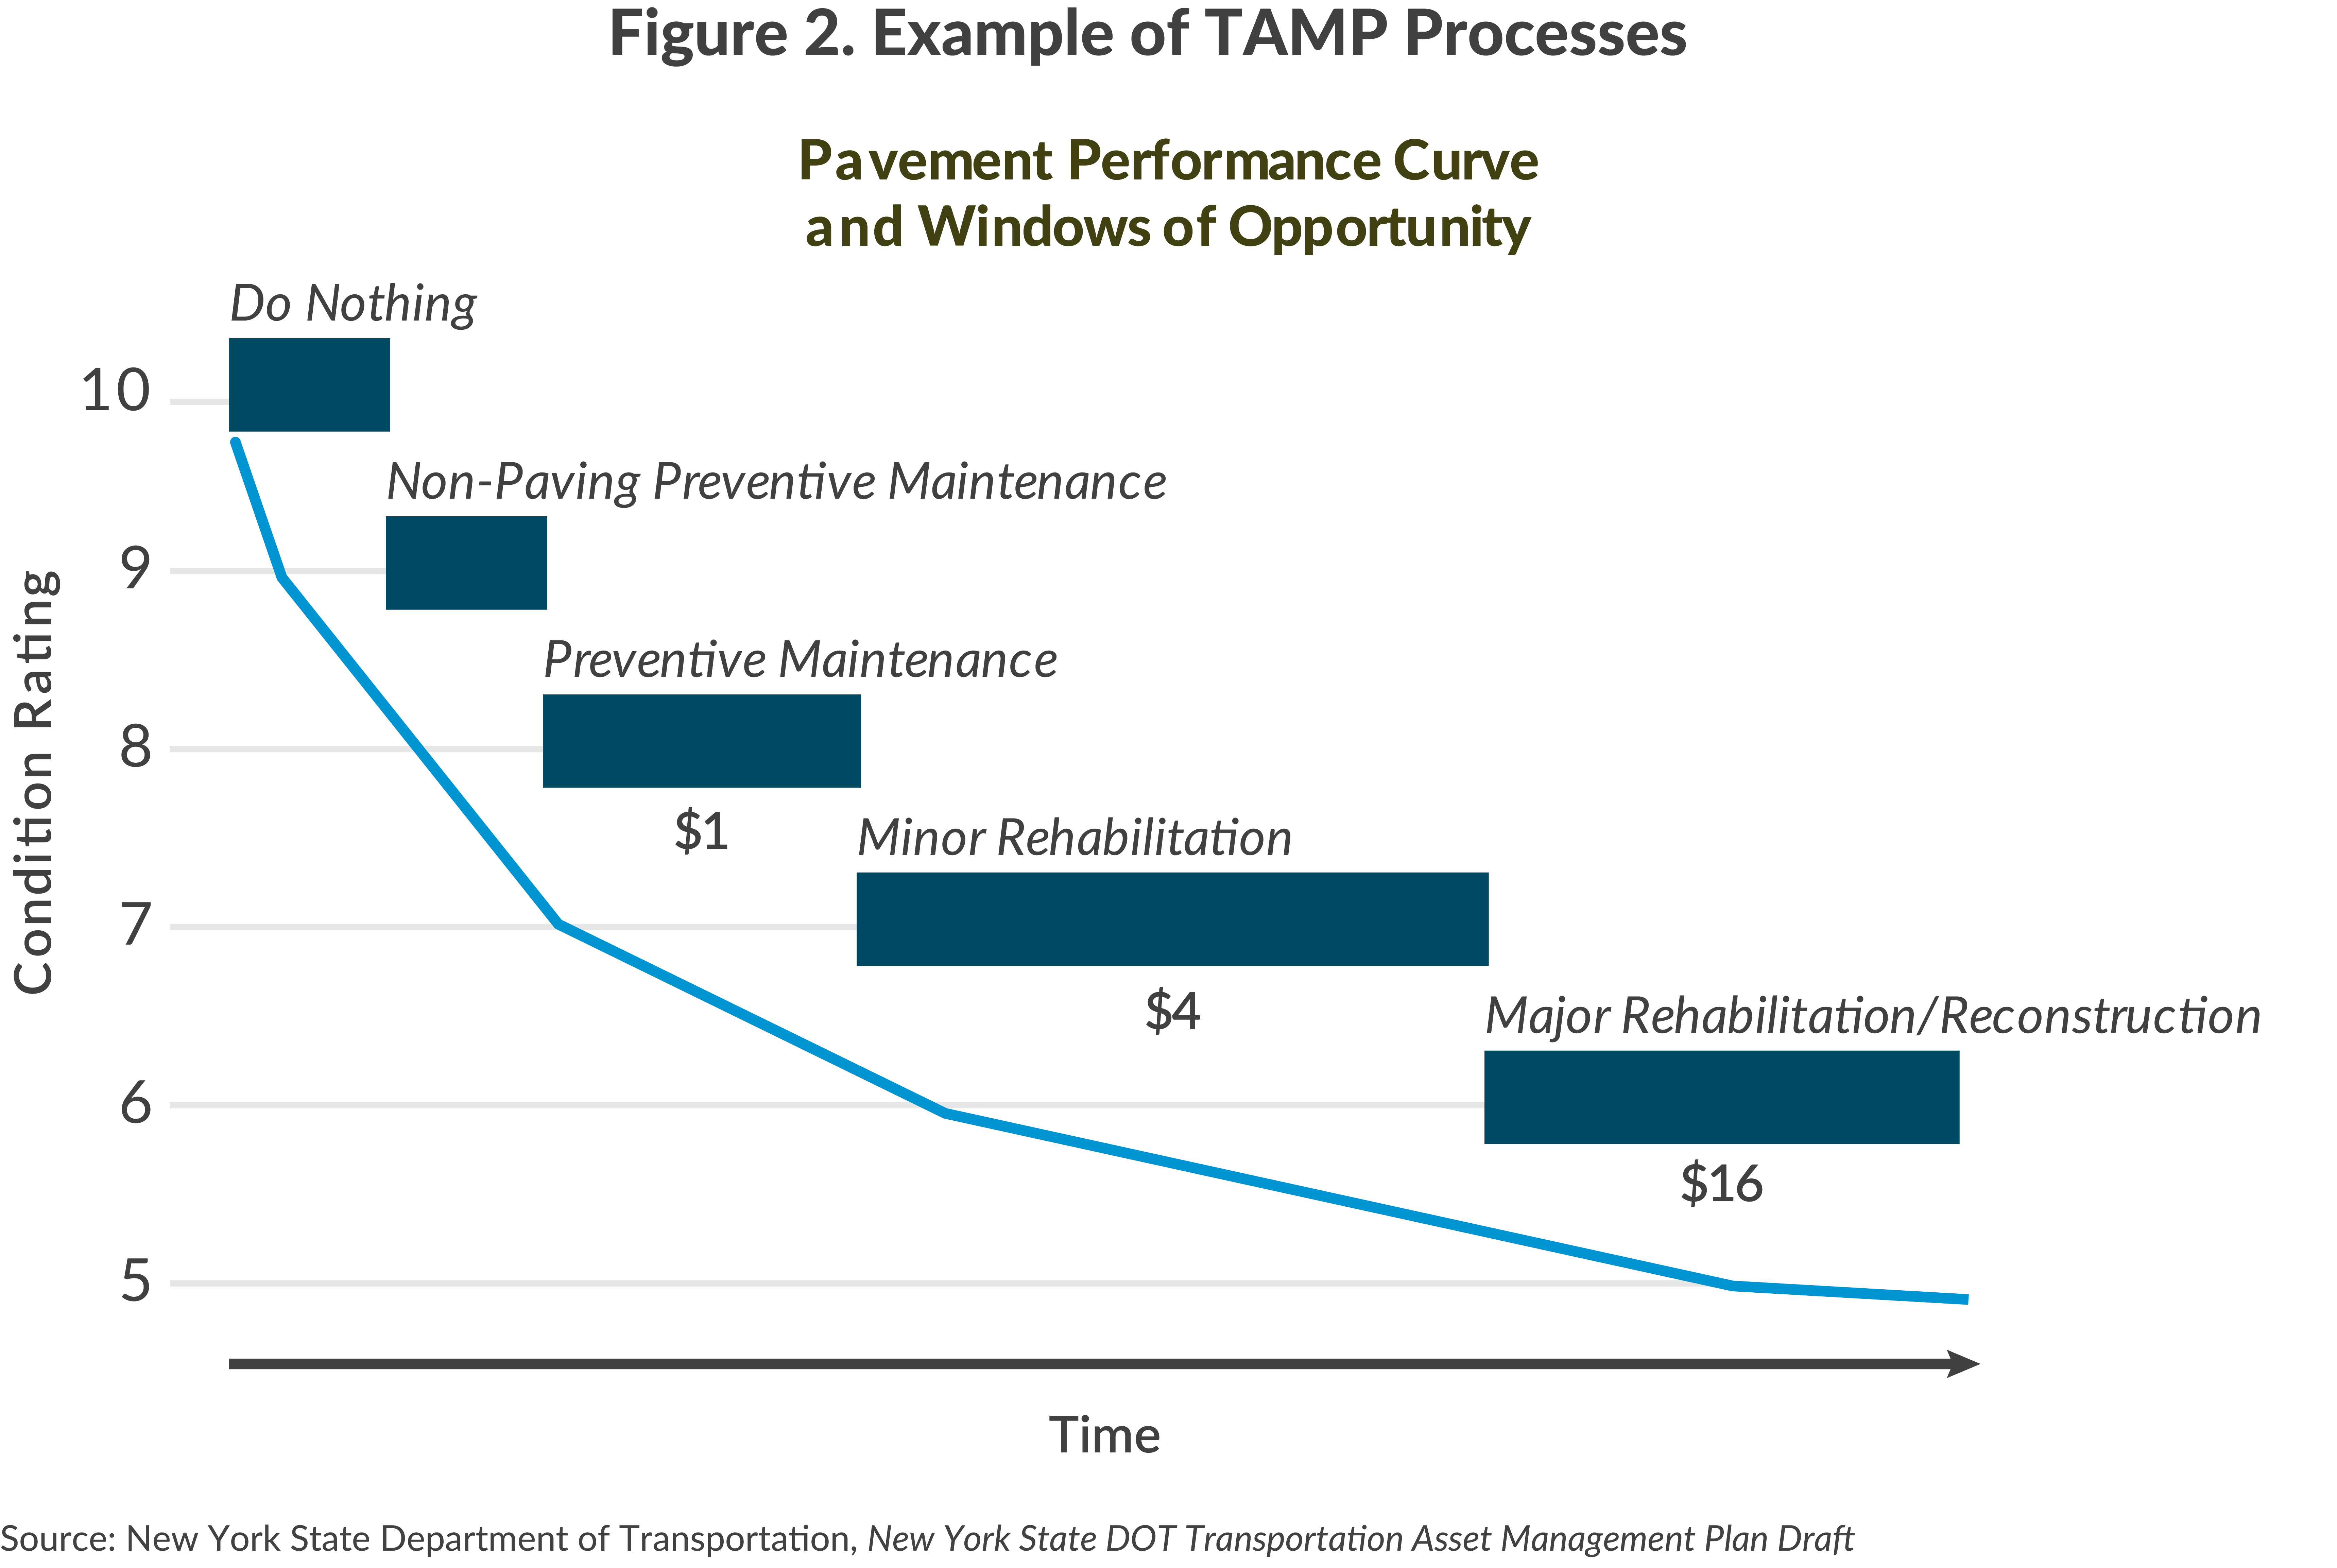
The State has detailed strategies, which are outlined in the drafted Transportation Asset Management Plan (TAMP), for proceeding with work on transportation assets. Within the TAMP are protocols for how to most cost-effectively maintain capital assets, and the ideal timing – or windows of opportunity – to carry out work on transportation assets. The TAMP provides a rigorous outline for prioritizing projects, and effectively informs the work of State and regional DOT offices. Figure 2 illustrates how timing and road condition determine both the type and cost of work required to maintain a road segment).8
The vast majority of DOT capital spending is dedicated to projects on roads and bridges. Accordingly, DOT maintains detailed inventories of the condition of State-owned roads and all bridges. Annual pavement reports offer meticulous data on the condition and use of over 17,000 centerline miles on State routes and the Thruway (leaving the monitoring of local road conditions largely to local government bodies).9
Poor quality roads and bridges are spread throughout the State. (See Table 1.) While Long Island roads and bridges are generally in the best condition of any region in the State, Long Island is allocated $1.5 billion in the current capital plan. The North Country, Mohawk Valley, and Central New York regions, meanwhile, are slated to receive $1.2 billion combined.10 Although traffic is higher on Long Island roads and bridges, those three upstate regions have approximately 22 miles of poor roads for each mile of poor roads on Long Island.11

The State’s pavement data reports present detail on the pavement condition, ride quality, the presence of ruts and cracking in pavement, and the year that work was last completed on individual segments of roadways. In accordance with the requirements of the Governmental Accounting Standards Board (GASB), the State’s Comprehensive Annual Financial Report reports the condition of transportation assets. On a 1 to 10 rating scale of pavement condition, DOT has set a goal of maintaining roads at an average between 6.7 and 7.2; State roads averaged 6.92 in fiscal year 2016.
The condition and use of the State’s more than 17,000 bridges is similarly compiled. Both the DOT and the Federal Highway Administration assess bridge condition and assign numerical and qualitative ratings to the bridges. New York’s bridges are generally in decent condition, with 11.2 percent of bridges graded as structurally deficient.12 Bridge condition is also reported in accordance with GASB rules. On a 1 to 7 rating scale for bridges, the DOT has set a goal of maintaining bridges at an average rating of 5.3 to 5.6. Ratings for the bridges, in fiscal year 2016, averaged 5.3.13
The reports, on pavement and bridge condition, are thorough, detailed, and updated annually; however, one limitation is that the condition data are not linked to the projected costs of maintenance or rehabilitation.
How is the condition of a bridge classified?
All bridges are classified in accordance with federal standards, and receive one of the following ratings:
- Not Structurally Deficient: These bridges are in sound physical condition and are adequately designed to accommodate traffic volumes.
- Structurally Deficient: These bridges are in need of repairs based on engineering assessments. They are not necessarily unsafe, but are in need of the most immediate structural repairs or reconstruction.
- Functionally Obsolete: These bridges are not in need of immediate repairs, but are considered obsolete because of non-structural deficiencies such as deck size that is unable to accommodate traffic adequately. A bridge which meets the criteria for structurally deficient and functionally obsolete ratings (e.g. in poor condition and too small) will be classified as structurally deficient.
Identifying Resources Available for the Capital Improvement Plan
In order to assess how much work can be undertaken to address capital needs, the State has to determine the resources that are available.
State transportation and transit capital projects are financed through a variety of sources: federal funds, State pay-as-you-go funds, and State bonds14 The federal amount has recently averaged $2 billion.15 The DOT gets a large share of its pay-as-you-go resources from the Dedicated Highway and Bridge Trust Fund, which pools receipts from various taxes and fees, such as those on motor fuels, motor vehicles, and petroleum businesses.16 The remaining funding is derived through the issuance of bonds, and the amount of borrowing dedicated to transportation is determined within the context of statewide debt limits.17 With limited new debt capacity available, slower than forecasted economic growth would lead to a lower debt cap, preventing the State from making all of its planned investments, or increasing taxes or fees absent an increase in federal funding.18
Developing a Capital Improvement Plan
Capital projects can be prioritized after goals and available resources have been established. The State’s existing capital plan for fiscal years 2016 through 2020 was outlined in an MOU that was negotiated and signed by representatives of the Governor, the Assembly, and the Senate. The MOU for 2016 through 2020—although developed more than a year late—provides regional information, project codes, and projected costs and execution dates for most programs.19
The existing MOU strays from the DOT’s asset management practices by allocating funds based on agreements between elected leaders rather than the asset management strategies outlined in the TAMP.20
The plan suffers from three important shortcomings:
- First and foremost, the plan is not properly guided by asset condition and need. Based on the information in the plan, it is unclear on what basis projects are included in the plan, and which objectives the projects are intended to meet.
- The most recent capital program was released after budgets for two of the five years– 2016 and 2017– were enacted. The capital program was negotiated as part of the fiscal year 2017 State budget process that attempted to achieve “parity” with the Metropolitan Transportation Authority (MTA) capital plan levels.21 The ensuing fiscal year 2018 budget added $130 million in capital funding, allocated to projects outlined by legislative leaders– funding that could be labelled “transportation pork.”
- Significant pieces of funding were left unallocated and unidentified, hindering transparency and accountability. Of the $21 billion available for the 2016 through 2020 capital program, $3 billion was allocated ambiguously to “statewide” projects and $6.5 billion was left out of project lists entirely.22
Implementing the Capital Plan
Implementing the capital plan requires authorizing funding, executing projects, maintaining assets, and monitoring performance.
The budget is accompanied by a Capital Program and Financing Plan (CPFP), which lays out sources and uses of funding for capital programs in the DOT budget.23
The DOT also updates a project database for on-going and planned projects, which tracks the cost, status, and location of projects. Using the DOT Projects Interactive, New Yorkers can search geographically, or by project identification number, for 1,820 completed, ongoing, and future DOT projects. For each project, the DOT database lists status, schedules, and cost information.24 This project catalog is worthy of positive marks, and can be further improved by presenting an aggregate picture of the DOT’s performance in a “dashboard” format, which would increase the flexibility of the existing DOT data by allowing the public to sort and view information on multiple projects simultaneously. The DOT should also report on its overall performance in implementing projects in the capital program on time and on budget.
Over the course of the five-year capital plan, unanticipated events will occur. Things such as adverse weather events, technological improvements, economic shifts, or changes in federal policy will require new investments and make existing plans to some extent obsolete. However, the State does not currently have official procedures to allow for incremental changes in the five-year plan. A statutorily defined amendment process would grant flexibility to address major system and financial shocks, while preventing a return to ad hoc political forces determining the allocation of the State’s capital funding.
Conclusion and Recommendations
The DOT capital planning process aligns with best practices in certain ways– namely the cataloguing of road and bridge conditions, the assessment of debt capacities, the crafting of a transportation asset management plan, the posting of project statuses online, and the timely passing of State budgets. However, the capital planning process for DOT resources lacks many important capital planning steps such as defining visions and goals, linking asset condition to costs, and authoring an objective capital program.
The most recent five-year DOT capital program was not based on a thorough of analysis of State transportation needs, but instead linked DOT funding to that of the MTA. It was also fifteen months tardy, and left much of the projected capital spending unidentified or unallocated. The State did not specify visions and goals for 2016-2020, and other areas of the process were inadequate and/or disjointed. The 2016-2020 Plan highlights the need for the establishment of a more data-driven capital planning process.
The next five-year capital plan for DOT will cover the period of fiscal years 2021 through 2025 (April 1, 2020 through March 31, 2025). State officials should codify in statute a process to formally set forth appropriate capital planning procedures for DOT assets. A suggested framework for this process is:
- October 1, 2019 - An update of the DOT’s capital program’s strategies and goals. This document should outline the goals of the system over the upcoming five-year period, including the desired condition of existing assets, major initiatives to be prioritized, contingencies for adverse weather events, and other programmatic considerations.
- November 15, 2019 - A needs assessment highlighting the condition of the assets, and the projected costs associated with maintaining these assets and making other improvements. This document will link the condition of assets to costs, and will be informed by the goals set forth in the capital program described above.
- January 2020 - A proposed project list, with funding identified, which will accompany the Governor’s proposed budget. This document will list the capital projects to be undertaken, and identify all costs including, construction, engineering, and administration. This will help elected officials negotiate funding levels at the start of the five-year capital period. The proposal will outline proposed financing sources in line with the Capital Program and Financing Plan, and will summarize consideration of new revenue sources for pay-as-you-go financing.
- May 2020 - An enacted capital plan and project list for DOT projects including all costs contained in the State’s enacted Financial Plan. This document will include the projects that are planned to be completed during fiscal years 2021 to 2025, including assigned project identification numbers where possible, and information on uses of funds for purposes other than direct project implementation, such as engineering and administration.
- January 2021, and continuing annually with each Executive Budget, the DOT should reproduce its list of projects. This document will enable the Legislature, relevant stakeholders, and the public to track projects. The updated project list will include original project completion dates and costs, and note any amended completion dates and costs.
- October 1, 2022 - A status report on projects included in the enacted five-year capital plan. This document will update the status of projects and will compare the progress of capital plan implementation relative to the goals included in the original plan. It is appropriate for the DOT to make intermittent amendments to the project list, but any changes should require notification to the Legislature.25
If the recommended changes are implemented, legislative and executive leaders will have a capital planning process that is commensurate with the importance of DOT capital assets.
Download Report
Bumpy Road: Transportation Capital Planning in New York StateFootnotes
- The New York State Department of Transportation owns approximately 8,000 of the State’s bridges and 15,000 centerline miles of roads. DOT capital funding includes state and federal funds which makes improvements on State-owned assets and other assets, and provides funding to local governments and others to finance transportation capital projects. See New York State Department of Transportation, “Pavement Management Unit” (accessed August 8, 2017), www.dot.ny.gov/divisions/engineering/technical-services/pavement-management; US Department of Transportation Federal Highway Administration, “Bridges & Structures” (accessed April 13, 2017), www.fhwa.dot.gov/bridge/nbi/ascii.cfm; New York State Department of Transportation, “New York State Highway Bridge Data” (accessed April 13, 2017), www.dot.ny.gov/main/bridgedata; US Department of Transportation, State Transportation Statistics 2015, p. 14, www.rita.dot.gov/bts/sites/rita.dot.gov.bts/files/STS_2015.pdf; US Department of Transportation Federal Aviation Administration, “Airport Data & Contact Information” (accessed May 23, 2017), www.faa.gov/airports/airport_safety/airportdata_5010.
- New York State Division of the Budget, FY 2018 Enacted Capital Program and Financing Plan (May 2017), p. 17, www.budget.ny.gov/pubs/archive/fy18archive/enactedfy18/FY2018EnactedCPFP.pdf.
- Maria Doulis, Planning After PLANYC: A Framework for Developing New York City’s Next Ten-Year Capital Strategy (Citizens Budget Commission, December 2013), p. 2, https://cbcny.org/sites/default/files/media/files/Planning%20After%20PLANYC.pdf.
- New York Works Taskforce, State of New York Statewide Capital Plan (May 2013), p. 93, www.budget.ny.gov/pubs/press/2013/statewideCapitalPlan/StatewideCapitalPlanFY2014-23.pdf
- New York State Department of Transportation, Strategies for a New Age: New York’s Transportation Master Plan for 2030 (Summer 2006), www.dot.ny.gov/portal/page/portal/main/transportation-plan/repository/masterplan-111406.pdf.
- New York State Department of Transportation, Capital Program Proposal 2010-2015 (October 2009), www.dot.ny.gov/programs/repository/Capital%20Program%20Proposa%202010-2015.pdf
- Streetsblog, State Fiscal Year 2013-14/2014-15 Transportation Capital Program (March 2013), accessed July 20, 2017, www.streetsblog.org/wp-content/uploads/2013/04/2013_SFY_MOU_transpo.pdf.
- For example, the TAMP shows that the maintenance of road surfaces relies on scheduling the work in the appropriate window of opportunity, such as when it is necessary to completely rehabilitate a road rather than patch it. In this way, the best decision is not as simple as periodic repaving of the worst roads. Some roads may be repaved, while worse roads await a fuller reconstruction at a later date. Timing also dictates the type of work – and therefore the cost of work – required to maintain a road. See New York State Department of Transportation, New York State DOT Transportation Asset Management Plan Draft (May 2014), p. 5-1, www.tamptemplate.org/wp-content/uploads/tamps/023_newyorkstatedot.pdf
- The pavement data report includes 15,123 centerline miles of State-owned roads and 2,457 centerline miles of non-State roads. The non-State roads included in pavement data reports are segments owned by local governments but numbered as State routes for continuity. See: New York State Department of Transportation, “Pavement Management Unit” (accessed April 12, 2017), www.dot.ny.gov/divisions/engineering/technical-services/pavement-management.
- See Patrick Orecki, “Parity” for State Transportation Projects (Citizens Budget Commission, March 2017), Table 2, https://cbcny.org/research/parity-state-transportation-investments.
- Poor pavement is defined as a surface rating of 5 or less on centerline miles in the 2014 Pavement Data Report. See New York State Department of Transportation, “Pavement Management Unit” (accessed August 8, 2017), www.dot.ny.gov/divisions/engineering/technical-services/pavement-management.
- US Department of Transportation Federal Highway Administration, “Bridges & Structures” (accessed April 13, 2017), www.fhwa.dot.gov/bridge/nbi/ascii.cfm; New York State Department of Transportation, “New York State Highway Bridge Data” (accessed April 13, 2017), www.dot.ny.gov/main/bridgedata; US Department of Transportation Federal Highway Administration, “2010 Status of the Nation’s Highways, Bridges, and Transit: Conditions & Performance” (November 7, 2014), https://www.fhwa.dot.gov/policy/2010cpr/execsum.cfm#c3h.
- Office of the Comptroller of the State of New York, Comprehensive Annual Financial Report for the Fiscal Year Ending March 31, 2016, p. 26, www.osc.state.ny.us/finance/finreports/cafr/2016cafr.pdf.
- New York State Division of the Budget, FY 2018 Enacted Capital Program and Financing Plan (May 2017), p. 42 https://www.budget.ny.gov/pubs/archive/fy18archive/enactedfy18/FY2018EnactedCPFP.pdf.
- Federal funding is a source of uncertainty for DOT. See City & State, “Agency Focus: NYS DOT” (September 29, 2014), https://cbcny.org/research/agency-focus-nys-dot.
- New York State Division of the Budget, FY 2018 Enacted Capital Program and Financing Plan (May 2017), p. 306 www.budget.ny.gov/pubs/archive/fy18archive/enactedfy18/FY2018EnactedCPFP.pdf.
- Since fiscal year 2001, total debt outstanding is capped at 4 percent of State personal income, with debt service costs capped at 5 percent of the State budget. The outstanding debt cap is predicated on a percentage of total personal income, and the Division of the Budget anticipates growth of approximately 4.5 percent annually. The State remains under its outstanding debt limit by a slim margin in the fiscal year 2018 enacted capital plan and by fiscal year 2022, debt outstanding is projected to reach $59.5 billion, which is just below the projected cap of $60 billion. Although projections indicate the State will hit the cap in the out-years, past experience indicates that the State may not actually exhaust debt capacity. For example, the fiscal year 2014 budget projected remaining debt capacity of just $772 million by fiscal year 2017. By the end of fiscal year 2017, the actual remaining debt capacity was $6.2 billion. See New York State Division of the Budget, FY 2018 Enacted Capital Program and Financing Plan (May 2017), p. 20, www.budget.ny.gov/pubs/archive/fy18archive/enactedfy18/FY2018EnactedCPFP.pdf.
- Increased vehicle registration fees, tolls, or vehicle miles travelled taxes are possible options for generating funding to fund transportation capital investments. See Jamison Dague, More Than Fare: Options for Funding Future Capital investments by the MTA (Citizens Budget Commission, March 2015), https://cbcny.org/research/more-fare.
- New York State Department of Transportation, State Fiscal Year 2015-16/2019-20 Transportation Capital Program (July 2016), www.dot.ny.gov/programs/capital-plan/repository/SFY-2015-16_2019-20-Transportation-Capital-Program.pdf.
- This reversal in steps was criticized by many lawmakers who contested that voting on the budget without a list of projects was inappropriate. See Nick Reisman, “Lawmakers Grill DOT Officials for Infrastructure Funding in State Budget,” Time Warner Cable News (January 21, 2016), www.twcnews.com/nys/capital-region/news/2016/01/21/lawmakers-grill-dot-officials-for-infrastructure-funding-in-state-budget.html.
- Patrick Orecki, “Parity” for State Transportation Projects (Citizens Budget Commission, March 2017), https://cbcny.org/research/parity-state-transportation-investments
- Patrick Orecki, “Parity” for State Transportation Projects (Citizens Budget Commission, March 2017), https://cbcny.org/research/parity-state-transportation-investments
- New York State Division of the Budget, FY 2018 Enacted Capital Program and Financing Plan (May 2017), www.budget.ny.gov/pubs/archive/fy18archive/enactedfy18/FY2018EnactedCPFP.pdf
- For example, the detail on Phase 2 of the Route 17 to Interstate 86 conversion in Binghamton – one of the State’s largest active roadway projects – shows that the four-year $154 million project is currently on time and on budget. See New York State Department of Transportation, “Projects in Your Neighborhood” (accessed May 22, 2017), www.dot.ny.gov/projects.
- The DOT regularly updates a similar project list related to projects which use federal funding. See New York State Department of Transportation, “STIP Project List and Data Download” (accessed April 13, 2017), www.dot.ny.gov/programs/stip/stip-project-rpt.