Financing PATH
Options for Deficit Reduction
Established in 1921 through a compact sanctioned by Congress, the Port Authority of New York and New Jersey (PANYNJ) is a bi-state agency dedicated to developing the region’s trade and commercial infrastructure. Centered in New York Harbor, the Port District encompasses more than 1,500 square miles in New York and New Jersey including the region’s main waterways, the five counties of New York City, portions of nine counties in New Jersey, and three counties in suburban New York State. The outline of this area is defined in Article II of the compact with specific points described by their latitudes and longitudes.
PANYNJ consists of 12 commissioners—six from the state of New York, at least four of whom shall be residents of New York City, and six from the state of New Jersey, at least four of whom shall be residents within the New Jersey portion of the district. Members are chosen by their respective states in the manner and for the term determined by their respective state legislatures. The Authority constitutes a corporate and political body with the power to purchase, construct, lease, and operate any terminal or transportation facility within the Port District. Today, the Authority extends beyond the traditional boundaries of the Port District, managing operations at airports in Atlantic City, New Jersey and Newburgh, New York.
Through its marine terminals, interstate bridges and tunnels, transit system, airports, bus terminals, and real estate holdings, which include the World Trade Center, PANYNJ builds and maintains assets critical to the commercial well-being of the region. The agency protects and promotes commerce in the Port District by undertaking projects with regional benefit that would otherwise go unfunded. However, the agency’s management has become a source of controversy, elevating tensions between the Authority’s patron states and raising questions about PANYNJ’s ability to maintain and improve infrastructure crucial to the region’s economic vitality.
With a focus on the fiscal stewardship of the agency, the Citizens Budget Commission (CBC) established a trustee research committee to analyze PANYNJ’s budget processes, fiscal outlook, and long-term strategy. At the committee’s first meeting in February 2013, trustees analyzed each of its five major lines of business: air terminals, tunnels and bridges, the Port Authority Trans-Hudson (PATH) transit line, marine terminals, and commercial real estate. This analysis showed that while the agency does not always generate an annual profit, two of its major lines—air terminals and bridges and tunnels—yield significant annual operating surpluses. These surpluses are used to mitigate losses in other business lines.
The committee decided to concentrate further study in two areas: (1) improving PANYNJ planning and budgeting procedures and (2) identifying and advocating for policy changes to promote the fiscal viability of the PATH and the marine terminals business lines.1 This report examines PATH, which incurs repeated annual losses, accumulating to more than $3.8 billion from 2004 to 2013.2 The report’s four sections provide essential background information, analyze PATH’s recent financial performance, present projections of future performance absent policy changes, and recommend new policies to improve PATH’s long-term financial outlook.
Background
PATH’s beginnings trace back to 1873, when the Hudson Tunnel Railroad Company broke ground on a steam train tunnel between Jersey City and Manhattan. After several stops and starts, fatal accidents, and at least one bankruptcy, the tunnel remained unfinished more than 25 years later. In 1902, William Gibbs McAdoo and Charles Jacobs acquired the project and over the next six years completed two sets of under river tubes for train traffic. In 1908, the Hudson and Manhattan Railroad (H&M) opened for business as a privately-owned railroad connecting three major railroads in northern New Jersey—Lackawanna, Erie, and Pennsylvania—to New York City.
The H&M tunnels ran between Hoboken and Sixth Avenue at 19th Street in Manhattan and between Jersey City and what became the Hudson Terminal in lower Manhattan.3 Despite the construction by the Pennsylvania Railroad in 1910 of the North River Tunnels and Pennsylvania Station in midtown Manhattan, the H&M thrived. By 1925, the H&M had expanded in Manhattan from 19th Street to 33rd Street and in New Jersey west to Newark, and in 1929, the system moved more than 300,000 passengers per day.4
The H&M entered a period of decline with the beginning of the Great Depression and the opening of PANYNJ’s Hudson River automobile crossings: the Holland Tunnel in 1927, the George Washington Bridge in 1931, and the Lincoln Tunnel in 1937. By 1950, ridership had fallen below 165,000 passengers per day; in order to stay solvent, management chose to defer maintenance, and the system deteriorated. In 1954, H&M declared bankruptcy.5
New Jersey elected officials identified PANYNJ as the source of the H&M’s woes and pressured the agency to help resuscitate the failing railroad. PANYNJ studied the issue; however, it recommended against taking over the system because it was not self-sustaining, a prerequisite for the Authority’s management at the time. The New Jersey legislature then proposed that PANYNJ subsidize the system by purchasing new rail cars and leasing them to the H&M at favorable rates. Alarmed at the precedent this would set, the Authority offered to acquire the H&M as long as the agency was protected from any future involvement with commuter rail projects. New York officials refused to approve the acquisition, objecting to PANYNJ diverting resources to a commuter railroad serving primarily New Jersey residents. The stalemate was broken with a deal that added a project sought by New York interests. Acquisition of the H&M was tied to a PANYNJ commitment to build a new World Trade Center at the site of the Hudson Terminal. The deal was approved in legislation that passed in both states in 1961.6
The Authority purchased the bankrupt railroad and its downtown Manhattan terminal buildings for $16 million.7 PANYNJ created the subsidiary, PATH, invested in a new fleet of railcars, system upgrades, and renovations to stations, and it restructured fares and reduced service. The World Trade Center (WTC) broke ground in 1966, PATH opened a new lower Manhattan terminal at the WTC site in 1971, and the WTC opened in 1973. PATH opened the Journal Square terminal, a station and office building in Jersey City, in 1975.

The terrorist attacks on September 11, 2001 destroyed the WTC and the PATH terminal beneath it. Since then the PANYNJ has been financing the building of office towers to replace the WTC, and has restored PATH service to lower Manhattan via a temporary PATH terminal, opened in 2003. A permanent terminal is under construction and is planned to open in 2015.8 The cost of the new terminal and related amenities is estimated at more than $3.9 billion.9
Superstorm Sandy in October 2012 disrupted PATH operations and damaged its facilities. The flooding caused suspension of all service for nine days; restoration of full service to Midtown was accomplished in stages over the next 64 days; restoration of service to lower Manhattan began after 66 days and was fully accomplished in 92 days.10 Flooding caused by the storm surge resulted in damage to power substations, switching stations, and track, as well as elevators and escalators at PATH stations in Hoboken, Jersey City, and at the World Trade Center. Approximately two to five miles of track in tunnels and open areas were damaged by floodwaters, in some cases requiring PANYNJ to power wash entire segments of the system.11
The Current System
PATH consists of 14 miles of track, 13 stations, and a fleet of 340 cars. PATH offers four lines of service: between Newark and the World Trade Center in lower Manhattan; between Hoboken and the World Trade Center; between Hoboken and midtown Manhattan at 33rd Street; and between Journal Square and midtown Manhattan. (See Figure 1.)
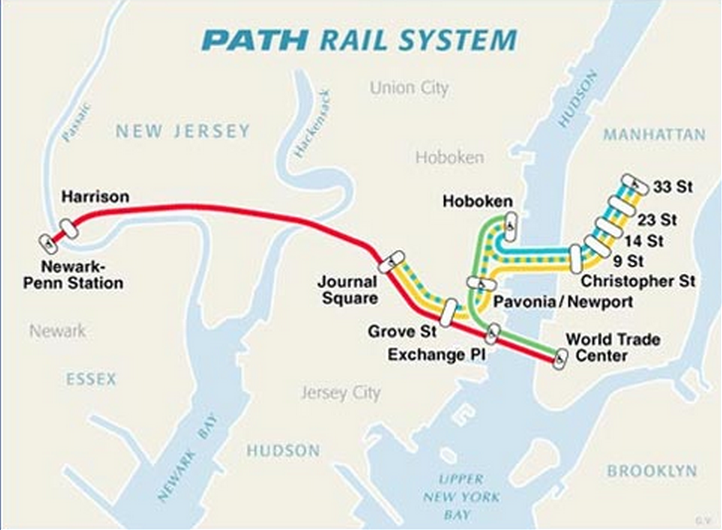
On a typical weekday, 38 trains consisting of eight cars each run simultaneously on the four service lines. The line connecting Newark and the World Trade Center runs 24 hours a day, 365 days a year; the other three lines operate only Monday through Friday from 6 a.m. to 11 p.m.12 However, on weekends and overnight, a line runs from Journal Square to midtown Manhattan via the Hoboken station.
The system’s seven stations in New Jersey directly serve Newark, Harrison, Jersey City, and Hoboken. However, many passengers using these stations do so as part of a trip involving another mode of transport. These include the New Jersey Transit (NJT) commuter railroads, light rail, and local bus routes in New Jersey, and auto trips to the PATH stations. This secondary service area includes 13 counties in northern and central New Jersey. In addition, portions of Rockland and Orange counties in New York are served by NJT’s Port Jervis Line, which connects to PATH stations. This expansive view of PATH’s service area makes it a link to New York City from Rutgers University, the New Jersey Institute of Technology, MetLife Stadium, the Prudential Center, and Red Bull Arena in Harrison. It also connects, via NJT, lower Manhattan with the AirTrain serving Newark Liberty Airport.
Fare Policy
When PANYNJ acquired the H&M railroad in 1962, a single-ride fare was 15 cents. During the next four decades the fare was increased only four times at uneven intervals, reaching $1.50 in 2001 (See Figure 2.) An increase in 2008 brought the fare to $1.75. Then in 2011 the PANYNJ Board authorized four annual increases of 25 cents each bringing the fare to $2.50 in October 2013 and $2.75 in October 2014.13 Measured in inflation adjusted dollars, the fare reached as high as $2.18 in 1987 and just surpassed that peak in 2012.

It is important to note that PATH offers discounted fares to regular riders and most customers do not pay the single-ride fare. PATH offers 10-trip, 20-trip, and 40-trip SmartLink Cards at a 60-cent discount per ride. One-day, 7-day and 30-day SmartLink unlimited passes are also available. One-day passes cost $7.50, 7-day passes cost $26, and 30-day passes cost $80.14 Individuals older than 65 are entitled to a reduced single-ride fare of $1.00. The effect of these discounts is that the average revenue per ride is well below the single-ride fare. In 2013 average revenue per ride was $1.94 or about 84 percent of the average nominal single-ride fare during the year. (See Figure 3.) In constant dollars revenue per ride peaked after the 2001 fare increase and then exceeded that level as the multiple year increases authorized in 2011 were phased in. Recent fare increases have buoyed the recovery ratio—the share of operating expenses and capital-related expenses covered by fares—to 27 percent in 2013, but that level is below its 2001 level.

Ridership Trend
Over the past two decades ridership has been on a long-term path of modest growth, but economic recessions temporarily reversed that trend and ridership experienced serious drops due to the 2001 terrorist attacks and Superstorm Sandy. (See Figure 4.) During the national and regional economic boom from 1994 to 2000, average weekday ridership increased 23 percent from 206,900 to 255,000. The subsequent recession and, more importantly, the service closures following the 2001 terrorist attacks, caused a drop of 37 percent to 160,000 by 2003. Restoration of service and regional economic growth brought ridership back above 250,000 in 2008, but the economic downturn in 2009 and the effect of Superstorm Sandy kept ridership below that level in subsequent years. In 2013 ridership was 244,000. If the effects of the two catastrophic events (the 2001 attacks and the 2012 storm) are excluded, ridership has grown over the past 20 years at an average annual rate of 1.1 percent, despite the lack of expansion in routes or stations.

Recent and Planned Capital Investments
In response to long-term growth in ridership and in an effort to improve the quality of service, PANYNJ has made and plans to continue substantial capital investments. These investments include ongoing repairs and improvements to keep the system in state of good repair, but also involve four additional types of projects—system modernization, selected station enhancements, an extension to the Newark Airport AirTrain, and efforts to make the system more resilient to major storms.
Modernization. The modernization program has three stages. The first was replacement of rolling stock, which had an average age exceeding 40 years. In 2008, PATH authorized $499 million for 340 new railcars, introducing them in phases between 2009 and 2011. The new cars have three sets of doors, as opposed to two, and can carry more passengers with a longitudinal seating system. Moreover, they have the capability to run in 10-car sets, as opposed to current eight-car configurations.
The second component is a Signal System Replacement program. This program is bringing PATH’s signal system to a state of good repair, and introduces new technology to promote safe and reliable service. When complete in 2016, the system will allow trains safely to run closer together, allowing more trains to operate during rush hours.15
The third component is the installation of Automatic Train Control (ATC). The ATC will replace the current system, put into service prior to World War II, and allow for coordination of train movements via a computer-controlled radio network. In the future, it is possible that the number of conductors on trains may be reduced, or eliminated, by adoption of this type of train control. The ATC is expected to be operational in 2017. PATH expects the full modernization program will increase capacity 20 percent.16
Station Enhancements. The Harrison Station and the Grove Street Station are slated for major improvements. The Harrison Station, built in 1936, is nearing its capacity and regularly becomes overcrowded during rush hours. Planning for the enhancement project began in 2008, but stalled while PANYNJ studied whether to renovate or replace the station. In August 2013, PANYNJ announced it would move forward with the replacement. It is expected to cost $249 million and be completed in 2018. The project includes new station entrances, widened stairs, disability access, and extended train platforms that accommodate 10-car trains. The current station will continue to operate via temporary platforms while new headhouses are constructed. While real estate transactions related to the project (but unassociated with PANYNJ) have come under scrutiny in recent months, construction is expected to continue as planned.17
The Grove Street Station project also has been in planning since 2008. This $192 million project will modernize the station, extending platforms to allow for 10-car train operations, installing elevators for compliance with federal standards for access for the disabled, and implementing egress requirements necessary to meet future ridership forecasts. The full project does not have a planned completion date, though the installation of elevators is due by 2018.
Extension to Newark Airport. In September 2012, PANYNJ studied the feasibility of extending PATH from its current western terminus at Newark’s Penn Station to the AirTrain at Newark Liberty International Airport. The capital plan released in February 2014 includes the project, consisting of an additional mile and a half of track, a new station, platforms, and the infrastructure necessary to connect PATH to the AirTrain. The project will also fund changes to Newark Penn Station and the replacement of the rail storage yard.
The project is expected to cost $1.5 billion, but PANYNJ intends to commit only $1.0 billion. The Authority will seek a public-private partnership to build a parking garage in the vicinity of its current AirTrain station so that non-aviation commuters may utilize PATH for access to Manhattan. The description in the capital plan lists other project stakeholders including Amtrak, NJT, and the New Jersey Department of Transportation, suggesting other entities may be expected to finance a portion of the project cost. The capital plan does not indicate a project phasing, but it forecasts completion in 2024. The current five-year capital plan provides limited spending authority, less than $25 million per year for 2014 to 2016; then $275 million per year in 2017 and 2018.18
Storm Repair and Resiliency. PANYNJ estimates the total value of damage from Superstorm Sandy to its facilities to be $2.2 billion; PATH suffered more than half of this damage.19 The Authority expects to spend $1 billion on Sandy-related capital projects over the next 10 years, 64 percent of which will be dedicated to PATH. During the first five years (2014-2018) the agency’s capital plan allocates $474 million for such projects at PATH; a major portion of these costs will be covered through insurance proceeds or federal aid.20 These projects include the replacement and upgrade of power substations, switching stations, elevators, and escalators damaged in the storm. As salt residue, which is corrosive and can shorten the lifespan of many components, resurfaces in the areas flooded by the storm surge, the residue will be power washed to eliminate salt deposits. As part of this storm mitigation, PATH will prevent future salt-water intrusions and minimize future damage. Long-term resiliency projects are still in planning and design, but short-term measures, such as stop logs, bin blocks, and sand barriers, have been prepared and can be deployed if a similar weather emergency strikes.21
Figure 5 summarizes the planned investments for PATH during the current five-year capital plan. The total of $1.65 billion is spread unevenly over the period, ranging from about $200 million to $300 million annually in the first three years and then jumping to $652 million and $542 million in the last two years due primarily to the large sums for the Newark Airport extension. The expansion project and the two station enhancements account for 41 percent of the total; storm resiliency projects account for another 14 percent. State of good repair and certain mandatory projects account for 38 percent, and security needs another 7 percent.

Financial Performance
When the Interstate Commerce Commission granted PANYNJ’s application for a certificate to operate PATH, it said:
“If the Port Authority, through the applicant, is willing to take over the operation of the line for the benefit of the metropolitan area population of New Jersey and New York, knowing that the operation will probably continue to incur deficits, it should be permitted to do so. In view of the present operating deficits, it is doubtful that the operation of the line could long continue otherwise.”22
The Authority knew it would be subsidizing the transit line, most likely indefinitely, and PATH has routinely posted a loss since then. However, it is not inevitable that the deficits be as large as they have become and that they be covered in the manner now used by the PANYNJ. This section describes the growing nature and size of the deficits; the next section indicates how large the deficits may become in the future, and a final section recommends alternative policies for dealing with the deficits
Over the past 10 years, PATH’s annual losses grew from $294 million in 2004 to $383 million in 2013, an average annual increase of 3 percent. (See Table 1.) By definition deficits are the difference between revenues and expenditures, and each of these elements should be examined.

Revenues
The preponderance of PATH’s revenues—an estimated $143 million of its $151 million in 2013—come from fares; the other 5 percent of revenue comes from advertising on its trains and stations, proceeds from retail leases at the Journal Square Transportation Center in Jersey City, and other payments related to parking facilities and bus services.23 Fare revenues are a function of ridership and fare policy.
Revenues grew over the past decade at an average annual rate of 6.5 percent, but the pace was uneven. The increase of 11.8 percent in 2008 was at least partially due to the rise in single-ride fares from $1.50 to $1.75, while the 4.5 percent decrease in the following year, as well as the modest 3.4 percent growth in 2010, are largely attributed to slow growth in ridership resulting from the economic recession.24 Increases of 10 percent, 11 percent, and 12 percent from 2011 to 2013 were fueled by growing ridership and fare increases.

Expenses
PATH’s expenses are of two types—operating and capital related. In 2013 operating expenses comprised 52 percent of the $610 million total and capital related expenses the remainder. Total expenses grew at an annual average rate of 5.4 percent over the past decade, with capital expenses (6.7 percent) outpacing operating expenses (4.4 percent).25
Three unusual aspects of the trend in operating expenses should be noted. First, operating expenses peaked at $386 million in 2010, a 28 percent increase over the previous year. This spike was due to a one-time write-off of capital expenditures for redevelopment of the World Trade Center site and PATH terminal.26
Second, expenses in the most recent years may be artificially low due to the expiration of union contracts and the absence of agreement for subsequent compensation increases. Of PATH’s 1,220 employees, all but 168 are covered by collective bargaining agreements with one of 10 unions. Contracts for all 10 unions expired between February 2011 and October 2012. The previous contracts spanned six years and included 3 percent annual raises.27 While the absence of new contracts has kept employees at the previous pay scale, PANYNJ accrues a labor reserve for expired contracts. The agency-wide assumption of 3 percent growth is consistent with the annual raises that unionized PATH employees have received previously. However, newly negotiated contracts could impose additional substantial one-time costs to cover any retroactive settlements above this amount as well as increase recurring future labor costs with annual increases more than 3 percent.
Third, maintenance expenses (a component of operating expenses) in 2013 may be abnormally low. In 2013, maintenance costs were estimated to be 17 percent lower than in 2012.28 This may be a result of maintenance project delays caused by Superstorm Sandy, as well as the reallocation of maintenance projects to the Sandy-related capital program. It is unclear whether this reduction is indicative of future recurring savings. (For further analysis of PATH’s operational efficiency and per-unit cost measure comparison with other heavy rail systems in the U.S. see Appendix.)
Download Report, Including Appendices
Financing PATH: Options for Deficit ReductionCapital-related spending has two components—depreciation and interest on long-term debt. Depreciation is the larger of the two items, but interest has been growing more rapidly.
Depreciation grew at an average annual rate of 4.6 percent since 2004, but in an uneven pattern due to two accounting decisions relating to the temporary WTC terminal and the replacement of the rail car fleet. First, PANYNJ accelerated the depreciation of the temporary terminal over the 2004-2006 period. Accordingly, depreciation was higher than trends would have suggested in those years, and then deprecation dropped notably in 2007.29 Second, replacement of the rail car fleet was accompanied by removing the remaining book value of the old cars in 2006, and greater deprecation due to the value of the new cars coming on line in subsequent years.30 Between 2008 and 2012, PATH depreciation increased from $111 million to $175 million due largely to depreciation of the new railcar fleet.31
Interest expense grew 11.3 percent annually over the 10-year period. Its growth accelerated in recent years. From 2009 to 2013 interest expense more than doubled from $44 million to $110 million. This increase stems from new debt obligations associated with PATH’s modernization program and construction of the permanent WTC terminal.
This analysis does not include capital contributions in its examination of PATH’s financial performance. Though these contributions come from outside sources, they are dedicated to capital construction projects. By their nature, these funds are included in the capital budget, separate from PATH’s operating budget. In 2013, PATH received $317 million in capital contributions, $288 million of which came from the Federal Transit Administration for the Permanent World Trade Center PATH Terminal.32
Financial Outlook
What is the outlook for PATH’s financial condition? In order to address the question, this section develops independent projections of revenues and expenditures for the five-year period 2014 to 2018. The results are summarized in Table 2. Although revenues are projected to increase somewhat more rapidly than expenditures (6.0 percent versus 3.8 percent annually), the absolute size of the annual deficit continues to grow and reaches $531 million in 2018. The analysis underlying this troubling outcome is explained below.

Revenue Projections
As previously noted, PATH’s revenues come predominantly from fares, and fare revenue is a function of ridership and fare policy. Fare policy is the most straightforward element of the equation. PANYNJ’s Board authorized a fare increase from $2.50 to $2.75 for a single-ride in 2014 and similar increases in the discounted fare arrangements. The analysis assumes no additional fare increase in subsequent years. It also assumes the relationship between average revenue per ride and the single-ride fare will remain stable; that is, it assumes no change in the mix of riders in terms of their use of discounted fares.
Projecting the level of ridership is more problematic. The analysis assumes ridership growth of 4.1 percent per year based on PATH’s eight-year annual average growth rate from 2004 to 2011.33 This projection assumes three important trends will continue.
First, the population of Bergen, Essex, Hudson, Middlesex, and Union counties—the five counties closest to New York City and best served by PATH—has grown significantly in recent years. According the Census Bureau’s estimates, the population of these counties increased 5.9 percent between 2007 and 2013 for a gain of more than 208,000 people.34 This growth is more rapid than the statewide average of 2.7 percent over that same period.35
Second, the number of people living in these five counties and working in Manhattan’s central business district (CBD)—a characteristic that makes them a potential PATH user—has increased in recent years. As of 2011 (the latest year for which data are available), about 193,000 people lived in Bergen, Essex, Hudson, Middlesex, and Union counties and commuted to the Manhattan CBD. This represents a 17.5 percent increase from 2006.36
Third, the secondary region that PATH serves is also growing and additional riders will be drawn from those counties. As is the case with the five counties that PATH most directly serves, the number of New Jersey residents working in the Manhattan CBD has increased over the past five years, though at a more modest 17 percent.37 Many people who live outside PATH’s immediate service area use the system to enter Manhattan as one component of their commute. These communities may see additional development, adding to the number of potential PATH users in the region.
Expenditure Projections
For this analysis, separate assumptions are made about operating expenses and capital related expenses. Operating expenses are projected to grow 4.0 percent annually, below the recent 10-year average of 4.4 percent. The assumed increase reflects expectations of future increases in labor costs due to collective bargaining, inflation in costs of non-personnel items, and marginal cost increases due to more ridership. However, increased productivity also is assumed. PATH’s modernization program should lower operating costs. As components are replaced, a newer system may require less maintenance than antiquated infrastructure currently in use. Other capital projects, such as the extension of station platforms to allow 10-car trains to operate and an upgraded signal system may increase capacity at a low marginal cost. Lastly, some of these investments may allow PATH to operate with fewer workers. Together, new rolling stock, a modernized signal system, and a central dispatching station with radio-controlled train operation may allow for fewer staff operating a train in the future.
Interest and depreciation expense projections are based on 2014 budgeted levels with an add-on for planned spending under the 2014-2023 capital plan. PATH’s budgeted depreciation for 2014 is $161 million; added depreciation due to the capital plan assumes new spending authority will begin to depreciate the next year on a straight-line basis over 50 years. PATH’s budgeted interest expense for 2014 is $66 million. Added interest expense from the 2014-2023 capital plan assumes all capital expenditures are funded by debt issued in the same year spending is authorized, and that all new debt consists of bonds with 30-year terms and a 4.5 percent interest rate.
Future Deficits
The net result of the revenue and expenditure projections is growing deficits. The annual deficit rises from $387 million in 2014 to $487 million in 2018. The deficit will equal fully 69 percent of total expenses in 2018.
Policy Options
The prospect of recurring annual deficits in excess of one-half billion dollars ought to prompt consideration of alternatives to current financing policies. The large cross-subsidy PATH requires from more profitable lines of business represents lost opportunities for investments in the agency’s more profitable activities and an inequitable burden on users of the bridges and tunnels. This section presents a framework for designing alternative policies and applies it to the projected financial outlook for PATH.
Recommended Guidelines – The 50-25-25 Formula
In its analyses of the finances of the Metropolitan Transportation Authority, the Citizens Budget Commission (CBC) has recommended a framework for funding mass transit service that is also applicable to PATH.38 The recommended financing policy recognizes all New Yorkers benefit from the New York region’s mass transit system to varying degrees and that all should contribute to its support. The three major sources of revenue for mass transit are: fares paid by passengers who directly benefit from the service; local and state taxpayers generally who benefit from the efficient regional labor market facilitated by the transit system; and cross-subsidies from auto users who get additional indirect benefits from the reduced congestion and pollution that mass transit makes possible.
Accordingly, the CBC suggests a formula—referred to as 50-25-25—to allocate the costs of operating and maintaining mass transit services among the three categories of revenue and the sectors of the public from which they each derive. It is based on these principles:
- Auto user fees should pay for the facilities available to drivers. Therefore, the cost of bridge and tunnel facilities should be funded entirely through tolls and fees paid by the motorists who use them.
- Motorists’ tolls and fees should also generate a surplus large enough to cover approximately one-quarter of the cost of providing mass transit services. The cross-subsidy is justified by the need to compensate for the negative effects of auto use on the environment and the benefits to drivers from the reduced road congestion made possible by mass transit.
- Mass transit users should pay fares sufficient to cover approximately one-half the cost of those services. Riders get a direct benefit, and it is reasonable that they should pay a significant portion of the costs.
- State and local tax subsidies to mass transit should cover at least one-quarter of the cost of those services. The subsidy is justified by the broad economic benefits to employers, workers and shoppers provided by an efficient mass transit system.
The 50-25-25 formula would lead to an equitable and easily understood basis for generating the necessary revenue, but it is not rooted in any precise calculation of benefits. Alternative distributions, such as an equal—one-third, one-third, one-third— formula, might also be justified. The important basic point is that should PATH commit to a consistent funding structure that shares the cost of operating the transit system among all who benefit. This analysis will illustrate the fiscal effects of adhering to such a structure using a 50-25-25 framework and one that divides funding responsibility evenly across the three sources ("equal shares").
Current Policy Versus the Guidelines
Table 3 presents the projected expenditures and revenues for PATH in 2018 under current policy and under policies based on the 50-25-25 formula. Under both scenarios total expenditures, operating and capital-related, are $752 million. The difference is how those costs are covered.

Fare Revenue. Under current policy with no fare increase after 2014, directly generated revenues in 2018 will be $214 million and cover 31 percent of total expenses. In contrast, under the “50-25-25”guideline fare revenue would cover 50 percent of expenses, $350 million, and under the “equal shares” guideline fare revenue would cover 33 percent, $233 million.
In order to reach 50 percent of expenses in 2018 the fare revenue would need to be increased 64 percent above the projected level under current policy. In terms of the single-ride fare, this points to an increase from the projected $2.75 to about $4.50. Assuming discount policies remain the same and the mix of discounted versus full-fare riders also remains the same, then the average revenue per ride would increase from the projected $2.31 in 2018 to $3.78.
Under the “equal shares” guideline, fare revenues would need to be increased 9 percent to reach $233 million, or one-third of total expenses. This would lead to an increase in the single-ride fare of $0.25 to $3.00 and to an increase in average revenue per ride of $0.21 to $2.52.
While fare increases beyond the onescheduled in 2014 may be unpopular, PATH would still represent a value for those traveling between New Jersey and New York. Even using the larger fare increase of the “50-25-25” framework, a nominal fare of $4.50 would still be 50 cents less than the current NJT commuter rail service from Newark and only 50 cents more than from Secaucus Junction. It would also be $1.00 less expensive than NJT’s bus service from Newark but 25 cents more than from Jersey City.39 These comparisons assume that NJT holds its fares at current levels through 2018. Moreover, a round trip to New York City from New Jersey using PATH would still be less expensive than the cost of the same trip via automobile using PANYNJ’s bridges and tunnels, which are scheduled to levy an E-ZPass round-trip toll of $12.50 for a two-axle car during peak hours by 2018.40
In considering these higher fares, it is worth noting that PATH serves a more affluent ridership than many transit systems. According to the latest survey, 44 percent of PATH riders have household incomes of more than $100,000 per year. This share is larger than for the New York subway (36 percent), commuter bus (39 percent), and local bus (20 percent) riders, but behind those utilizing MTA
commuter railroads (60 percent).41
PATH could pursue other changes to make the fare system more equitable. One such change is a distance-based fare system. Distance-based fares, or zone pricing, charges users based on the distance traveled. Compared to flat fares, it increases the farebox recovery ratio from long distance passengers and reduces the penalty that short trips incur. Such a system introduces a level of complexity for operators, who must collect data on passengers when they enter and leave stations, as well as for users. The transit systems in San Francisco and Washington, D.C. use distance-based fare systems, as does NJT bus and commuter rail service.
A second modification is peak pricing. This system charges a premium for users during peak periods most commonly associated with work-related commutes. Depending on how the rates are applied, such a premium can generate more revenue for systems while attracting new, off-peak riders. While time-based pricing structures vary depending on the transit system, the discount ranges between 20 and 40 percent of the peak single-ride fare. Washington, D.C.’s Metro uses peak pricing, as do commuter railroads operated by the MTA and NJT.

Auto Cross-Subsidy. Under current policies PATH incurs substantial deficits. These losses are covered by a cross-subsidy from PANYNJ’s profitable activities operating bridges and tunnels. The “current policy” figure in Table 3 assumes the entire deficit is covered by this cross-subsidy; the 2018 amount is $487 million. This sum is $312 million greater than the $175 million that would be required if the recommended guideline of 25 percent of expenses were followed and $254 million greater than the “equal shares” framework. PANYNJ would be able to retain the difference in toll revenue for other purposes if either of these two guidelines were followed.
Tax Subsidy. The most fundamental difference between current policy and the recommended guidelines is that PATH receives no general tax subsidy while the recommendation calls for a state or local tax subsidy equal to 25 percent of expenses, $175 million by 2018, or one-third of expenses, $233 million in 2018.
Among U.S. public transit systems, PATH is unique in that it does not receive any tax revenue for its railoperations.42 (See Table 4.) Seven of the 10 largest heavy rail systems received more than $233 million in tax subsidies in 2012, ranging from $377 million for the Miami-Dade Transit system to $4.4 billion for New York City Transit.43 Among the 10 largest systems, the tax subsidy covers between 8 percent and 76 percent of reported operating costs. The specific tax structures vary widely, but the most common sources are sales taxes and real estate taxes. The MTA has a regional payroll tax as well as a regional sales tax and other property-related taxes.
Three options illustrate how a tax subsidy could be provided to PATH that raises either 25 percent or one-third of projected expenditures—one using a sales tax and two using different real estate bases. The sales tax option would levy the tax on retail sales in the five counties with the highest number of PATH patrons—Bergen, Essex, Hudson, Middlesex, and Union.44 In the state fiscal year 2013, which ended June 30, 2013, the five counties generated an estimated $49.1 billion in taxable sales.45 Assuming growth of 2 percent in taxable sales per year, fiscal year 2018’s estimated taxable sales would be $54.2 billion. On this base, a tax of 0.32 percent would raise $175 million to dedicate to PATH and a tax of 0.43 percent would raise $233 million. The current statewide sales tax rate in New Jersey is 7 percent, so for the “50-25-25” guideline the new rate in the five counties would be 7.32 percent, an effective increase of 4.6 percent. For the “equal shares” guideline, 0.43 percent increase in the nominal rate to 7.43 percent would equal an effective increase of 6.2 percent. Both rates would be lower than New York City’s rate of 8.875 percent, but higher than surrounding New Jersey counties, which would remain at 7 percent.
With respect to the property tax, the two illustrative options vary in the base to which the dedicated tax would be applied. In one case, the base is property in the same five counties used for the sales tax illustration. For the 2013 tax year, the five counties had a combined market value of nearly $466 billion, which generated $11.2 billion in property tax receipts. The average effective rate was 2.40 percent, but it varied among the counties from 2.160 percent to 4.832 percent.46 To raise an additional $175 million the average effective rate would have to be raised by 0.038 percentage points or 1.56 percent.To raise an additional $233 million the average effective rate would have to be raised by 0.050 percentage points or an effective increase of 2.09 percent. The recent median value for owner-occupied housing units in Hudson County was $360,400; an increase in the effective rate of 0.038 percentage points would be equal to an additional $135 per year in property tax for that household. An increase in the effective rate of 0.05 percent would be equal to an additional $180 per year.47 (See Table 5.)

A second property tax option would extend the base to include the Manhattan CBD south of 60th Street. Because property in this area benefits from the availability of the labor force in New Jersey served by PATH, its inclusion could be justified. In this broader area the combined property market value is $668 billion. The current average effective tax rate is 3.778 percent; the increase necessary to raise $175 million is 0.026 percentage points or 0.94 percent. The increase necessary to raise $233 million is 0.035 percentage points or 1.26 percent.48 Using the previous median home value for Hudson County, an increase of 0.026 percent would be equal to an additional $94 per year in property tax; an increase of 0.035 percent would be equal to an additional $126 per year in property tax.
The property tax levy on a $25 million commercial property in New York City in 2012 was $964,000; the tax on a similarly valued property in Jersey City was $563,000 and in Hoboken was $368,000.49 An effective increase in property tax of 0.94 percent would require an additional $9,084 on the New York City building, $5,305 on the Jersey City building, and $3,468 on the Hoboken building. An effective increase in property tax of 1.26 percent would require an additional $12,112 on the New York City building, $7,073 on the Jersey City building, and $4,623 on the Hoboken building.
Implications for Planning and Governance
The focus of this report is financing policy, but the recommended changes in PATH’s financial structure have implications for how the service is governed and how it is coordinated with the other major agency, NJT, serving the trans-Hudson routes. On a typical weekday morning about 230,000 people enter directly the Manhattan central business from New Jersey.50 Of this total nearly 6 of 10 arrive on a train or bus operated by NJT. A smaller share, 27 percent, arrives on a PATH train. The remainder comes in a car through a PANYNJ tunnel (10 percent) or on a ferry (4 percent). Based on these figures, the PANYNJ is bringing about 37 percent of the total into the central business district, while NJT is transporting about 59 percent. This division among the entities (plus the reliance of NJT buses on PANYNJ tunnels) raises issues of proper coordination. Implementing the recommended changes in financing for PATH could be accompanied by a shift in governance authority and operational responsibility for the rail lines to NJT.In contrast to PANYNJ, NJT is a large-scale mass transit agency. It has a history of acquiring services. Created by the Public Transportation Act of 1979, the agency began operations in 1980 after purchasing Transport of New Jersey, the state’s largest private bus company. Over the next five years, NJT acquired several other bus companies, and in 1983 entered rail service by taking over passenger operations from Consolidated Rail Corporation. NJT also depends heavily on tax subsidies; in 2013 its government subsidies totaled more than $1.2 billion.51 Moreover, as a state agency, NJT is accountable to New Jersey residents through a seven-member Board of Directors appointed by the Governor. This board includes members from the general public and state officials and can make decisions with New Jersey residents, PATH’s primary customers, in mind.
Under such a reconfiguration, PANYNJ would provide the 25 percent auto cross-subsidy to NJT from PANYNJ’s bridge and tunnel revenues, but the dedicated tax subsidy would be allocated to NJT, and NJT would retain the higher fare revenue. If NJT ran the PATH service it would be responsible for fully 86 percent of the commuters from New Jersey to Manhattan’s central business district, making planning and coordination among the services less complex. Any duplicative routes could be consolidated, and service to passengers using both agencies’ services as part of their regular commute could be improved. Future decisions about rail service to Newark Airport could be made from the vantage of one agency fully responsible for that service, rather than being complicated by repetitive services by the two agencies.
In addition to promoting more effective coordination, the transfer of operating responsibility for PATH to NJT better fits the structure of each agency. PANYNJ has no other mass transit operations, does not receive any tax subsidies and seeks to operate only self-sustaining business lines. By jettisoning the rail line, the Authority may focus its resources on its core mission of promoting commerce in the Port District.
Repurposing PATH’s Cross-Subsidy
Whether PATH stays in PANYNJ’s portfolio or is transferred to NJT, a rethinking of the system’s financing policy is appropriate. More equitably financing PATH’s significant annual deficits would enhance its long-term fiscal sustainability. Adopting one of the recommended guidelines ensures that no one group—PATH riders, toll payers, residents, or employers—pays a disproportionate share of the
cost.
Equally important, both the “50-25-25” and “equal shares” formulas would provide PANYNJ with additional resources to pursue its core mission. By 2018 adoption of a new financing guideline could free up as much as $312 million per year from bridge and tunnel revenues to put toward other priorities in the region. Using the $312 million annual savings as a debt service payment could fund an additional $5.1 billion in capital projects, equivalent to 18 percent of the recently adopted 10-year capital plan. New initiatives in the capital plan could include, constructing a one-seat ride to JFK International airport, or expanding rail capacity across the Hudson River.
Download Report, Including Appendices
Financing PATH: Options for Deficit ReductionFootnotes
- On July 16, 2013, CBC sent a letter to PANYNJ Executive Director Pat Foye that recommended improved operating and capital budgeting practices. See: Carol Kellermann, Citizens Budget Commission, letter to Pat Foye, Executive Director, The Port Authority of New York & New Jersey (July 16, 2013), www.cbcny.org/sites/default/files/LETTER_07162013.pdf.
- The Port Authority of New York & New Jersey, Financial Statements and Appended Notes for the Year ended December 31, 2013 (April 4, 2014), Schedule E – Information on Port Authority Operations, p. 90, www.panynj.gov/corporate-information/pdf/financial-statement-2013.pdf; Port Authority of New York & New Jersey, 2012 Annual Report: Mapping a New Direction (2013), Schedule E, p. 95; 2011 edition, Schedule E, p. 91; 2010 edition, Schedule E. p. 92; 2009 edition, Schedule F, p. 89; 2008 edition, Schedule E, p. 90; 2007 edition, Schedule E, p. 94; 2006 edition, Schedule E, p. 92; 2005 edition, Schedule E, p. 73; 2004 edition, Schedule E, p. 85. For web access of all annual report editions, see: www.panynj.gov/corporate-information/annual-reports.html.
- The Hudson Terminal was an underground rail station that served the H&M’s downtown tubes. Above ground, the Terminal consisted of two 22-story structures divided by Dey Street. Together, they formed the largest office building complex in the world at the time of their construction. The Hudson Terminal was the first combination of a terminal station with an overhead office building in New York City. See: Sarah Bradford Landau, Carl W. Conditt, Rise of the New York Skyscraper: 1865-1913 (Yale University Press 1999), pp. 318-367.
- Hudson & Manhattan Railroad, Twenty-First Annual Report of Hudson & Manhattan Railroad Company Year Ended December 31, 1929 (March 14, 1930), p. 5, www.columbia.edu/cu/lweb/digital/collections/cul/texts/ldpd_6282382_000/ldpd_6282382_000.pdf.
- Hudson & Manhattan Railroad Company, Annual Report to Stockholders 1950 (March 7, 1951), p. 7, (accessed February 11, 2014), www.columbia.edu/cu/lweb/digital/collections/cul/texts/ldpd_6282382_000/.
- Jameson W. Doig, Empire on the Hudson: Entrepreneurial Vision and Political Power at the Port of New York Authority (Columbia University Press, 2001), pp. 379-384.
- Although the original price for the H&M and its non-rail property was set at $16 million, tenants of the Hudson Terminal buildings filed suit on the condemnation of their offices. They cited the World Trade Center’s authorization as one that exceeded the bounds for “future development of terminal, transportation and other facilities of commerce” which PANYNJ was directed to do by the 1921 compact. The case reached the Court of Appeals, which in 1967 ruled in favor of the former railroad owners, requiring the PANYNJ to pay $30 million for the railroad and remanded determining the cost for the non-railroad property to the lower courts. PANYNJ settled the latter claim for $11 million, bringing the total cost to $41 million plus interest and ending six years of litigation in 1968. See: The Port of New York Authority, 1968 Annual Report (1969), p. 27, www.panynj.gov/corporate-information/pdf/annual-report-1968.pdf?year=1968.
- The Port Authority of New York & New Jersey, PATH, “History” (accessed February 11, 2014), www.panynj.gov/path/history.html.
- David W. Dunlap, “A Transit Hub in the Making May Prove to Be the Grandest” The New York Times (July 17, 2013), p. A20, www.nytimes.com/2013/07/18/nyregion/a-transit-hub-in-the-making-may-prove-to-be-the-grandest.html.
- The Port Authority of New York & New Jersey, “Port Authority Update on Conditions at Transportation Facilities” (press release, October 29, 2012), www.panynj.gov/press-room/press-item.cfm?headLine_id=1671; The Port Authority of New York & New Jersey, “Port Authority Continues Limited PATH Service,” (press release, November 6, 2012), www.panynj.gov/press-room/press-item.cfm?headLine_id=1701; The Port Authority of New York & New Jersey, “Port Authority Will Operate PATH Trains Between Newark and 33rd Street and Between Hoboken and 33rd Street This Weekend from 5 a.m. to 10 p.m. Saturday and Sunday” (press release, December 21, 2012), www.panynj.gov/press-room/press-item.cfm?headLine_id=1733; and The Port Authority of New York & New Jersey, “PATH’s Newark-to-World Trade Center Line to Resume 24-Hour Service During the Week Beginning Tonight” (press release, January 28, 2013), www.panynj.gov/press-room/press-item.cfm?headLine_id=1745.
- The Port Authority of New York & New Jersey, Port Authority Trans-Hudson, “Resiliency and Recovery” (accessed February 14, 2014), www.panynj.gov/path/resiliency-recovery.html.
- As part of PATH’s system improvements, the Newark to World Trade Center line will be closed to allow for work on the line on weekends beginning February 14, 2014 through the end of 2014. See: The Port Authority of New York & New Jersey, PATH, “PATH Forward” (accessed February 11, 2014), www.panynj.gov/path/path-forward.html.
- Fare schedules for PATH were revised effective September 18, 2011. PATH base fares increased from $1.75 to $2.00 in 2011, $2.25 on October 1, 2012, and $2.50 on October 1, 2013, with a further increase of 25 cents schedule on October 1, 2014. The cost of multi-trip tickets and unlimited passes increased, and will increase in a manner consistent with base fares. See: Port Authority of New York & New Jersey, 2012 Annual Report: Mapping a New Direction (2013), p. 38; www.panynj.gov/corporate-information/pdf/annual-report-2012.pdf.
- For comparison New York City Transit (bus and subway) offer 7-day passes for $30 and 30-day passes for $112. New York City Transit does not offer one-day unlimited passes.
- Th Port Authority Trans-Hudson, “System Improvements: Capacity Upgrades” (accessed February 12, 2014), www.panynj.gov/path/capacity-upgrades.html.
- The Port Authority of New York & New Jersey, “Port Authority Awards New PATH Signal System Contracts” (press release, October 22, 2009), www.panynj.gov/press-room/press-item.cfm?headLine_id=1231.
- Anthony J. Machcinski, “Christie cheers $256M Harrison PATH station, set to open 2017,” The Jersey Journal (August 16, 2013), www.nj.com/hudson/index.ssf/2013/08/state_and_local_officials_celebrate_beginning_of_construction_on_path_station_in_harrison.html; see also: Shawn Boburg and Jean Rimbach, “Governor Christie's brother invested in real estate near new PATH station in Harrison,” The Record (January 28, 2014), www.northjersey.com/news/Governors_brother_invested_in_houses_near_new_PATH_station_in_Harrison.html#sthash.Z1N0ZH6a.dpuf.
- The Port Authority of New York & New Jersey, Proposed Capital Plan Summary 2014-2023 (February 2014), p. 19, www.panynj.gov/corporate-information/pdf/2014-public-capital-plan.pdf.
- The Port Authority of New York & New Jersey, “Port Authority Board Authorizes $50 Million for Continuing Superstorm Sandy Cleanup Efforts to Remove Corrosive Salt From PATH Rail System” (press release, October, 16, 2013), www.panynj.gov/press-room/press-item.cfm?headLine_id=1841.
- The Port Authority of New York & New Jersey, Proposed Capital Plan Summary 2014-2023 (February 2014), p. 7, www.panynj.gov/corporate-information/pdf/2014-public-capital-plan.pdf.
- The Port Authority of New York & New Jersey, Port Authority Trans-Hudson, “Resiliency and Recovery” (accessed February 14, 2014), www.panynj.gov/path/resiliency-recovery.html.
- The Port of New York Authority, Annual Report 1962 (1963), p. 34, www.panynj.gov/corporate-information/pdf/annual-report-1962.pdf?year=1962.
- The Special Committee of the Board of Commissioners of the Port Authority of New York & New Jersey, Phase II Report (presented by Navigant, September 2012), p. 52, www.panynj.gov/corporate-information/pdf/navigant-phase-2-and-rothschild-reports.pdf.
- The 2008 fare increase was paired with the debut of the unlimited ride passes; however, it is unclear whether that had a positive or negative effect on revenues.
- The Port Authority of New York & New Jersey, Financial Statements and Appended Notes for the Year ended December 31, 2013 (April 4, 2014), Schedule E – Information on Port Authority Operations, p. 90, www.panynj.gov/corporate-information/pdf/financial-statement-2013.pdf; Port Authority of New York & New Jersey, 2012 Annual Report: Mapping a New Direction (2013), Schedule E, p. 95; 2011 edition, Schedule E, p. 91; 2010 edition, Schedule E. p. 92; 2009 edition, Schedule F, p. 89; 2008 edition, Schedule E, p. 90; 2007 edition, Schedule E, p. 94; 2006 edition, Schedule E, p. 92; 2005 edition, Schedule E, p. 73; 2004 edition, Schedule E, p. 85. For web access of all annual report editions, see: www.panynj.gov/corporate-information/annual-reports.html.
- Port Authority of New York & New Jersey, 2012 Annual Report: Mapping a New Direction (2013), p. 42, www.panynj.gov/corporate-information/pdf/annual-report-2012.pdf.
- Meeting minutes, Committee on Operations, Port Authority Trans-Hudson Corporation, (May 24, 2007), www.panynj.gov/corporate-information/pdf/Final_PATH_Ops_Minutes_0507.pdf; Meeting minutes, Committee on Operations, Port Authority Trans-Hudson Corporation, (February 21, 2008), www.panynj.gov/corporate-information/pdf/February_PATHCOOM_Minutes.pdf; Meeting minutes, Committee on Operations, Port Authority Trans-Hudson Corporation, (July 24, 2008), www.panynj.gov/corporate-information/pdf/July_08_PATH_ops_Minutes.pdf; Committee on Operations, Port Authority Trans-Hudson Corporation, (August 13, 2009), www.panynj.gov/corporate-information/pdf/august_13_2009_path_ops_Minutes.pdf; Meeting minutes, Committee on Operations, Port Authority Trans-Hudson Corporation, (August 5, 2010), www.panynj.gov/corporate-information/pdf/aug_5_2010_path_ops_Minutes.pdf.
- The Port Authority of New York & New Jersey, Proposed 2014 Budget (February 2014), p. 69, www.panynj.gov/corporate-information/pdf/2014-budget.pdf.
- The Port Authority of New York & New Jersey, Momentum: Achievements That Shape the Community, Certified Annual Financial Report for Year Ended 12.31.2004 (2005), p. 47, www.panynj.gov/corporate-information/pdf/annual-report-2004.pdf?year=2004.
- The Port Authority of New York & New Jersey, Building Our Future: Annual Report 2007 (2008), p.46, www.panynj.gov/corporate-information/pdf/annual-report-2007.pdf?year=2007.
- The Port Authority of New York & New Jersey, Annual Report 2011 (2012), p. 38, www.panynj.gov/corporate-information/pdf/annual-report-2011.pdf?year=2011.
- The Port Authority of New York & New Jersey, Financial Statements for the Year ended December 31, 2013 (April 4, 2014), Schedule E – Information on Port Authority Operations, p. 90, www.panynj.gov/corporate-information/pdf/financial-statement-2013.pdf.
- CBC uses the years 2004 to 2011 because it removes both the extraordinary growth in ridership from 2003 to 2004 caused by the opening of the temporary WTC terminal and the distorted growth rates in 2012 and 2013, when parts of the system were closed due to Superstorm Sandy-related damage. For annual ridership statistics, see: Port Authority of New York & New Jersey, 2012 Annual Report: Mapping a New Direction (2013), Schedule D-3, p. 94, www.panynj.gov/corporate-information/pdf/annual-report-2012.pdf.
- From 2007 to 2013, the U.S. Bureau of the Census estimates Bergen County grew 4.5 percent, Essex County grew 2.7 percent, Hudson County grew 12.0 percent, Middlesex County grew 6.3 percent, and Union County grew 5.5 percent. See: U.S. Bureau of the Census, Population Estimates Program, “State & County Quickfacts: Bergen County, New Jersey” (accessed April 4, 2014), http://quickfacts.census.gov/qfd/states/34/34003.html; U.S. Bureau of the Census, Population Estimates Program, “State & County Quickfacts: Essex County, New Jersey” (accessed April 4, 2014), http://quickfacts.census.gov/qfd/states/34/34013.html; U.S. Bureau of the Census, Population Estimates Program, “State & County Quickfacts: Hudson County, New Jersey” (accessed April 4, 2014), http://quickfacts.census.gov/qfd/states/34/34017.html; U.S. Bureau of the Census, Population Estimates Program, “State & County Quickfacts: Middlesex County, New Jersey” (accessed April 4, 2014), http://quickfacts.census.gov/qfd/states/34/34023.html; and U.S. Bureau of the Census, Population Estimates Program, “State & County Quickfacts: Union County, New Jersey” (accessed April 4, 2014), http://quickfacts.census.gov/qfd/states/34/34039.html.
- U.S. Bureau of the Census, Population Estimates Program, “State and County Quickfacts: New Jersey (accessed February 18, 2014), http://quickfacts.census.gov/qfd/states/34000.html.
- U.S. Bureau of the Census, Longitudinal-Employer Household Dynamics Program, “OnTheMap Application” (2013), (accessed February 14, 2014), http://onthemap.ces.census.gov/.
- U.S. Bureau of the Census, Longitudinal-Employer Household Dynamics Program, “OnTheMap Application” (2013), (accessed February 14, 2014), http://onthemap.ces.census.gov/.
- See: Citizens Budget Commission, A Better Way to Pay for the MTA, (October 2012), www.cbcny.org/sites/default/files/REPORT_MTA_10102012.pdf.
- All prices reflect regular, weekday, peak-hour one-way fares from NJ Transit’s website, www.njtransit.com.
- Peak hours for the PANYNJ’s bridges and tunnels are 6 a.m. to 10 a.m. and 4 p.m. to 8 p.m. on weekdays and 11 a.m. to 9 p.m. on Saturdays and Sundays.
- CBC analysis of data provided by the North Jersey Transportation Planning Authority 2010/11 Regional Household Travel Survey (2013), www.njtpa.org/Data-Maps/Surveys/Household-Travel-Survey.aspx.
- While PATH has received some taxpayer subsidies—less that $5 million per year since 2005—these are grants to fund security operations related to PATH.
- U.S. Department of Transportation, Federal Transit Authority, 2012 National Transit Database (September 2013), Table 1: Summary of Operating Funds Applied, www.ntdprogram.gov/ntdprogram/pubs/dt/2012/excel/DataTables.htm.
- The Port Authority of New York & New Jersey, Port Authority Trans-Hudson, 2007 PATH Passenger Travel Study (2008), Table 24: Origin by Destination – All Stations – Weekday, www.panynj.gov/corporate-information/foi/12342-O.pdf.
- Fiscal year 2013 taxable sales estimated from historical shares of state sales tax receipts and budgeted sales tax receipts. See: Joseph J. Seneca, Will Irving, and James W. Hughes, “Fiscal Flows in New Jersey: A Spatial Analysis of Major State Taxes and State Aid Programs,” Rutgers Regional Report, Issue Paper no. 31 (October 2012), Table 1, p. 5, http://policy.rutgers.edu/reports/rrr/RRR31oct12.pdf; and State of New Jersey, The Governor’s FY 2013 Budget (February 21, 2012), Summaries of Revenues, C-1, www.state.nj.us/treasury/omb/publications/13budget/pdf/FY13BudgetBook.pdf.
- Effective rates from lowest to highest: Bergen County, 2.160 percent; Hudson County, 2.371 percent; Union County, 2.635 percent; Essex County, 2.707 percent; and Middlesex County, 4.832 percent. Market and assessed real property values for Essex, Hudson, and Union counties come from State of New Jersey Department of the Treasury, Table of Equalized Valuations Certified October 1, 2012 (October 1, 2012), www.state.nj.us/treasury/taxation/lpt/lptvalue.shtml.; Tax rates for Hudson, Essex, and Union counties come from county tax board websites. New Jersey Essex County Tax Board, Tax Rates & Ratios 2013 General Tax Rate Table, www.essextaxboard.com/pdfs/2013GeneralRates.pdf.; Hudson County Board of Taxation, Tax Rates & Ratios, www.hudsoncountytax.com/html/RatesRatios.aspx.; Union County New Jersey Board of Taxation, Tax Rates Applicable for Tax Year 2012, http://ucnj.org/wp-content/uploads/2010/08/2012-tax.pdf.
- U.S. Bureau of the Census, American Community Survey, 5-Year Estimates: Hudson County, New Jersey (December 17, 2013), http://quickfacts.census.gov/qfd/meta/long_HSG495212.htm.
- Manhattan CBD Market and Assessed values calculated from New York City Assessment rolls for all properties with zip codes south of 59th Street. See: City of New York, Department of Finance, “FY 2015 Tentative Assessment Roll” (January 15, 2014), (accessed February 12, 2014), www.nyc.gov/html/dof/html/property/assessment.shtml#roll.
- Citizens Budget Commission, Tax Policy Choices and New York City’s Competitive Position (prepared by Donald Boyd, December 2013), Table 10, p. 17,
www.cbcny.org/sites/default/files/CBC%20Post-Election%20Conference%20Book.pdf. - This number omits those entering the CBD via the George Washington Bridge and southbound Manhattan streets. See: New York Metropolitan Transit Council, 2012 Hub Bound Travel Report (January 13, 2014), Appendix II, Table 14B, www.nymtc.org/data_services/HBT.html.
- This number omits those entering the central business district via the George Washington Bridge and southbound Manhattan streets.
- Levels of subsidy in 2013 and 2012 are significantly higher due to Sandy relief. In 2011, NJT received nearly $800 million subsidies, for comparison. See: New Jersey Transit, 2013 NJ Transit Annual Report: Vision, Innovation, Dedication (2013), p. 10, www.njtransit.com/pdf/NJTRANSIT_2013_Annual_Report.pdf.