Four Facts about New York City Full-Time Employees
1. 65 Percent of Full-Time City Employees Are Concentrated in 20 Titles
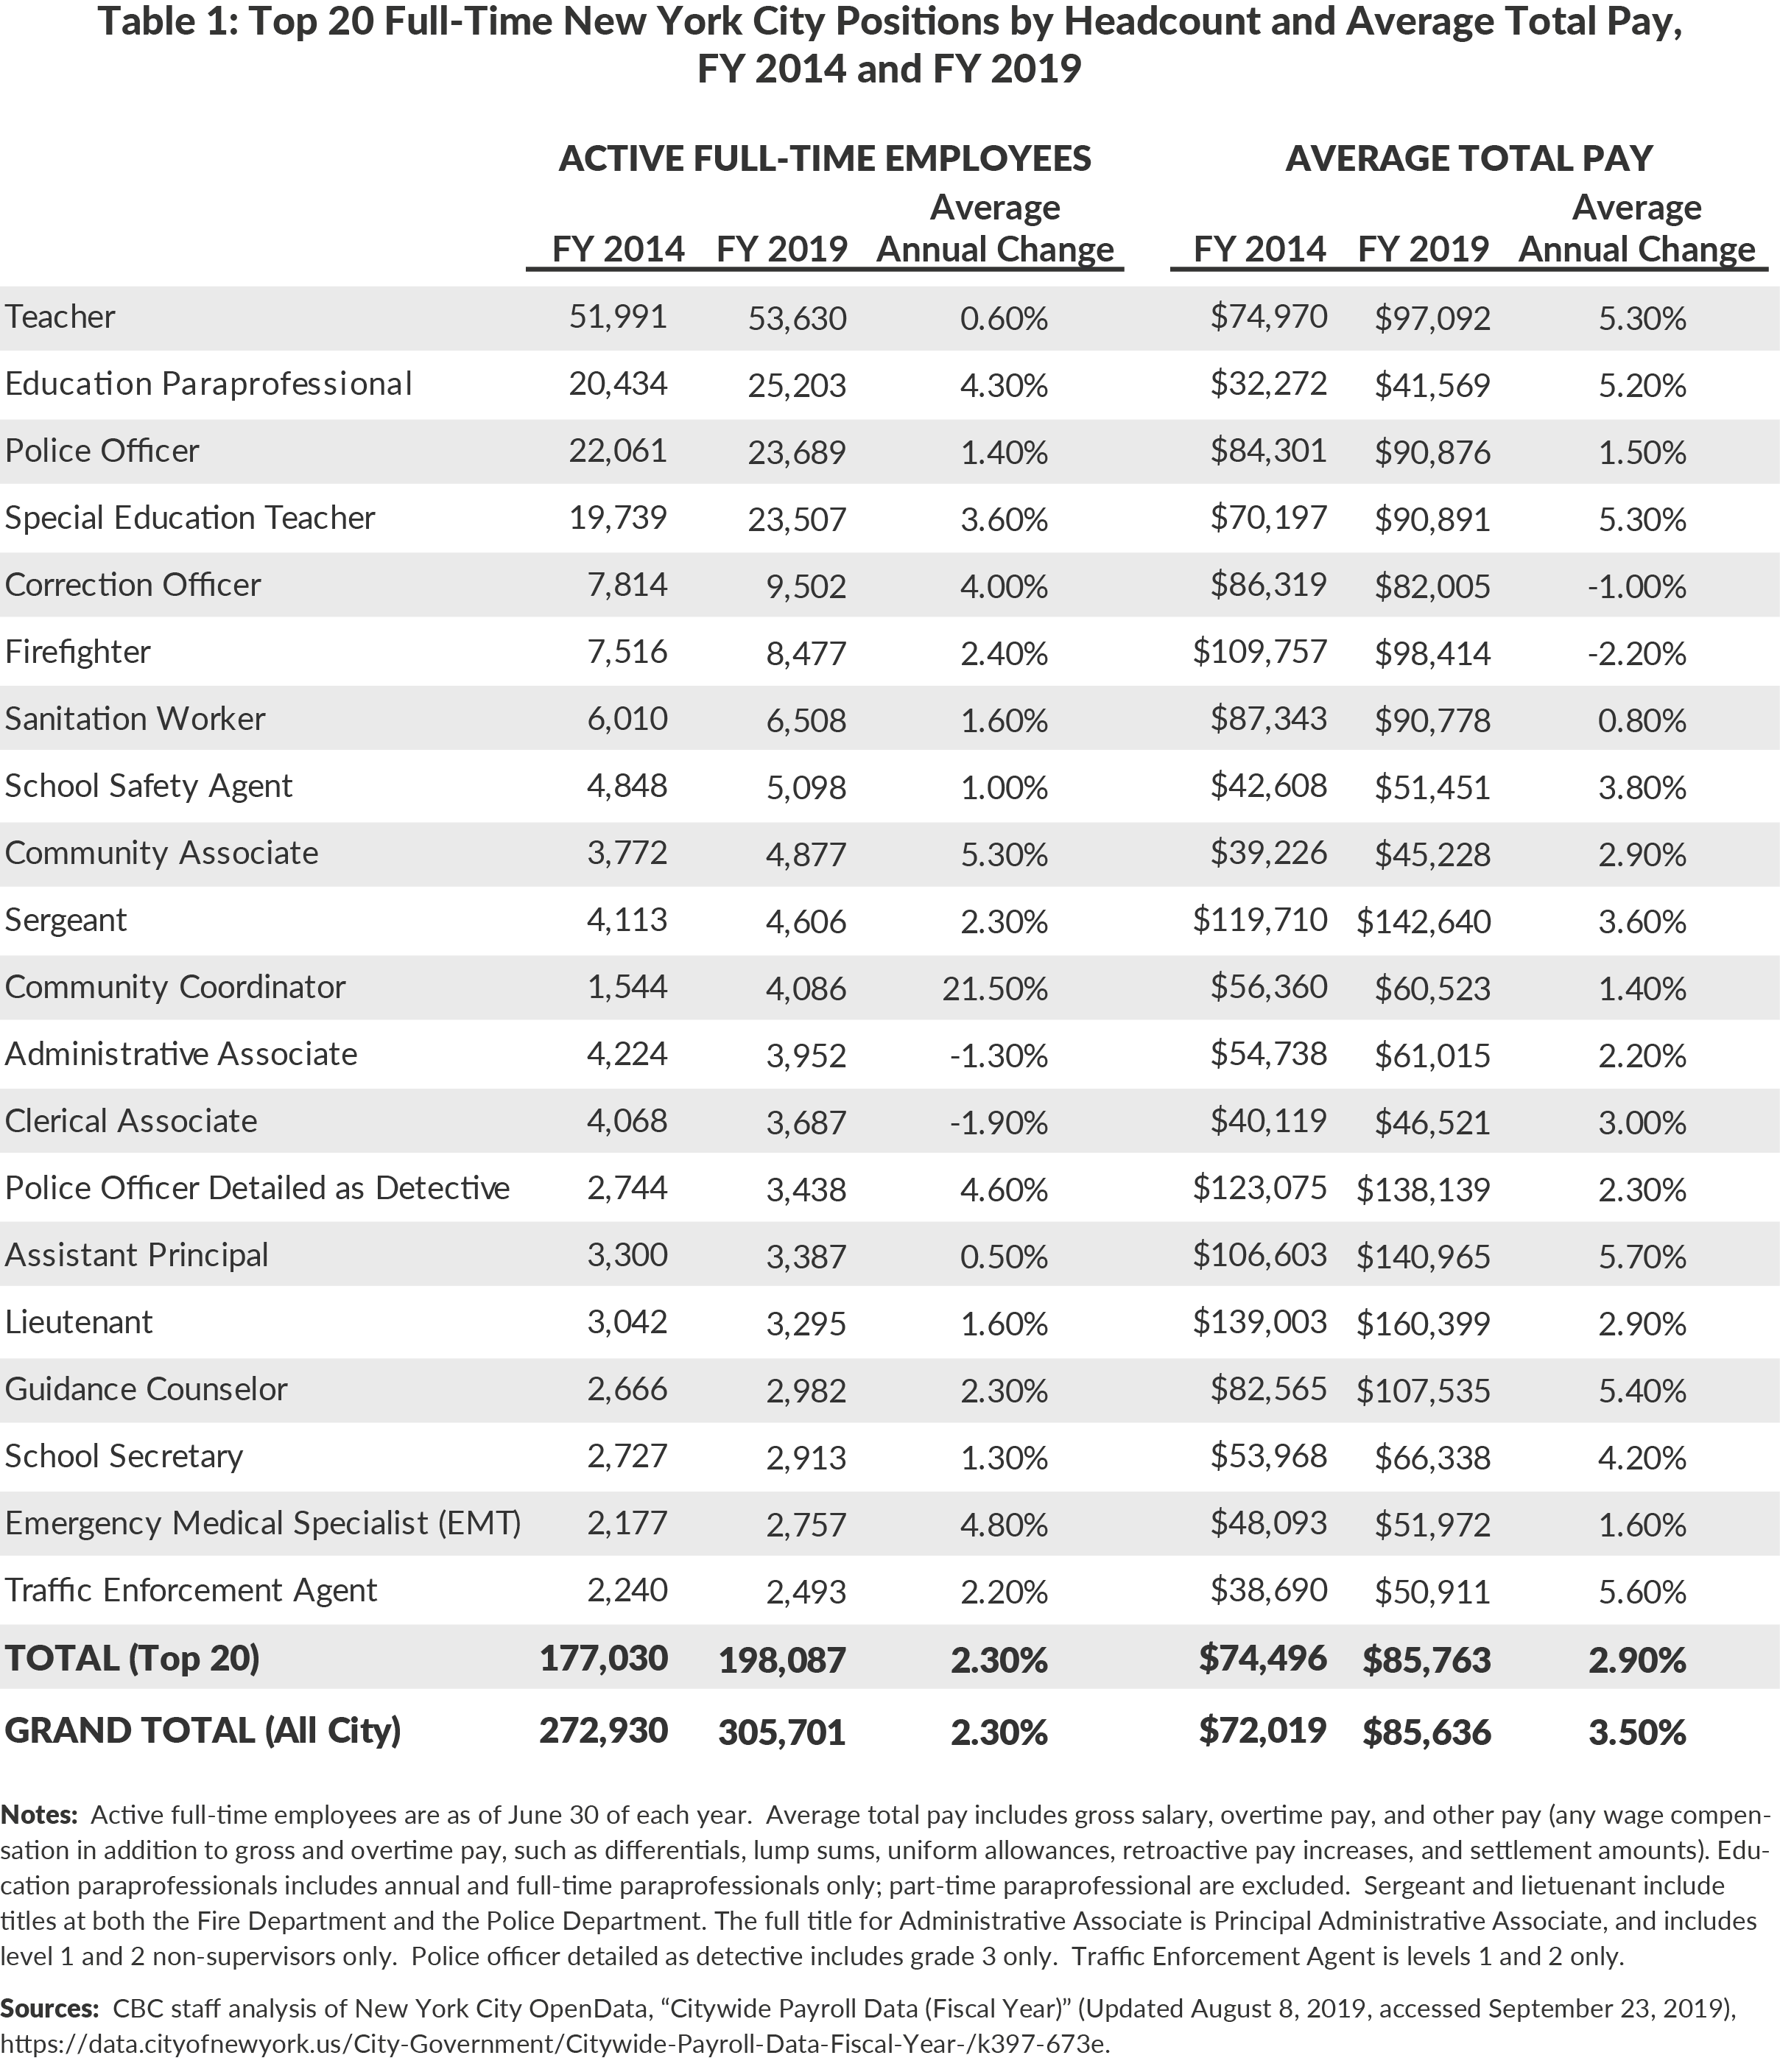
In fiscal year 2019 New York City employed approximately 305,700 full-time employees, with two-thirds concentrated in 20 titles, including teachers, police officers, firefighters, and case workers.1
Between fiscal years 2014 and 2019 the number of positions in these 20 titles grew 2.3 percent annually, the same pace as the total full-time city workforce. Seven of the top 20 titles grew at least 3.5 percent per year on average, and added 16,546 positions, or 56.6 percent, of the total citywide increase of 32,771 positions. These titles were: community coordinators, community associates, emergency medical technicians, education paraprofessionals, correction officers, police detectives (grade 3), and special education teachers.
2. Average Pay Citywide Was More than $85,000 in Fiscal Year 2019
In fiscal year 2014 full-time employees earned an average of $72,019, which includes base salary, overtime, and other pay such as differentials, but does not include the employer cost of health insurance or fringe benefits. By fiscal year 2019 average pay had grown to $85,636, an increase of $13,617 over five years.2 Among the top 20 titles, pay increased at a rate of 2.9 percent annually, from $74,496 to $85,763.
3. Average Pay for Employees at the Department of Education (DOE) Increased at the Highest Rate
Average pay for the five most common full-time DOE positions— teachers, education paraprofessionals, special education teachers, assistant principals, and guidance counselors—increased more than 5 percent annually. This relatively high pay growth is partly due to wage increases and the retroactive pay included in the City’s collective bargaining agreements with the United Federation of Teachers.3 The only other title in the top 20 with an increase in average total pay greater than 5 percent annually was traffic enforcement agents, whose overtime pay increased by 8.6 percent annually.
4. Slower Growth in Average Pay for Certain Uniformed Titles is Partly Due to Lower Overtime
Total average pay for the four most common uniformed titles—police officers, firefighters, correction officers and sanitation workers– increased an average of 0.2 percent per year. Firefighters and correction officers’ average pay decreased at an annual average of 2.2 percent and 1.0 percent, respectively. Police officers and sanitation workers’ average pay increased 1.5 percent and 0.8 percent per year, respectively. Uniformed employees received collectively bargained wage increases between fiscal years 2014 and 2019. The slow growth in average total pay is due hiring new employees at lower starting salaries and reductions in overtime and other pay, among other factors.
Total average uniformed overtime pay for these four positions declined 1.2 percent annually between fiscal years 2014 and 2019. Average overtime pay declined at an average annual rate of 6.6 percent for firefighters and 0.7 percent for sanitation workers. Conversely, overtime pay increased by 2.2 percent per year for police officers and 0.2 percent per year for correction officers.
In the aggregate uniformed overtime continued to grow from $973 million in fiscal year 2014 to $1.1 billion in fiscal year 2019, and comprises approximately two-thirds of total overtime expenses in the City budget.
Learn more about trends in headcount and average pay in CBC’s newly updated Headcount Interactive and Average Pay Interactive.
Footnotes
- This does not include part-time employees. The number of full-time equivalent employees increased from 25,582 at the end of fiscal year 2014 to 26,297 at the end of fiscal year 2019. Source: Staff of City of New York, Mayor’s Office of Management and Budget, email to Citizens Budget Commission staff (October 10,2019).
- The average private sector wage rate in New York City was $92,703 in 2018 and $74,967 when excluding finance. The average wage in finance was $301,020. See: City of New York, Mayor’s Office of Management and Budget, Quarterly Report on Current Economic Conditions (August 2019), https://www1.nyc.gov/assets/omb/downloads/pdf/ec08-19.pdf.
- Average total pay grew 5.4 percent per year on average, while the rate of base pay grew 4.2 percent. This is comparable to the salary increase in the collective bargaining agreements; raises that took effect between the end of fiscal year 2014 and the end of fiscal year 2019, from both the 2009 to 2018 and 2018 to 2021 UFT contracts, yield an average annual salary increase of 4.5 percent. The higher increase in total pay reflects retroactive payments that are being credited in annual installments between October 1, 2015 and October 1, 2020. See: United Federation of Teachers, Salary Schedules for 2009-2018 Contract, www.uft.org/files/attachments/secure/teacher-schedule-2009-2018.pdf, and Teachers Salary Schedule – 2018-2021 (accessed October 4, 2019), www.uft.org/your-rights/salary/doe-and-city-salary-schedules/teachers-salary-schedule; and City of New York, Office of Labor Relations, UFT –NYC Memorandum of Agreement, 2009-2018 (April 29, 2014), https://www1.nyc.gov/assets/olr/downloads/pdf/collectivebargaining/cbu-uft-moa-042914.pdf.