Getting Greener
Cost-Effective Options for Achieving New York State's Greenhouse Gas Goals
EXECUTIVE SUMMARY
New York State has embarked on a path to reduce greenhouse gas (GHG) emissions. The Climate Leadership and Community Protection Act (CLCPA), enacted in July 2019, establishes ambitious goals to reduce GHG emissions 40 percent by 2030 and 85 percent by 2050 from 1990 levels. To achieve these goals, CLCPA prescribes two specific approaches: (1) increasing energy efficiency by 185 trillion British thermal units; and (2) expanding the share of electric power generated by renewable sources, such as hydro, solar, and wind power, to 70 percent by 2030 and by 2040 eliminating GHG emissions in that sector entirely.
New York is already green: compared to other states it produced the fewest per-capita GHG emissions in 2016 and experienced the greatest percentage decrease in emissions– 13 percent– between 1990 and 2016. Most of New York’s decrease occurred in the electric power sector as energy sources shifted almost entirely away from coal to increased use of natural gas and nuclear power, both of which produce far less carbon dioxide per megawatt-hour of electricity generated. During this time GHG emissions also decreased significantly in the industrial sector and declined slightly in the residential and commercial sectors. In contrast, emissions grew 25 percent in the transportation sector, which now represents more than one-third of all GHG state emissions and over 40 percent of end-use energy.
New York’s ability to continue to make such gains and to meet CLCPA goals is uncertain, for several reasons:
- Immense scaling up of renewable generation capacity is necessary and is likely infeasible by 2030. Much of New York’s GHG strategy rests upon continued reductions in the electric sector; specifically, state plans are to more than double renewable generation capacity, mostly from offshore wind turbines. However, it will be challenging to install the required resources by 2030: too few projects are underway and project timelines are lengthy and are likely to be delayed by extensive permitting procedures and often community opposition. New York is poised to direct the expenditure of billions of dollars and still fall short of the stated goals.
- The focus on building renewable resources, particularly offshore wind, and entering into long-term power contracts limits flexibility and diminishes consideration of other cost-effective approaches. Efforts to scale up renewables are necessary, but projects planned require the State to offer supplemental payments to make them work. Furthermore, the massive infrastructure investment required to procure offshore wind capacity will require long-term contracts that will lock in increased costs for electric customers for years to come. Based on analysis of a recent offshore wind project contract, meeting the renewable target entirely with offshore wind will increase electricity costs by $2.3 billion annually, an increase of between 8 and 12 percent to New Yorkers’ electric bills, which could be a significant increase in monthly living expenses for some low-income and working class New Yorkers. Other options may be more cost-effective, particularly as technology evolves in the long term.
- State policies on nuclear, natural gas, and hydropower are counterproductive. First, the state’s six nuclear power plants are scheduled to shut down between 2020 and 2046. Elimination of the nuclear fleet will erase nearly all previous emissions gains as that power supply by necessity will likely be replaced in the near-term by natural gas, which produces greater emissions than nuclear power. Second, attempts to expand natural gas pipelines have been blocked, which resulted in moratoria on new gas installations downstate. Natural gas provides an economical alternative to dirtier fossil fuels and is a dependable source when renewable sources like solar and wind are not available. Third, while hydro is a key renewable resource, state policies have not supported use of hydro when construction of a new dam is involved, limiting the ability to access additional affordable and clean power from Canada.
- The focus on other sectors—particularly transportation—is insufficient. The State’s strategy to tackle growing transportation emissions is focused on facilitating expanded use of electric vehicles, which is expensive and challenging for some parts of the state. Furthermore, achieving the long-term goals to cut GHGs by 85 percent will require electrifying almost all heating and transportation, affecting every home and business and nearly every vehicle in the state. This conversion from direct fossil fuel consumption to electric power will necessitate a dramatic further increase in renewable energy supply and energy efficiency: New York State will need to add an additional 94,000 Gigawatt hours of renewables, more than double existing renewable resources. It will also require an expansion of the state’s transmission capacity, which is already constrained from upstate to the downstate area, where most energy is used. The construction of offshore wind facilities will bring more renewable energy directly to the downstate market, but a larger mix of resources, some operating intermittently, will require an expanded transmission grid to deliver power throughout the state.
While GHG emissions have risen in other large states like Texas and Florida, New York has been a leader in reducing GHG emissions; the focus on further emissions reductions is necessary and important. The challenge now is to find the most efficient approaches to secure the greatest amount of incremental carbon reduction per each dollar spent. Doing so will require tackling emissions across all sectors; maintaining optionality in the approaches used; and partnering with other states and Canada. Specifically, New York should:
- Establish an economy-wide carbon pricing system to deliver effective price signals to energy consumers. Two options for such a system are: (1) a carbon fee and (2) a cap-and-trade system. To be most effective, these policies should be implemented on at least a regional, if not national, scale, so that dollars are directed most effectively toward the dirtiest energy sources and states. CLCPA tasks the New York State Department of Environmental Conservation with estimating a “social cost of carbon,” that is, a monetary figure capturing the costs of an incremental increase in carbon emissions, an important step for implementing a pricing scheme. New York is already a member of the Regional Greenhouse Gas Initiative (RGGI), an effective 9-state cap-and-trade system covering the electrical generation power sector. To be most effective RGGI should be expanded to other sectors of the economy, including transportation.
- Look beyond New York’s borders for low-cost, low-emission energy supplies and to cut GHG emissions. New York should explore the possibility of a multi-state buyers’ consortium to purchase large-scale low- and zero-GHG energy resources. New York, New Jersey, Connecticut, Rhode Island, and Massachusetts are all in the process of developing offshore wind energy projects. The states are seeking low-cost electricity, but also vying for jobs from the burgeoning offshore wind industry. Rather than compete, these states should work together to bring the most cost-effective resources to the market. Another opportunity is to import Canadian hydropower, which is competitively priced and clean.
- Retain nuclear energy to retain the benefits of carbon avoidance. The state’s nuclear facilities operate with the help of subsidies, known as Zero Emissions Credits, that expire in 2029. If these subsidies are not extended, the nuclear plants may shut down while still holding valid operating licenses. The state should explore further extensions of these operating licenses with the U.S. Nuclear Regulatory Commission. The implementation of a properly priced carbon fee would be a benefit to the nuclear plants, which generate no greenhouse gases.
- Avoid self-imposed constraints such as limiting gas pipeline capacity. A strong preference for renewable energy has resulted in constraints on expansion of natural gas. Denying permits to several natural gas pipelines is constraining energy markets to the point that New York will not be able to reap the GHG reduction benefits of converting home heating from oil to natural gas. Likewise, a lack of stable natural gas supply for new businesses may harm the state’s economic competitiveness. Regulatory and legal actions should not hamper use of resources that can continue to reduce GHG emission and provide reliable energy solutions. New York should create a competitive market of options to reduce greenhouse gases.
- Promote broad transportation solutions that build on existing infrastructure. New York has made a large commitment to electric vehicles that will subsidize both car buyers and the construction of charging stations. This is an expensive GHG emissions reduction strategy. Greater emphasis should be placed on one of the areas that has made New York a low GHG-emitting state: energy-efficient public transportation. While a hybrid or electric vehicle produces fewer GHGs than a gasoline powered vehicle, public transportation produces even less per passenger mile traveled.
- Establish a prioritization system to pursue renewables that provide the greatest GHG reductions at lowest cost. Renewables are and must be an increasing part of the state’s energy portfolio; however, policymakers should allow price signals to determine how much wind capacity, distributed solar, utility-scale solar, and hydropower is built rather than mandating specific technologies. All these projects should be put on a common basis of cost to consumer for tons of GHG avoided and those with the lowest net cost should be prioritized for development and contracts. A balanced portfolio of resources and contract term lengths will provide New York with the greatest security and stability to reach its long-term GHG reductions goals. This also will allow for competition from new resources so that if newer projects can be completed at lower cost, New York will reap the benefit. It also allows for the possibility that leaps in technology will be able to fill the mix rather than being locked into old technology for 20 years.
New York is now leading the way on greenhouse gas reductions, but it should also lead the way in using competition to provide the greatest emissions reductions at the lowest cost.
INTRODUCTION
New York has a long and respected history of energy innovation beginning in 1882 with Thomas Edison’s Pearl Street Station, the first commercial central station power plant in the United States. A little more than a decade later, the waters of Niagara Falls were channeled into power turbines for the state in 1895. The state also has a long history of commitment to the environment. New York was the first state to establish a land preserve when it created Adirondack Park in 1885. Innovation and dedication to the environment are central to the state’s essential character and are embodied in the New York State Energy Plan and the recently enacted Climate Leadership and Community Protection Act (CLCPA).1
In keeping with New York’s character of energy innovation and environmental stewardship, the state has embarked on an ambitious and necessary mission to reduce greenhouse gases (GHGs). The environmental risks of climate change are widely recognized throughout New York and state government and communities across the state have taken initiative to reduce GHGs. Governor Andrew Cuomo has directed State agencies to work in concert on a plan to reduce overall GHG emissions. These objectives were detailed in the State Energy Plan, the most recent version of which was released in 2015. The CLCPA has expanded on these goals. The near-term target is to reduce GHG emissions by 40 percent by 2030 from what they were in 1990 and the long-term target is to reduce GHG emissions by at least 85 percent in 2050 from what they were in 1990 with the additional target of net zero emissions with a limited allowance for offsets of up to 15 percent.2 The CLCPA has also set goals that: 70 percent of electric power generation be supplied by renewable resources by 2030; all GHG emissions be eliminated from electric power production by 2040; and statewide energy efficiency be increased 185 trillion British thermal units (TBtu) compared to the 2025 forecast.
As a low-emitting state that has already achieved substantial reductions in GHG emissions, getting significantly greener without significantly impacting already-high energy costs will be challenging. This paper examines how New York can achieve significant GHG reductions cost-effectively.
The paper is organized into three sections. First, it provides background information and a comparative perspective on energy use and GHG emissions in New York. Second, it explores the programs that are already in place or proposed to meet GHG emissions goals. In particular, it assesses the feasibility of plans to transform power-generating capabilities and shift toward renewable sources of energy, particularly offshore wind, in order to meet GHG reduction targets. Third, it identifies the most cost-effective options for achieving these goals. The paper does not assess additional potential challenges facing the full range of initiatives considered by the State Energy Plan or the CLCPA, including inadequate transmission capacity, technological advancements in storage, and problems with infrastructure maintenance stemming from distributed energy systems.
The State Energy Plan and the CLCPA set GHG goals for the statewide economy, direct that the electric generation sector be powered by renewable energy, and set specific targets for one technology, offshore wind generation, to meet the bulk of this renewable energy goal. By moving from a general goal of GHG reduction to a prescriptive policy favoring one energy resource, New York is restricting the ability of the marketplace to provide low-cost and innovative solutions to meet the overall goal of GHG reduction. Offshore wind energy may turn out to be the option with the least public opposition and perhaps the most cost-effective to meet the GHG goals, but hampering competition from other technologies and approaches will likely result in higher costs and a less diverse resource mix.3
The GHG reduction goals should be pursued by prioritizing approaches that are as cost-effective as possible, applying price signals and market incentives that work across all sectors of the economy, and maintaining optionality in the use of technology. These principles suggest that New York should expand efforts to reduce emissions outside the electrical sector, continue the use of nuclear power, and focus on regional or national initiatives to cap or tax carbon emissions. Efforts to scale up renewable energy are necessary for achieving further GHG reduction, but long-term power agreements can lock in high costs; these projects should be approached cautiously so as not to preclude the state from benefitting from technological advances.
NEW YORK STATE ENERGY LANDSCAPE AND GREENHOUSE GAS EMISSIONS
Context is essential to understanding the policy goals of New York. This section explains the regulatory framework, the current mix of energy sources and consumption in each sector, changes over time, and how New York compares favorably to the rest of the nation in terms of energy use and carbon dioxide emissions.
2.1 Multi-Jurisdictional Regulatory and Implementation Environment
Energy policy in New York is shaped by federal, state, and local agencies, public authorities, and a federally regulated nonprofit regional transmission organization.4 Within the state, policy is set pursuant to laws enacted by the legislature and regulations promulgated and enforced by a variety of agencies. Among the most influential State agencies are:
- Public Service Commission (PSC) and the Department of Public Service (DPS);
- Department of Environmental Conservation (DEC);
- New York State Energy Research and Development Authority (NYSERDA);
- New York Power Authority (NYPA); and
- Empire State Development Corporation (ESDC).
The PSC has policy-making authority over the electric, gas, water, and telecommunications industries in New York. The Commission is composed of five members, appointed by the Governor to six-year terms. No more than three members may be of the same party and the Governor selects the Chair from among the members of the Commission. The DPS is tasked with carrying out the work of the PSC and the Chair of the PSC also serves as the CEO of DPS. While New York has limited authority over wholesale petroleum markets or wholesale supply and transmission of electricity and natural gas, the DPS has the ability to promote specific actions and projects at the retail supply level for electricity and natural gas.
The DPS oversees the siting processes for electric generation under Article 10 of the Public Service Law and for the siting of electric and gas transmission in accordance with Article 7.5 Each of these laws provides a unified forum to evaluate public need, alternatives proposed, and environmental impact. Article 10 also established the State Board on Electric Generation Siting and the Environment, which is chaired by the CEO of DPS. The board is also composed of the chairs or presidents of: DEC; ESDC; Department of Health; NYSERDA; and two ad hoc members are added for each project with those members being residents of the community in which the proposed facility is located.6
The DEC has the lead for the state in ensuring environmental compliance for both state and federal regulations, and acts upon delegated authority under the Clean Air Act and the Clean Water Act to help the State meet its obligations. At the state level, the DEC serves either as Lead Agency or as an involved agency for State Environmental Quality Reviews (SEQR) for energy projects. Further, the DEC has issued policy guidelines requiring that GHG implications for any energy project be evaluated as part of an Environmental Impact Statement.
NYSERDA plays a key role in designing and implementing many of the state policies mandated by the PSC; it is a public benefit corporation, with a Chair and thirteen-member board appointed by the Governor. NYSERDA offers objective information and analysis, innovative programs, technical expertise, and funding to help New Yorkers increase energy efficiency, save money, use renewable energy, and reduce reliance on fossil fuels.7 NYSERDA is primarily funded by New York’s electric energy consumers through the System Benefits Charge (SBC) on participating utility bills and proceeds from auctions through the Regional Greenhouse Gas Initiative. These funds are allocated to the Clean Energy Fund and Renewable Portfolio Standard for energy-efficiency programs, research and development initiatives, and other clean energy activities.8 Following regulations established by the PSC, the companies that provide electric service to customers must obtain renewable energy credits (RECs) or pay an alternate compliance fee; generally the RECs are purchased from NYSERDA.
NYPA runs many statewide energy efficiency and renewable energy programs to support the State Energy Plan and ESDC provides funding for research and development programs in energy efficiency and energy storage technologies. The CEO of NYPA is a member of the board of NYSERDA and the CEO of ESDC serves on the State Board on Electric Generation Siting and the Environment.
2.2 Energy Profile and Trends: 25 Years of Getting Greener
2.2.1 Energy Profile
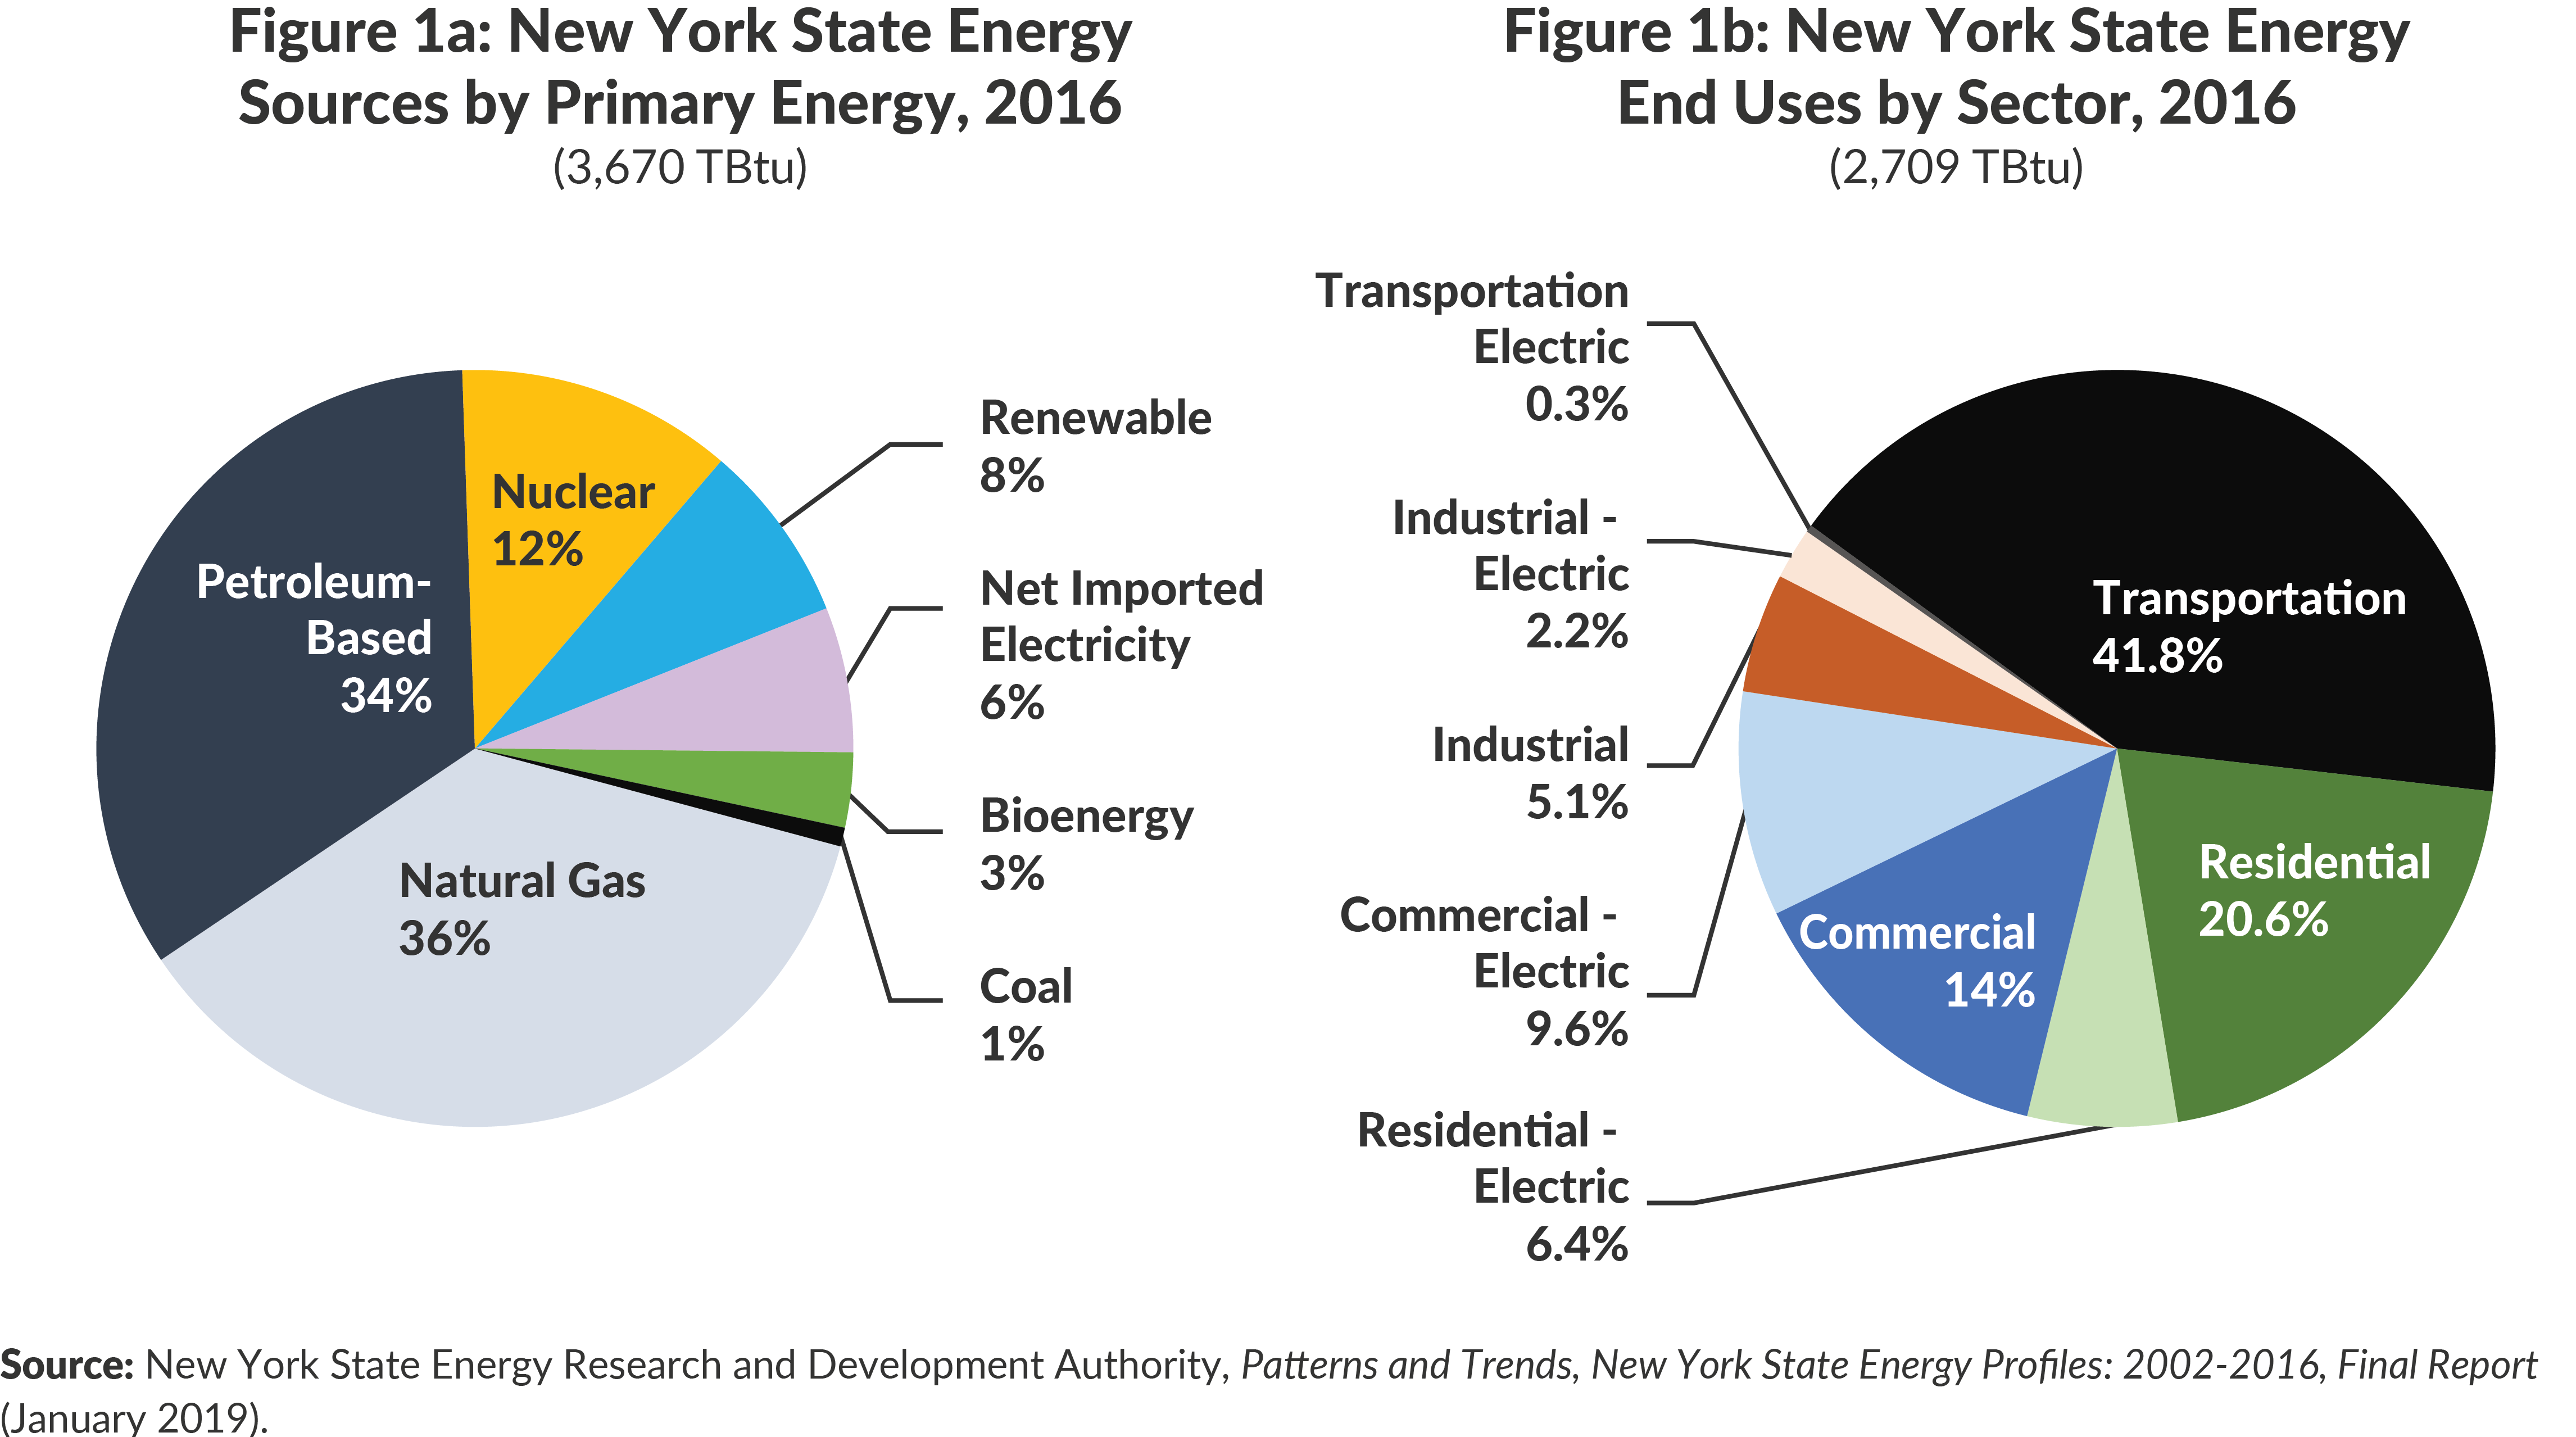
New York, the fourth most populous state with the third largest state economy, is a major energy consumer. Figure 1 provides an overview of all sources and uses of energy consumed in the state; in 2016 New York used 3,670 trillion British thermal units (TBtu), a common measure of the energy to equate different energy products.9 Energy use across the state in 2016 was 2,709 TBtu. The difference between the sources and uses is the energy consumed in production and delivery; a large portion of this energy is lost as waste heat. The largest energy sources were natural gas and petroleum-based products, followed by nuclear energy and renewable sources, such as hydro, solar, and wind. The state has the largest hydro power resources of any state east of the Rocky Mountains. Most energy is used by the transportation sector, followed by residential and commercial sectors. A detailed representation of the flow of energy from sources to uses and the associated energy losses is in Appendix A.
Background: Greenhouse Gas
Greenhouse gas (GHG) is a term that refers to a set of gases which, when released into the atmosphere, can trap the heat of the planet rather than allow it to escape into space. Increased GHG concentrations have already led to an increase in global temperatures, which are forecast to rise further unless GHG emissions are reduced. Carbon dioxide (CO2) is the most prevalent, representing 82 percent of GHGs in 2015, and can remain in the atmosphere for thousands of years. Other gases are measured in relation to carbon dioxide by their global warming potential (GWP), with these other gases having a multiplier impact compared to carbon dioxide. Methane represents 10 percent of the atmosphere’s GHGs and lasts approximately 12 years but has a GWP of 25. Nitrogen dioxide, which was 5 percent of the inventory in 2015, has a GWP of almost 300 and remains in the atmosphere for over 100 years. A common basis of measurement of the impact of these gases on the environment is to convert them to millions of metric tons of carbon dioxide equivalent, which is abbreviated as MMTCO2e.[10]
Fossil fuels are the most common sources of GHGs and when these fuels are burned to produce heat or electric power, they produce different levels of GHGs. When used for heating, coal produces nearly twice the CO2 compared with natural gas. Figure 2 shows the average lifecycle carbon dioxide equivalent emissions rates (CO2e) for various electric power generation technologies.[11]

2.2.2 Declining Emissions Thanks to Reliance on Cleaner Energy Sources
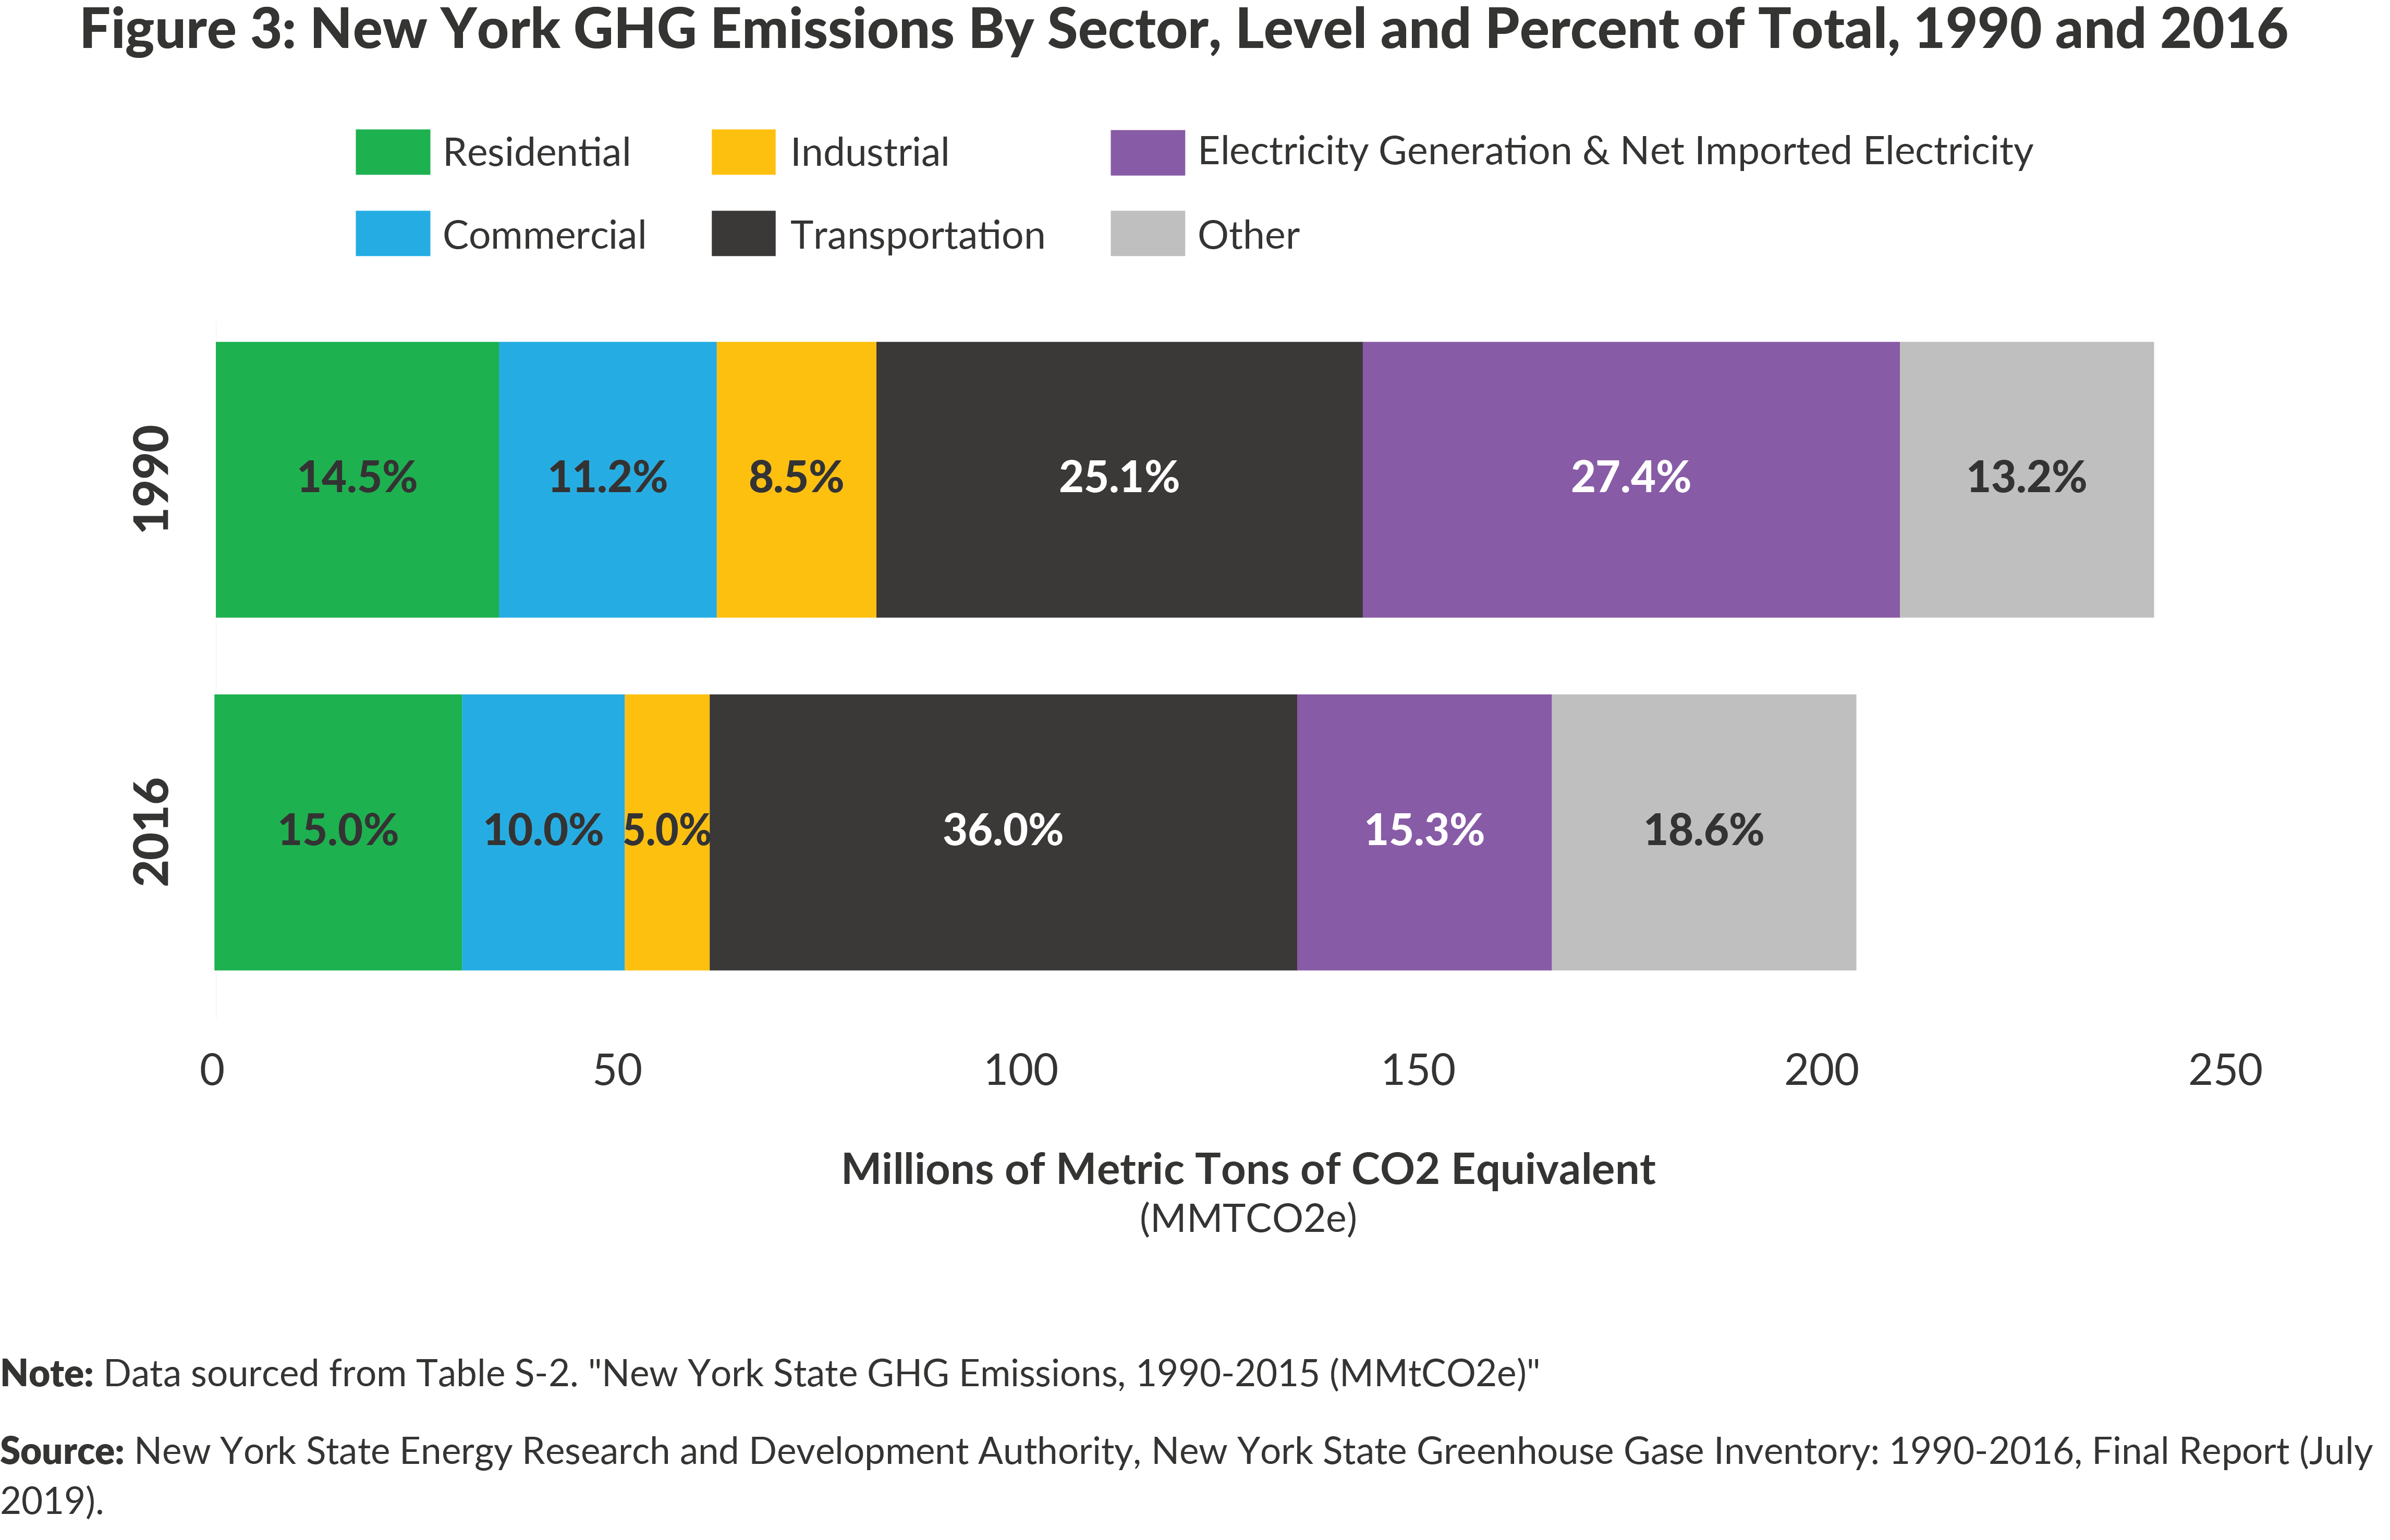
From 1990 to 2016 New York achieved significant reductions in GHG emissions: In 1990, total New York GHG emissions were 236.2 MMTCO2e and by 2016 had fallen to 205.6, a decline of 13 percent. Figure 3 presents emission levels for each sector from 1990 to 2015. The CLCPA goals are to bring GHG emissions down to 141.7 MMTCO2e by 2030 and 35.4 MMTCO2e by 2050.
There are three important trends to note:
1. The largest decrease occurred in emissions from the electric sector due to a shift toward cleaner sources of power. (See Figure 3.) GHG emissions declined from 64.8 to 31.5 MMTCO2e, or 51.3 percent, due to:
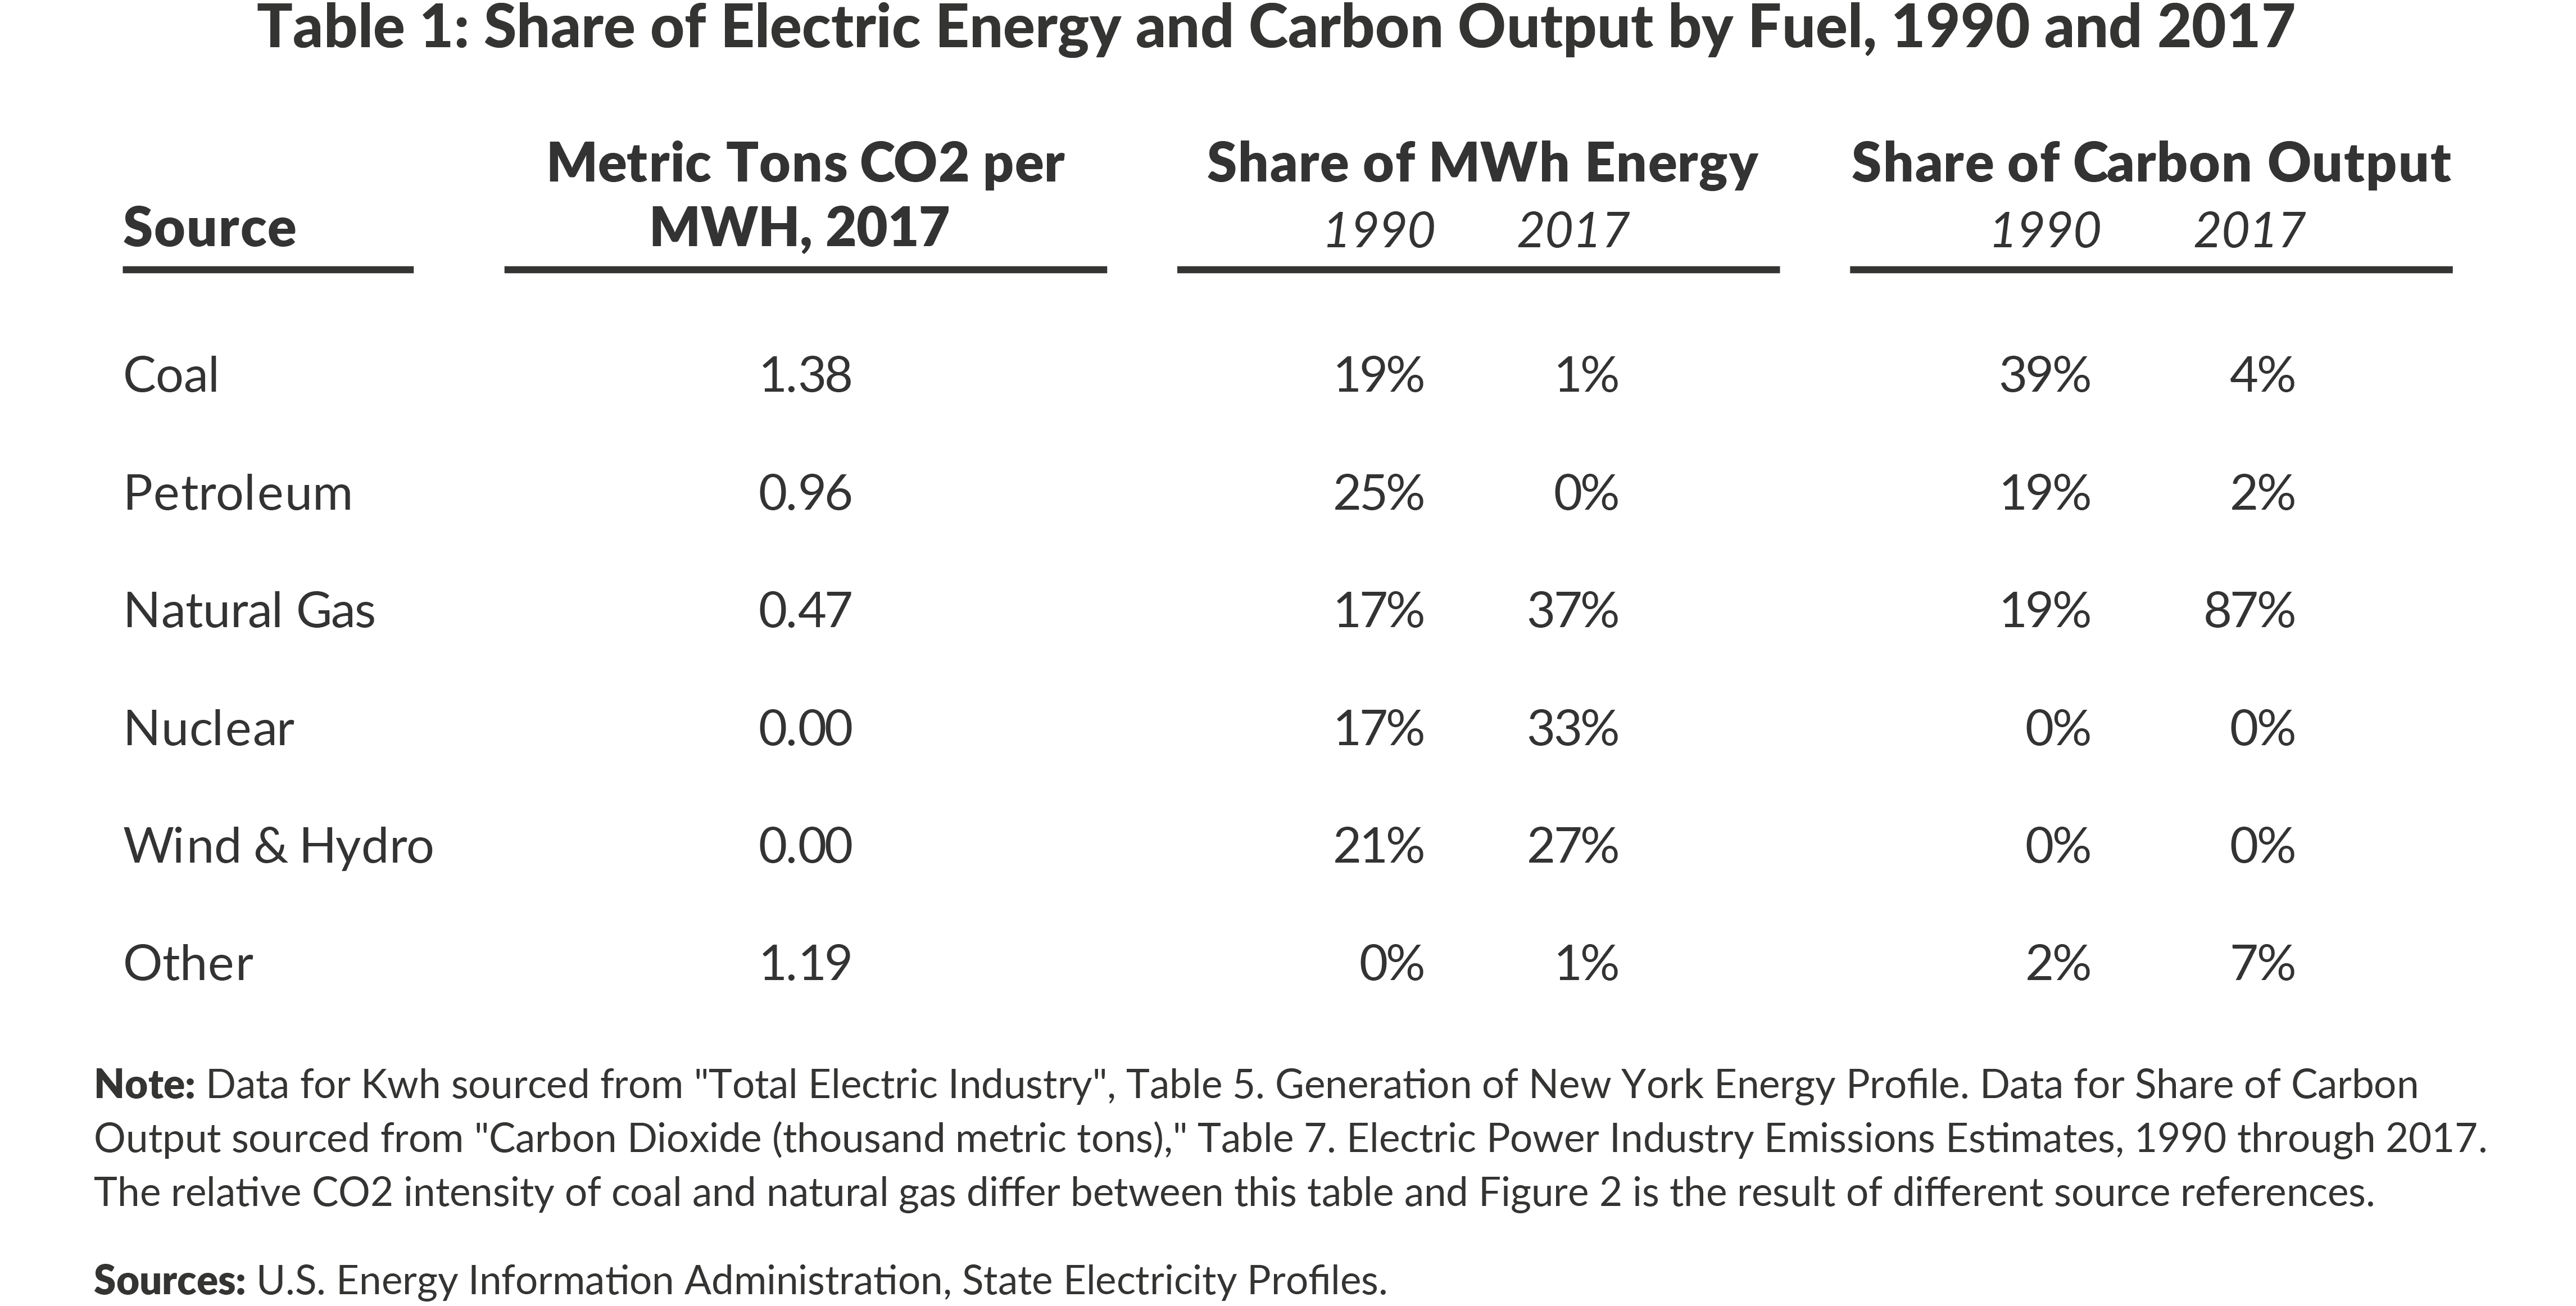
- The near total elimination of coal from the fuel mix. In 1990 coal burning power plants provided 31,000 Gigawatt-hours (Gwh) of electric energy in New York State, representing over 21 percent of total electric power generation. By 2016 that total had fallen to 1,493 Gwh which was just over 1 percent of total electric generation. This reduction was a direct outcome of efforts to shut down coal plants and the changing economics of power production, with natural gas becoming the most cost-effective generating option.
- Growing use of natural gas due to high fuel efficiency of new power plants and favorable prices. Beginning in the early 1990s more efficient combined cycle turbines capable of burning natural gas or distillate oil began entering the power production mix.12 High fuel efficiency coupled with relatively low construction costs and falling natural gas prices due to newly developed domestic resources from hydraulic fracturing (“fracking”) have made natural gas burning plants more cost-effective to operate than coal plants and, in some cases, nuclear plants.
- Increased use of nuclear power driven by improvements in the operation of nuclear power plants. In 1990 the nuclear plants in New York produced approximately 26,000 Gwh or about 17 percent of the state’s electric generation. This level of production began to improve in the late 1990s and by 2015 the New York nuclear fleet generated over 30 percent of the state’s electricity, 44,600 Gwh, an increase of 72 percent from 1990. This improvement mirrors a national trend of improved operations and output of nuclear plants during this period.
The change in the electric sector’s fuel mix (reduced use of coal, increased nuclear power production, and increased natural gas use) and the positive impact on emissions is summarized in Table 1. Natural gas produces only 34 percent as much carbon dioxide (CO2) for each megawatt-hour of energy generated when compared to coal, and while in 1990 natural gas and coal provided similar shares of New York’s power production, by 2017 coal had been nearly eliminated from the electric power production mix while natural gas had become the single largest fuel source.
2. The GHG emissions reduction in the electric power sector is remarkable because it occurred as the economy and electric power use grew, indicating the effectiveness of energy efficiency programs. The pattern of electric energy consumption has changed significantly from prior historic trends when electricity consumption increased as the economy grew. As shown in Figure 4, Gwh consumption rose at a fairly predictable rate of roughly 1 percent from 1990 to 2007. The fluctuations during that period are generally related to variations in the average temperature, with warm years requiring more electricity for air conditioning and cool years requiring less. Figure 4 presents the actual energy delivered in New York from 1990 to 2018 and also the “weather normalized” energy delivered from 2000 to 2018.13
The consumption pattern changed markedly beginning with the 2008 financial crisis contributing to a 5 percent drop in electric use from 2007 to 2009. Consumption rebounded somewhat in 2010 but has been on a weather-normalized downward trend since then, despite positive economic growth in the state over this latter period (approximately 2.0 percent average annual real GDP growth from 2008 to 2018).14 The continuation of a fundamental shift from a manufacturing economy to a service economy, and a determined and diligent implementation of a well-designed energy efficiency program led to electricity use staying flat while the economy grew from 2009 to 2018.

3. In contrast to all other sectors, GHG emissions from the transportation sector rose 24.6 percent, from 59.4 to 74.0 MMTCO2e. Emissions from residential and commercial sectors held steady, and the industrial sector dropped nearly 50 percent from 20.0 to 10.2 MMTCO2e. More than 90 percent of the energy for transportation is in the form of petroleum products with gasoline, distillate oil and jet fuel representing nearly all of the input fuels with bio-energy and natural gas representing the balance.
2.3 Comparative Perspective: New York's Emissions and Energy Costs
2.3.1 Emissions: New York Has Been a Leader in Getting Greener While Other Large States Backslide
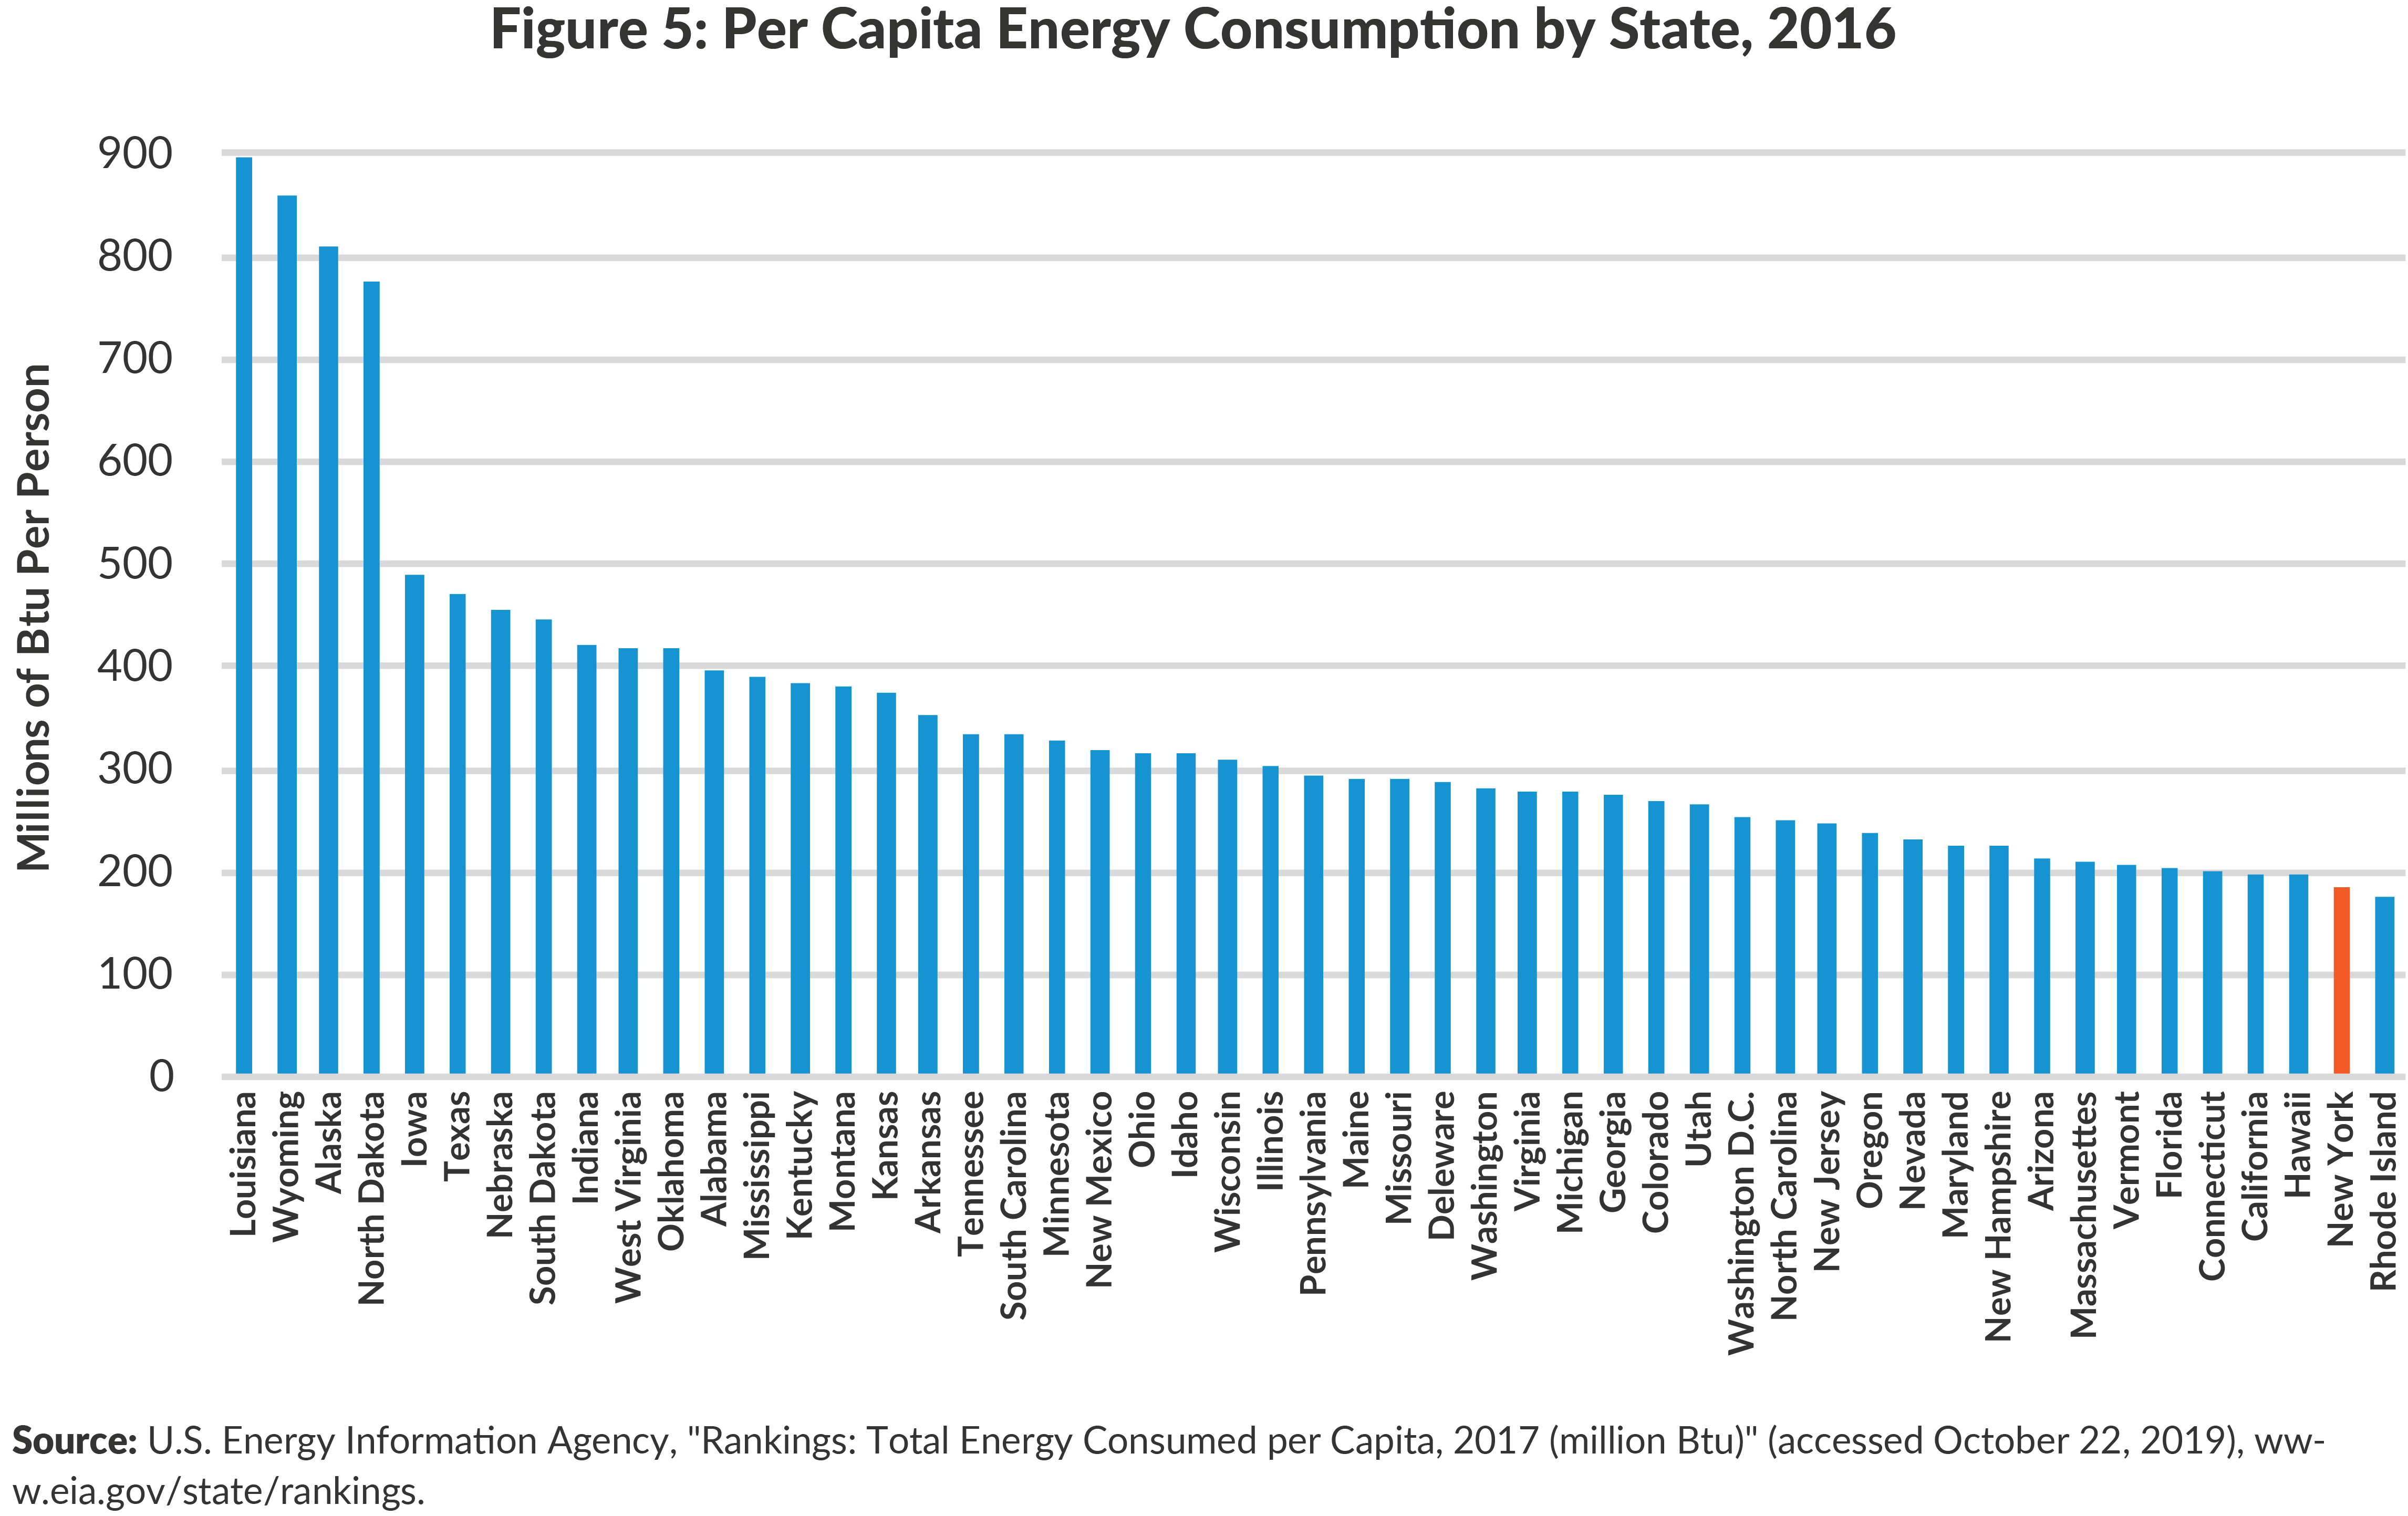
Relative to other states, on a per capita basis New York uses less energy and produces fewer carbon dioxide emissions, the most prevalent of GHGs. New York is second only to Rhode Island in lowest total energy consumed per capita.15 (See Figure 5.) Low per-capita consumption is driven largely by the extensive downstate public transportation network, which is used by nearly 30 percent of the state’s residents, a rate more than five times the national average.16 In addition, a large portion of the homes are multi-family residences which are more energy efficient than single-family homes.
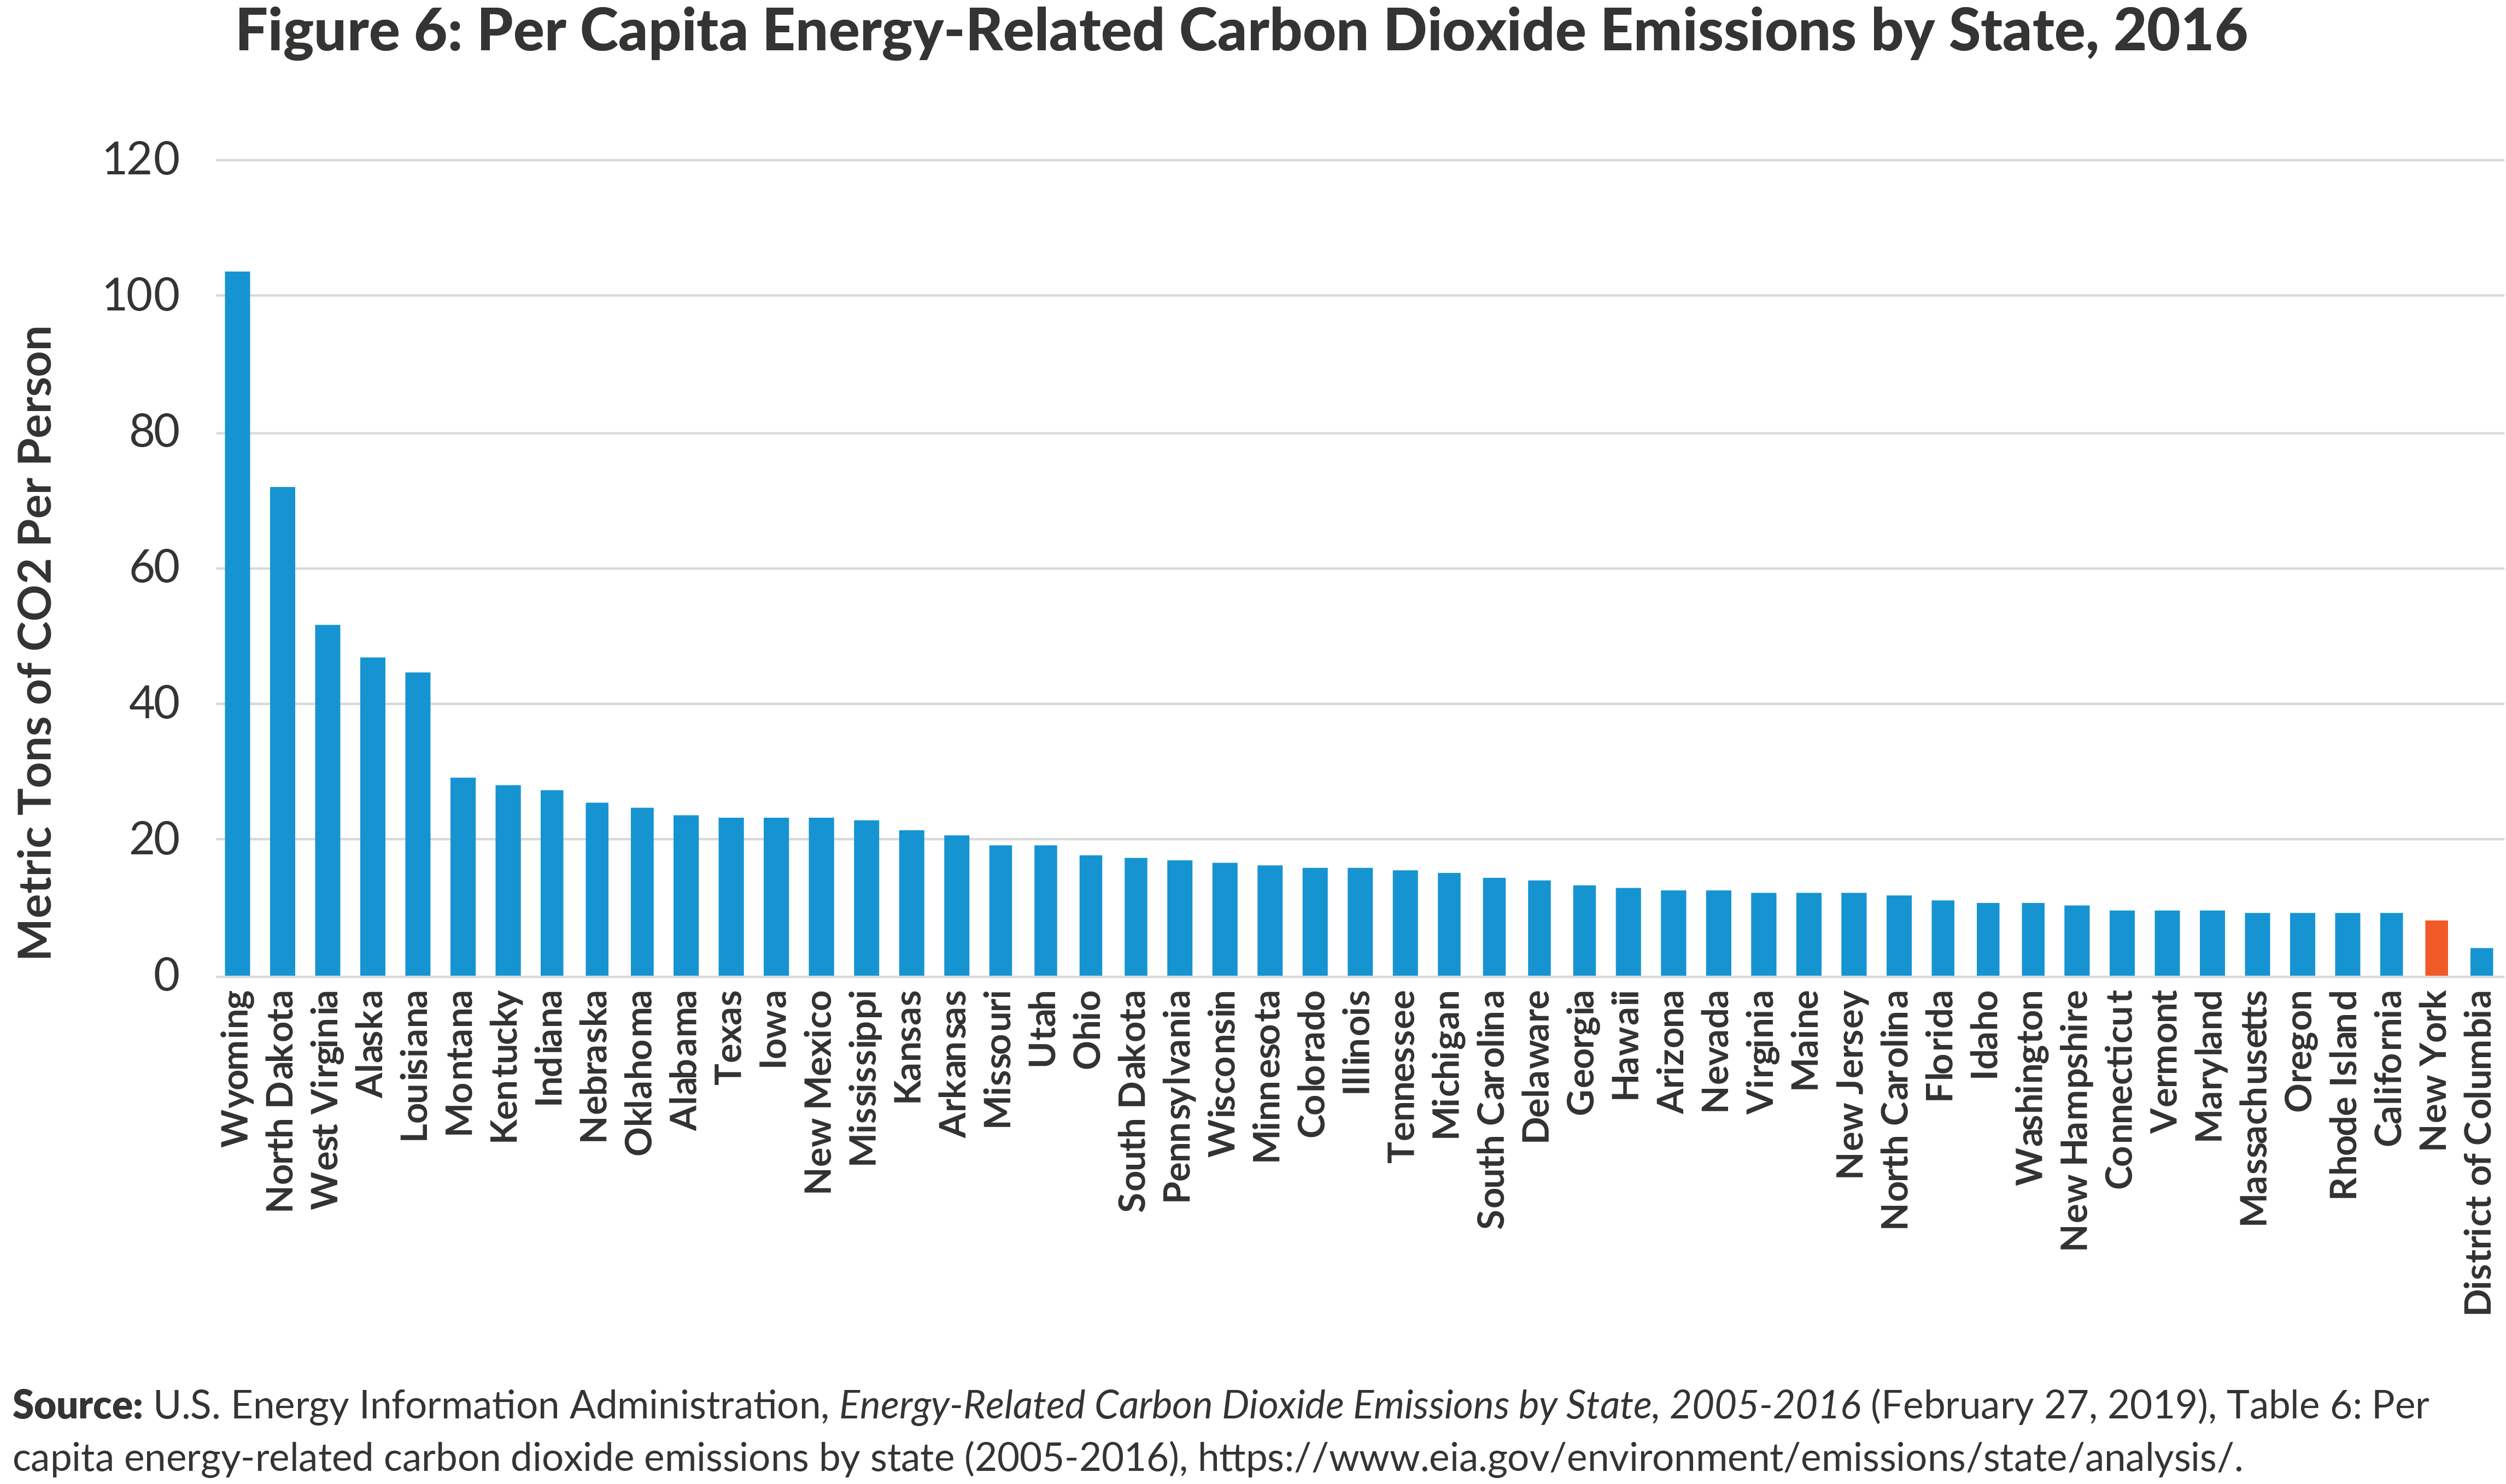
With its abundance of renewable energy and nuclear power resources and high-energy efficiency, New York generates the least energy-related carbon dioxide per capita of any state in the nation. As shown in Figure 6, in 2016 New York generated 8.2 metric tons per person of carbon dioxide while second-place California generated 9.2 tons per person. In contrast, Wyoming, North Dakota, and West Virginia generated 103.7, 71.8, and 51.7 tons per person, respectively, and the national average was nearly double that of New York at 16.0 tons per person. The high-emissions states are generally those states that extract or process energy products either by mining, drilling or refining; energy extraction and refining are energy intensive activities.
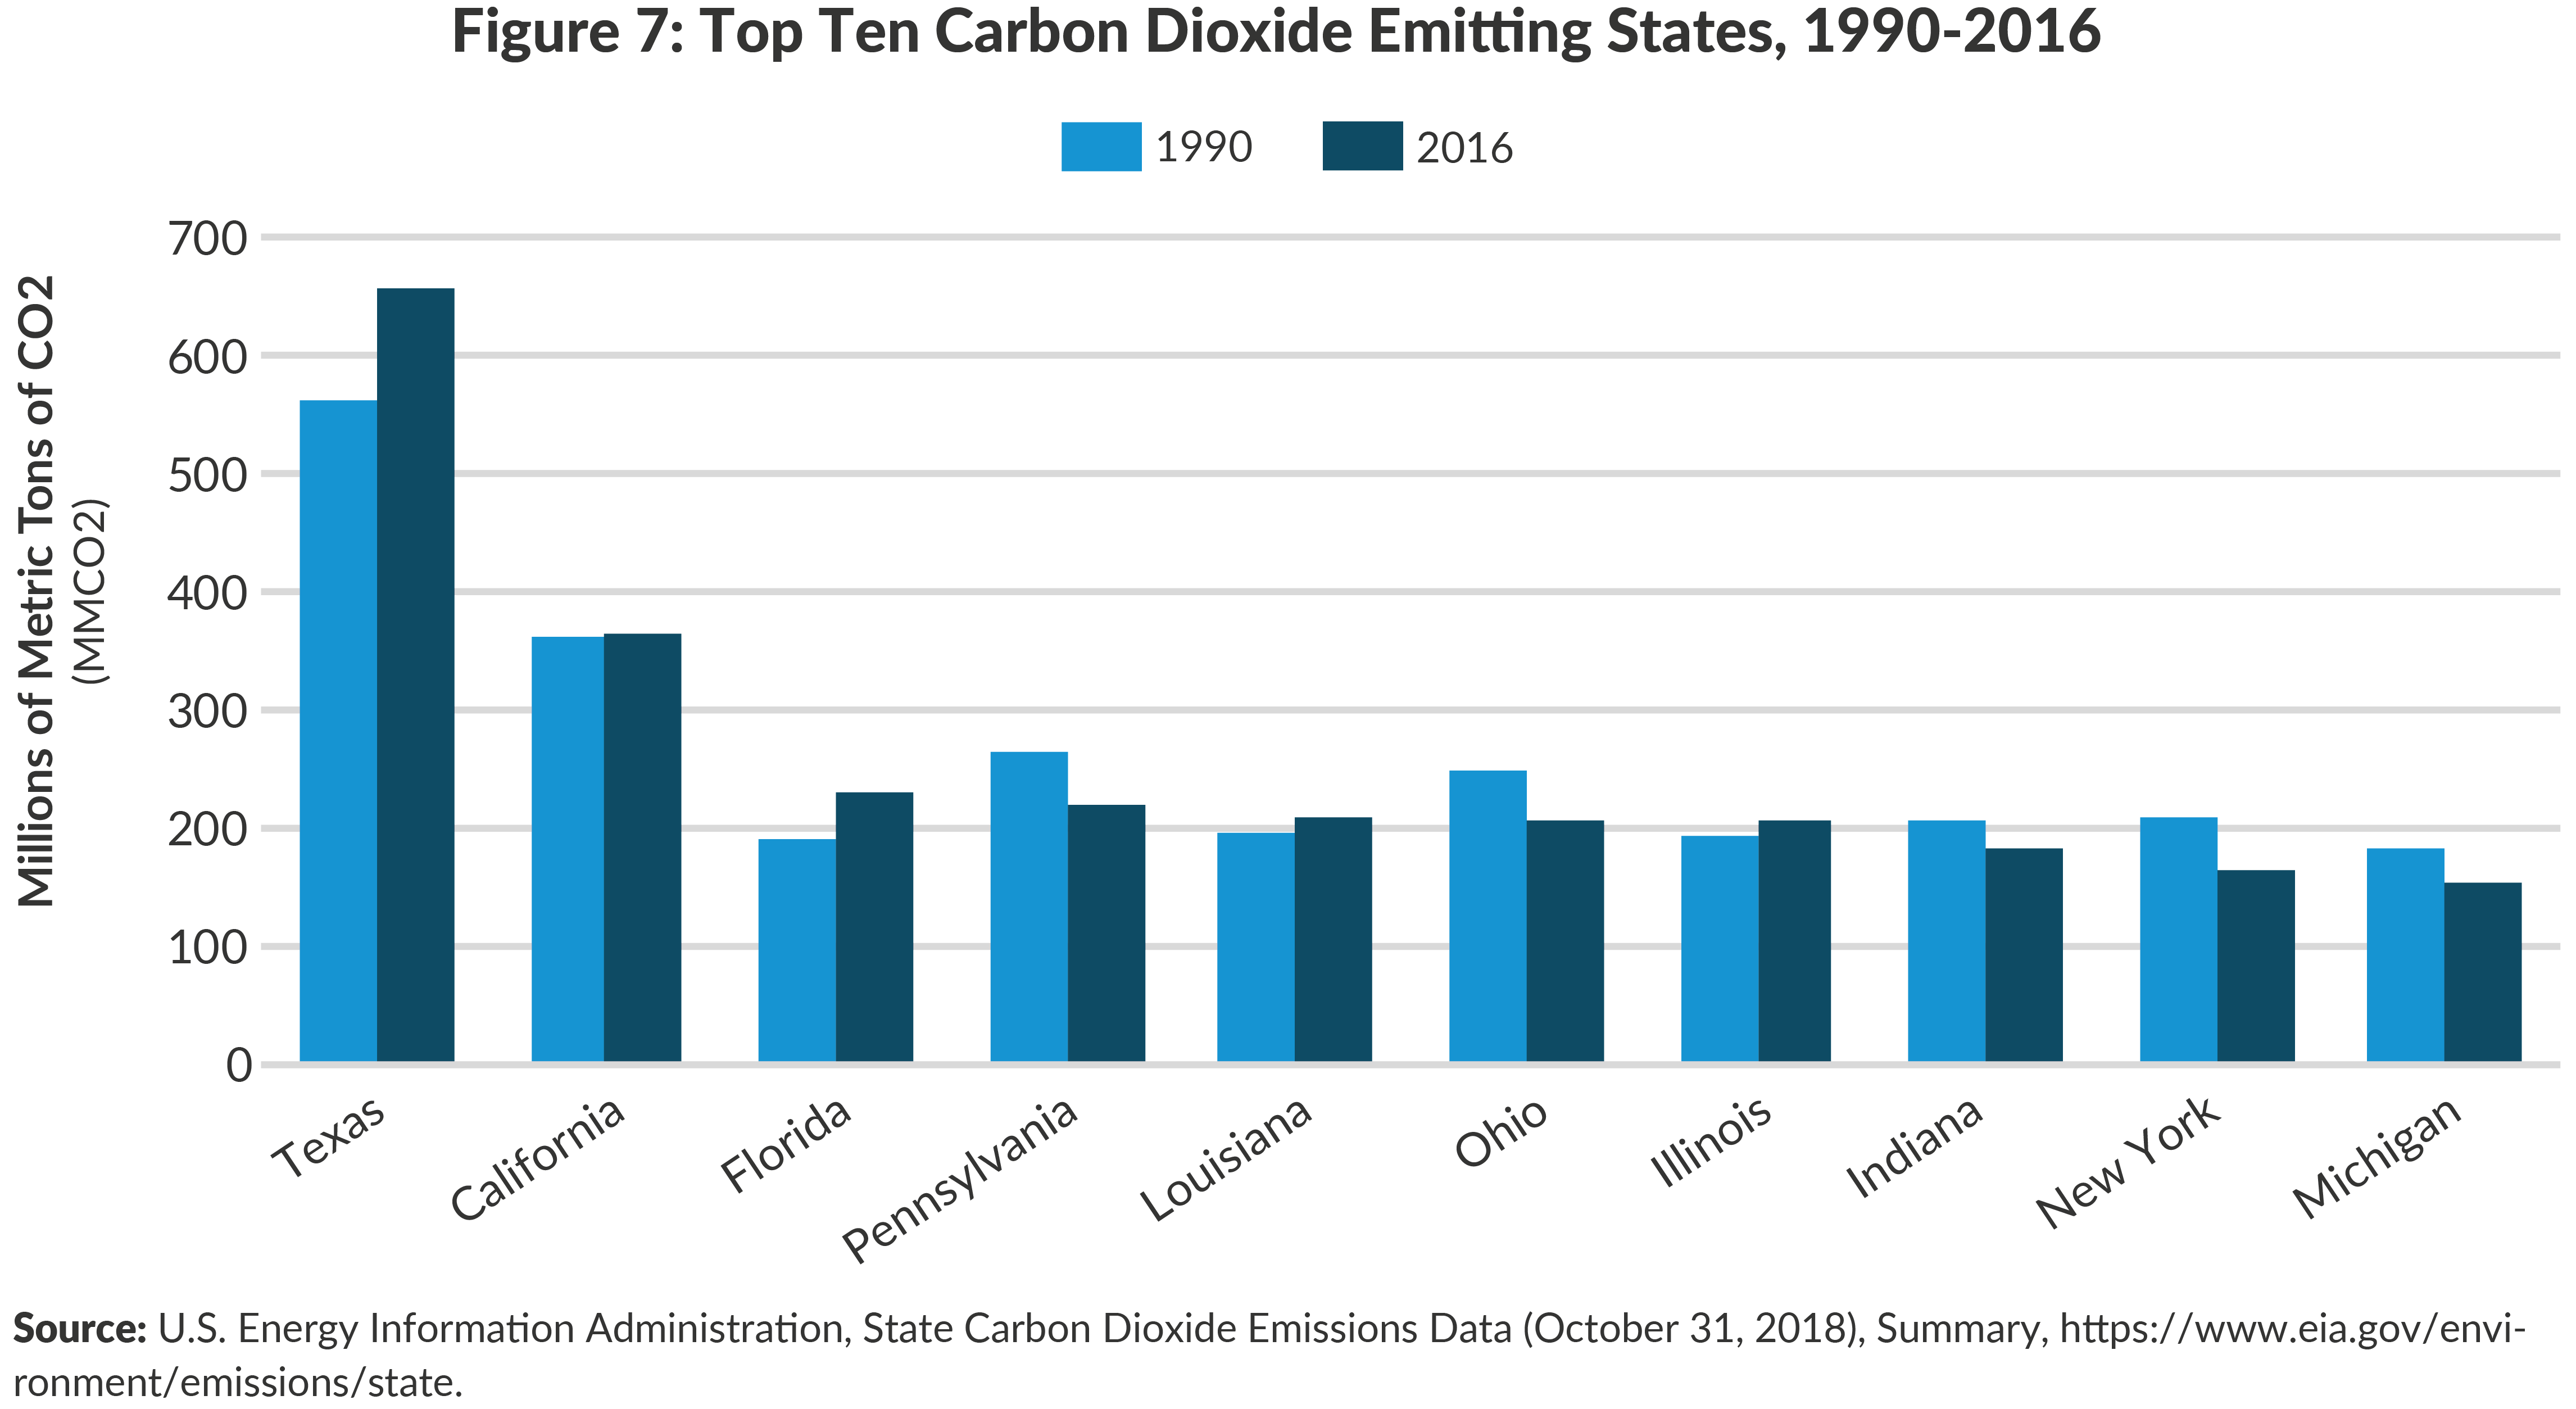
Given the size of its population and the scale of its economy, New York is overall one of the greatest emitters of CO2 emissions; however, among the top ten states, New York has also achieved the second greatest reduction between 1990 and 2016 in absolute tons at 46 MMTCO2 (versus 47 MMTCO2 for Pennsylvania) and the greatest percentage decline with a drop of 21.7 percent.17 (See Figure 7.) Other states, including Texas, Florida, Illinois and Louisiana had increases during this period that more than offset New York’s emission reductions.
2.3.2 Costs: New York's Electic Rates Are Generally Higher than U.S. Average
In the aggregate, New York State is above the national average in retail electricity prices and in 2017 was the 8th most expensive, averaging 14.74 cents/kwh compared with the national average of 10.48 cents/kwh.18
Drilling down, the picture becomes more complex. (See Table 2.) The upstate utilities (Niagara Mohawk, New York State Electric and Gas and Rochester Gas and Electric) have prices comparable to the national average. The downstate utilities (Central Hudson Gas and Electric, Consolidated Edison, the Long Island Power Authority, and Orange and Rockland), however, run significantly above the national average. The downstate utilities also serve approximately two-thirds of the electric load and so on a weighted basis skew the statewide average higher. New York also has among the lowest industrial electric prices in the country.

Some of the difference between upstate and downstate prices are driven by differences in property costs and property taxes, labor costs, and the extent of underground network systems. One persistent problem is a limitation on transmission capacity between the two parts of the state, as illustrated in Figure 8.
The New York Independent System Operator has described the situation this way: “The emerging story of the New York electric system is a tale of two grids — a tale of clean energy abundance and surplus generating capacity upstate and fossil-fuel dependence and high demand downstate. Limited transfer capability from upstate to downstate means that this tale of two grids is also a tale of two markets — where the expansion of clean energy resources is unable to reach downstate load centers, suppressing upstate wholesale prices to the point where the economic viability of generation needed for reliability is jeopardized.”19
This highlights the pressing need for additional high voltage transmission investment in New York. As it stands now, the operation of existing wind generation projects in upstate New York have been curtailed every month between January 2015 and December 2018 due to reliability and delivery constraints.20 While the amount of curtailed energy is relatively small at this time, additional planned renewable generation may exacerbate this problem. The introduction of offshore wind resources and additional solar throughout the state will change the distribution of resources, but the intermittent nature of these new renewable resources will place demands on the transmission grid that have yet to be analyzed.

THE STATE ENERGY PLAN AND THE CLIMATE LEADERSHIP AND COMMUNITY PROTECTION ACT
3.1 Overview of Broad Energy Objectives
The Climate Leadership and Community Protection Act (CLCPA) builds upon and extends a set of directives and goals that had been set out in the 2015 New York State Energy Plan and also embodied in the PSC regulatory proceedings known as Reforming the Energy Vision (REV). The CLCPA requires the creation of a 22-member Climate Action Council composed of the heads of many state agencies along with climate experts and will be appointed by the Governor, the Senate Majority and Minority leaders, and the Assembly Speaker and Minority Leader. The Council is charged with developing a scoping plan that will outline how the state will meet the renewable energy, efficiency, and community support goals of the Act. In concert with this work, the State Energy Planning Board will update the State Energy Plan. The following discussion will merge the existing State Energy Plan goals with the CLCPA goals.
The objectives of the 2015 New York State Energy Plan are to enable a “clean, resilient and affordable energy system for all New Yorkers.”21 The CLCPA adopts and extends the overarching goals of the State Energy Plan: a 40 percent reduction of GHGs from 1990 levels by 2030 and at least an 85 percent reduction by 2050. In addition, CLCPA sets out a specific path for achieving this reduction with two additional targets:
- 70 percent of electric energy produced by renewables by 2030, then “reducing 100% of the electricity sector's greenhouse gas emissions by 2040”22; and
- Improving energy efficiency through a reduction of 185 trillion Btu by 2025.
Furthermore, the CLCPA also sets specific procurement goals for:
- 9,000 MW of offshore wind by 2035;
- 6,000 MW of distributed solar generation by 2025; and
- 3,000 MW of statewide energy storage capacity by 2030.
The GHG reduction targets are the principal focus of the State Energy Plan, with the renewable energy target and the increased energy efficiency as specific means to achieve the GHG goals. The 85 percent reduction goal exceeds the 80 percent target for the United States to fulfill its obligations under the United Nations Framework Convention on Climate Change (commonly referred to as the Paris Agreement). The 40 percent reduction goal is an interim milestone target to help keep the state on track to meet the long-term goal.
3.2 Concerns with State's Ability to Achieve CLCPA Targets
New York has already reaped the benefits of low-hanging fruit: The use of coal has been almost totally eliminated, so there will be no more savings from moving away from it. The nuclear plants are operating near the top of their potential output and so there are no more zero GHG emissions megawatt-hours available to displace fossil fuels. Furthermore, the New York Commissioners of Health and Environmental Conservation have effectively banned fracking in New York State.23 Recently the DEC has sought to extend the ban to natural gas from other states that may have been produced by fracking by rejecting new pipeline projects that would increase New York’s gas import capabilities.
New York has chosen a prescriptive approach to achieve GHG targets by specifying that 70 percent of all electric energy come from renewable sources, rather than mandating that GHG emissions levels fall to a target level. The CLCPA has added further prescriptive measures by specifying that offshore wind will comprise the bulk of the renewable energy additions over the next decade. In addition, the CLCPA has set a goal of 6,000 MW of distributed solar by 2025, thereby promoting solar on residential property over lower cost, utility-scale installations.
There are four concerns with this approach:
- Based on recent experience with land-based and offshore renewable energy projects, the feasibility of scaling up the state’s renewable resources so immensely and quickly is questionable;
- By specifying a preferred resource as the path to meet GHG reductions, the state is limiting flexibility and undermining the opportunity for competition to offer innovative solutions to meet the broader goals of GHG reductions. As a result, the massive infrastructure investment required under the state’s plan to procure offshore wind capacity would lock in increased costs for electric customers;
- The emphasis on specific renewable resources has led to three policies—blocking the construction of new natural gas pipelines, decommissioning nuclear plants, and blocking hydropower—which will be counterproductive to GHG emissions reductions; and
- Continuing to drive down emissions in the electrical sector will not be sufficient to achieve long-term goals; greater focus is needed on other sectors, particularly transportation.
3.2.1 Massively Scaling Up Renewable Resources: Questionable Feasibility and High Cost
New York’s approach is geared toward the installation of a massive amount of offshore wind energy as the leading solution to reach the 70 percent goal. Importing resources is unlikely, as projects will be fully subscribed by states looking to meet their own environmental goals. It will be challenging to install the required resources in the time period to meet the goal—too few projects are underway and project timelines are lengthy. Furthermore, it could lock in potentially expensive fixed costs for New York electric customers for years to come.
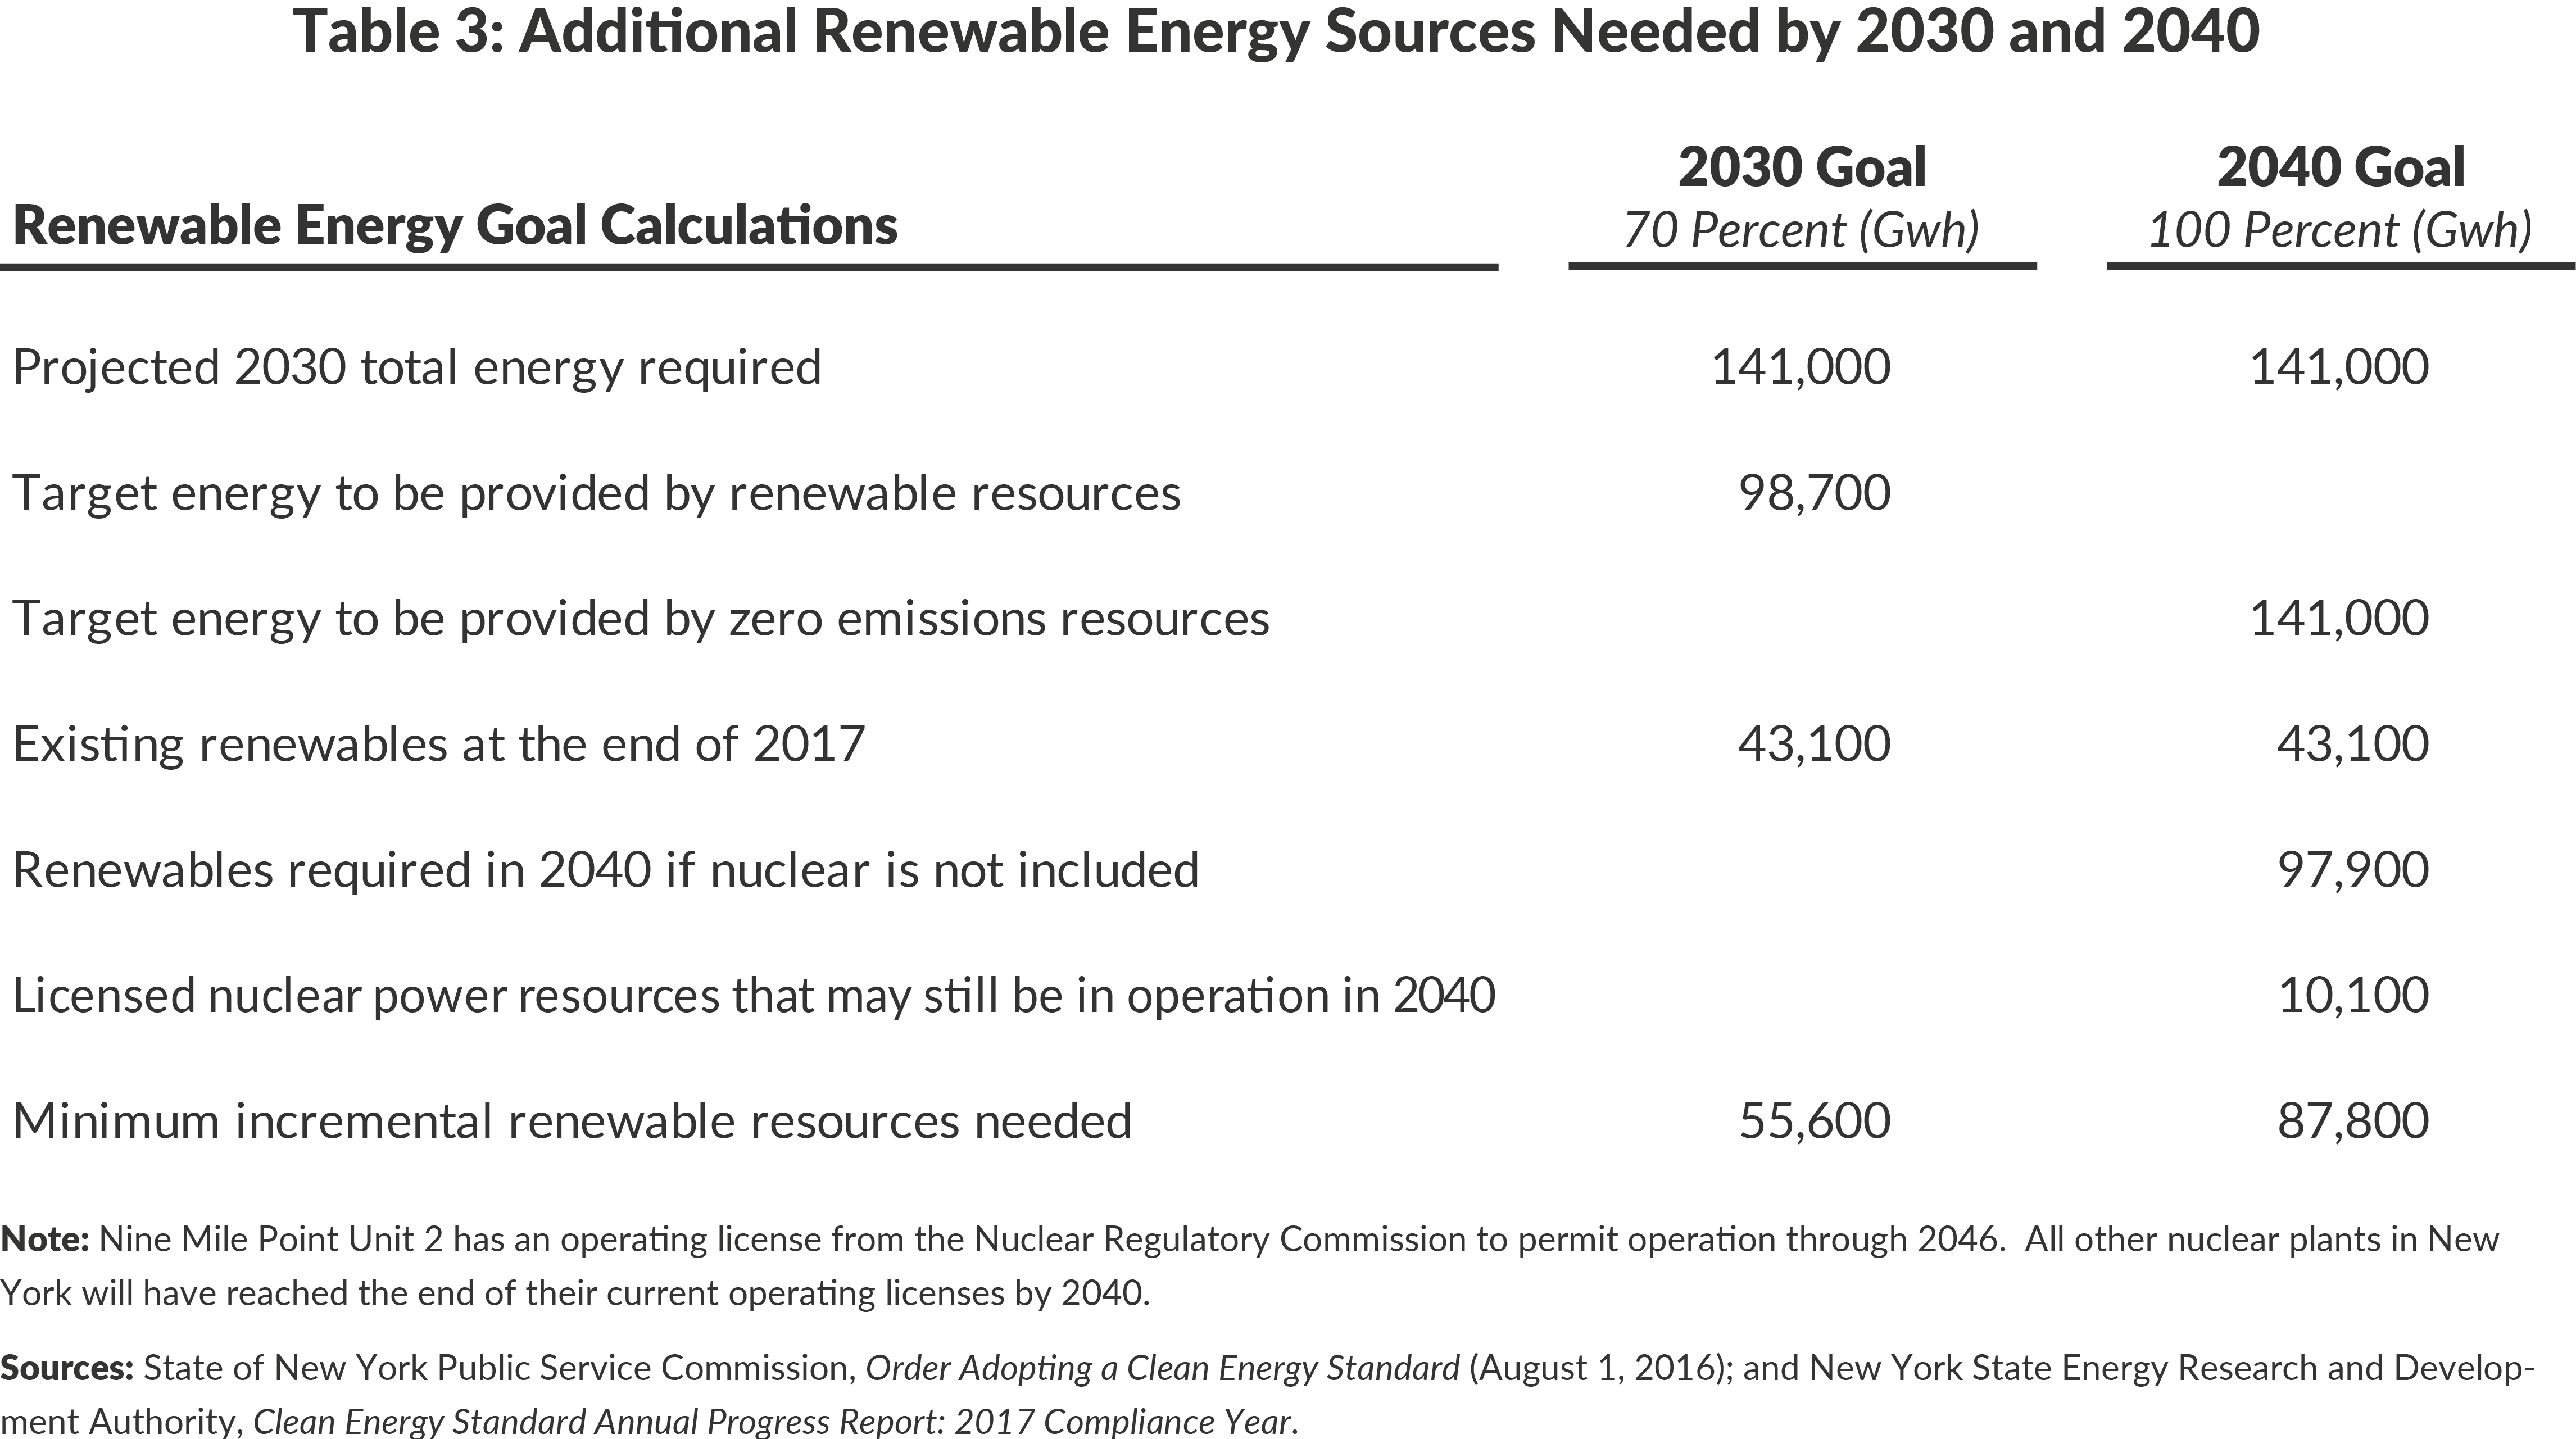
Table 3 shows how DPS determined the target level of renewable resources required in 2030. First, it projects that energy consumption will begin to fall from current levels thanks to vigorous conservation efforts, so that total energy required will be 141,000 Gwh, approximately the 1990 level. Seventy percent of this energy, 98,700 Gwh, is to be provided by renewable resources. At the end of 2017, the most recent year for which data is available, approximately 43,100 Gwh were generated by renewable resources, meaning the state needs to add 55,600 Gwh of renewable resources in the next eleven years. (It should be noted the goals for 2030 and 2040 are based on different metrics, with the 2030 focused only on renewable energy, while the 2040 goal is for zero GHG emissions; therefore, nuclear power plays a different role in meeting these two goals. There is a further discussion of nuclear power in section 3.3.1 below.)
As shown in Table 3, if nuclear power resources are not included, then the state will need 97,900 Gwh of renewable resources in 2040; if nuclear resources are included, then 87,800 Gwh of renewable resources would be needed.24 To meet this, the State would have to go further than the 9,000 Mw of offshore wind and 6,000 Mw of distributed solar power required under the CLCPA. As noted in Appendix A, meeting those procurements will only result in approximately 46,200 Gwh annually.
To facilitate increased use of renewable energy sources, the PSC has required that load-serving entities purchase mandated levels of renewable energy, represented by Renewable Energy Credits (RECs). The load-serving entities can either contract directly for RECs and sign long-term contracts or purchase them from NYSERDA. The REC regulations stipulate that only new renewable energy projects may provide RECs and all current projects are fully subscribed.
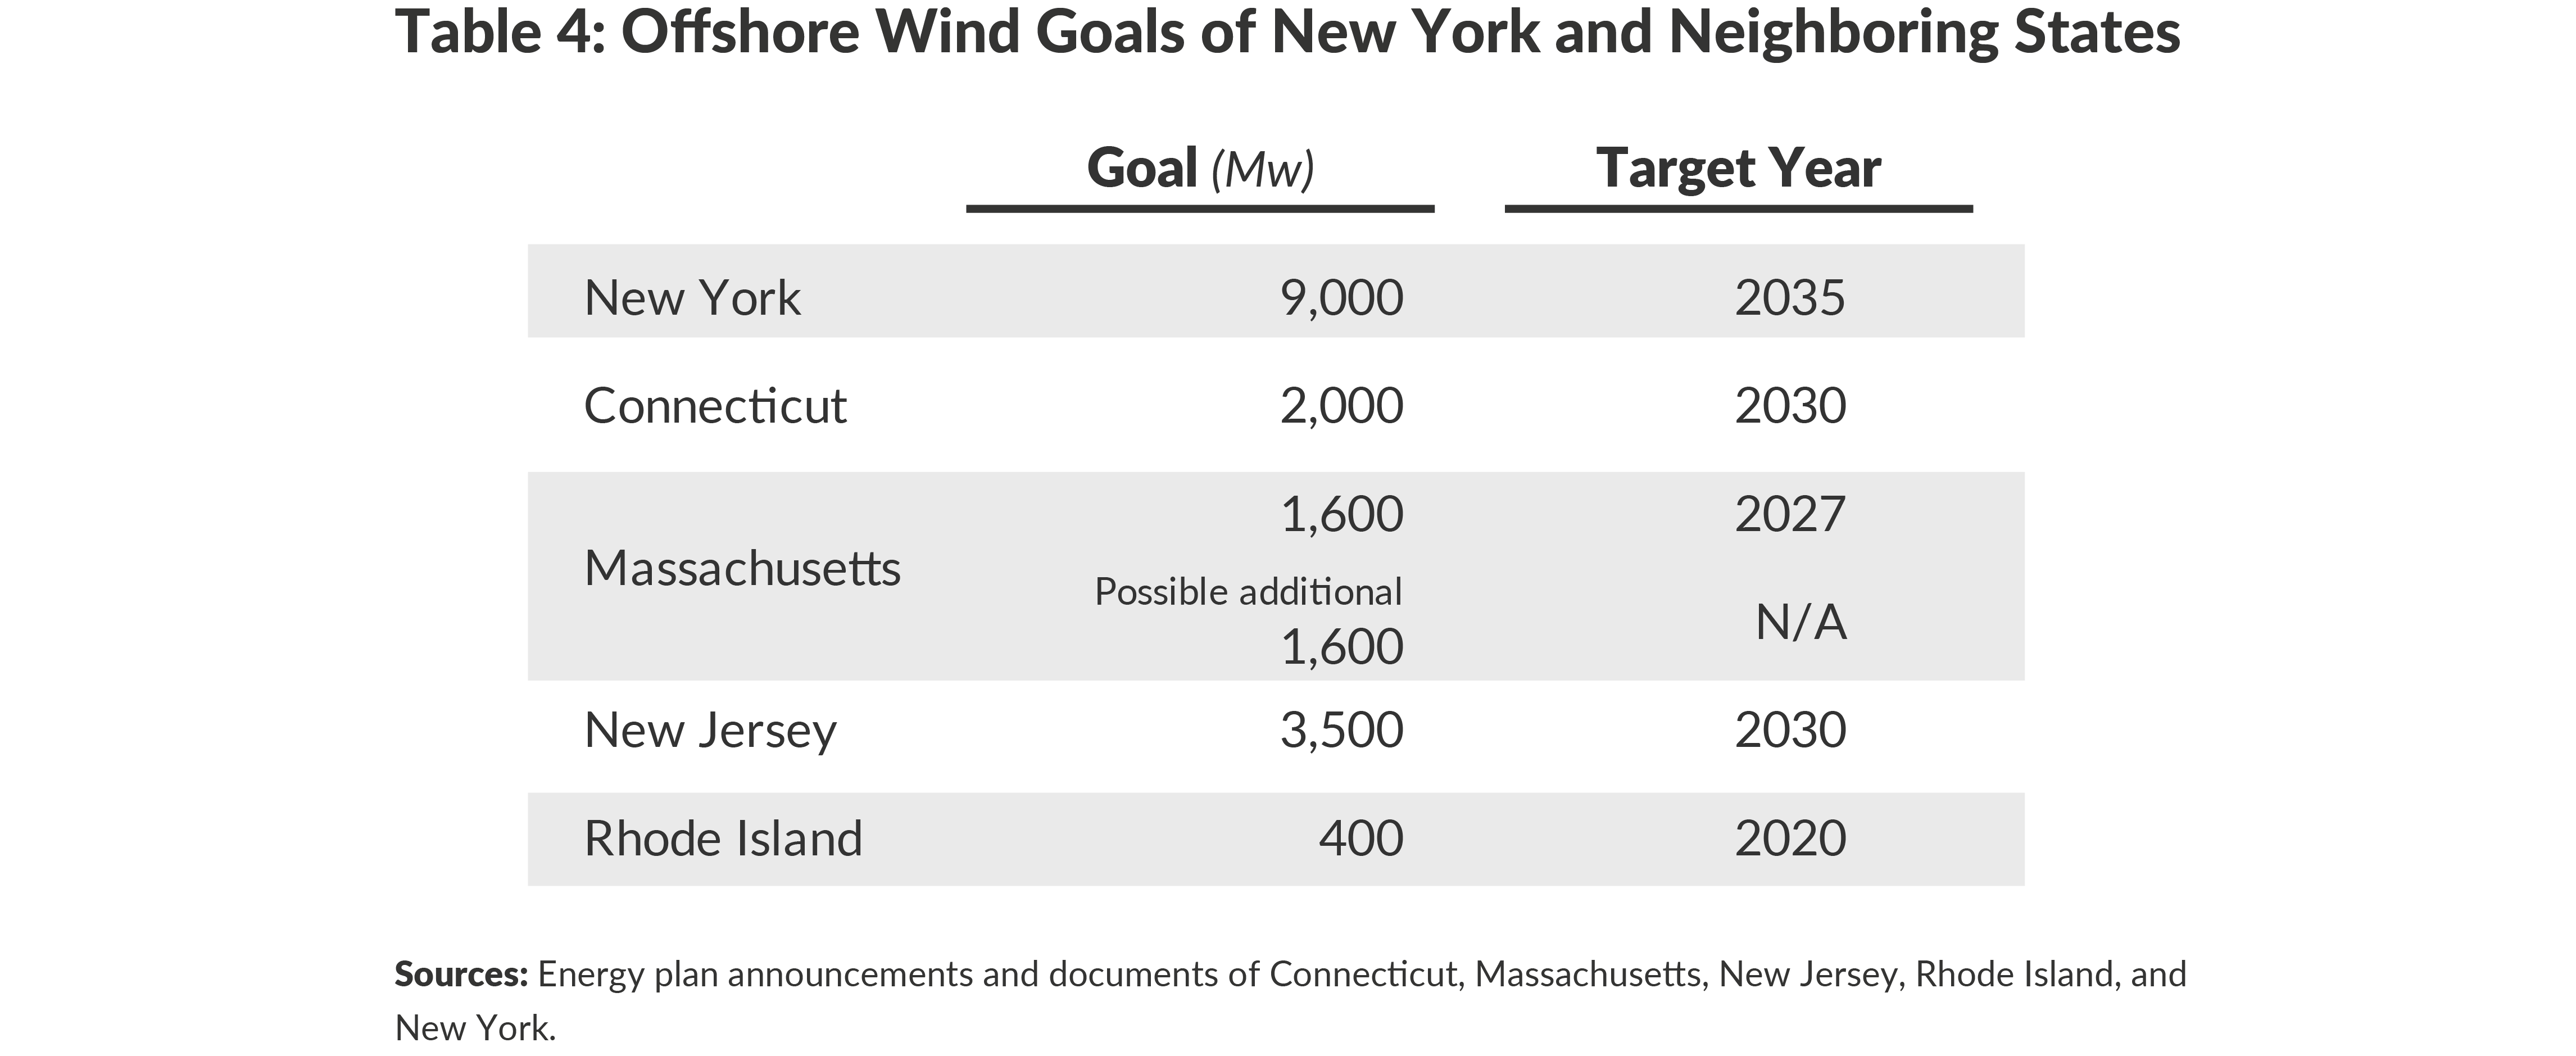
In order to meet the renewable energy goals, it is clear additional resources will need to be installed or imported. New Jersey, Connecticut, Massachusetts, and Rhode Island have all set their own ambitious renewable energy goals and each of those states is looking to offshore wind to meet those goals as summarized in Table 4. Each of these states intends to consume all the energy from these resources, which means there will not be any surplus renewable energy for New York to import and New York will have to build out the renewable resources itself.
Lengthy Timelines to Build Out Infrastructure
Every power plant has a maximum potential amount of power that it can be expected to produce over the course of the year, referred to as a capacity factor, with some of the more conventional fossil plants being able to produce power on-demand at all hours while renewable resources like solar and wind are limited by the hours of daylight or steady wind. The upshot of these differing production levels is that in order to meet the energy requirement of 55,600 Gwh per year, New York will need to install some combination of resources, as calculated in Appendix B.
NYSERDA is currently tracking dozens of projects and for which it has contracted for the output and has identified 10,884 Gwh in the pipeline. These projects are mostly a mix of solar and land-based wind with a little bit of hydroelectric, biogas and fuel cell. A few projects have gone into operation, but most are still in development. NYSERDA lists the contracted start dates but does not provide contract terms, projected lifecycle costs, or how much energy will be produced.25 NYSERDA has also begun issuing requests for proposals (RFPs) to develop offshore wind and will itself sign long-term contracts. Governor Cuomo has recently announced agreements with two different wind development teams for 1,700 MW to be sited south of Long Island and off the tip of Montauk.
Terminology: Capacity and Energy
When discussing electric power resources, the terms capacity and energy are frequently used. Capacity is given in multiples of watts. A standard lightbulb might be 60 watts and a large power plant might be 1,000 MW. One megawatt (MW) equals one million watts, and one billion watts equals one gigawatt (Gw), The peak demand for electricity in New York was set in July 2013 at 33,956 MW.
Energy is given in multiples of watt-hours. A standard 60-watt lightbulb that is on for one hour will require 60 watt-hours of energy. If it is left on for 24 hours, it will consume 1,440 watt-hours, which is equivalent to 1.44 kilowatt-hours (kwh). Over the course of the year in 2018, New Yorkers consumed approximately 161,100 gigawatt-hours (Gwh), where one gigawatt-hour equals 1 billion watt-hours or 1 million kilowatt-hours.
Getting these resources built will be a significant undertaking. Siting energy projects has become increasingly difficult. As the Article 10 siting law has been modified repeatedly, opposition has grown more sophisticated and more familiar with the regulatory and legal levers to slow or stop projects. In response, regulatory agencies have encouraged more extensive community outreach and more detailed hearing processes, which further delay and increase the cost of the projects that survive this phase of development. A March 2019 report by the New York League of Conservation Voters Education Fund also cited these challenges and additional local restrictions that impede progress to site renewable energy projects in New York State.26
While there is a general perception that offshore wind may face less opposition, both land-based and offshore projects have proceeded very slowly. The Baron Winds, LLC project based in Steuben, NY has been on the NYISO interconnection queue since 2011 and has spent eight years working its way through the Article 10 process, which give the state permitting preemption over local municipalities for any project greater than 25 megawatts, finally receiving approval on September 12, 2019. Another example is an offshore wind project initiated by NYPA in September 2011. In August 2018 the Bureau of Ocean Energy Management of the U.S. Department of the Interior, which controls the seabed and manages development rights for offshore projects, accepted a Site Acceptance Plan from a Norwegian energy company, but construction has not yet begun.27 (Refer to Text Box, Lengthy Process: Building an Offshore Wind Project, for more detail.) Delays can increase the cost of a project as construction costs rise over time.
Lengthy Process: Building an Offshore Wind Project
One recent example of a process conducted by the U.S. Department of Interior’s Bureau of Ocean Energy Management (BOEM) in New York waters was initiated by NYPA in conjunction with Consolidated Edison and the Long Island Power Authority in September 2011. With NYPA as the lead, the companies sent an unsolicited proposal to BOEM to lease 81,500 acres of seabed, suitable to host between 350 MW and 700 MW of wind turbines. BOEM determined that there was competitive interest in the parcels requested by NYPA and initiated a competitive process with a Call for Information and Nominations from interested companies on May 28, 2014, as well as seeking public input on the potential for wind development in the subject area. BOEM issued a Proposed Sale Notice on June 6, 2016 and a Final Sale Notice on October 27, 2016. A Commercial Lease auction was held on December 15 and 16, 2016 which lasted 33 rounds and Statoil, a Norwegian energy company, was named the winner with a final bid of $42.5 million. Statoil, now known as Equinor, then began an environmental permitting process that resulted in the acceptance by BOEM of a Site Acceptance Plan on August 22, 2018. Equinor has recently been named as a winner in a competitive solicitation conducted by NYSERDA for offshore wind.[28]
Similarly, the Deepwater South Fork Wind Farm project has proceeded in fits and starts and has currently paused its Federal permitting process. The project was initially proposed in 2014 as a 210 MW development and was a finalist in a competitive solicitation process conducted by the Long Island Power Authority (LIPA). Subsequently the project was reduced in size and the LIPA Board approved a contract for 90 MW on January 25, 2017. The project was then upgraded to 130 MW and LIPA issued a briefing paper in October 2019 indicating that the initial 90 MW would be priced at 16 cents/KWH and the additional 40 MW at 8.3 cents/KWH for an average price of 14.1 cents/KWH. The project developers have had ongoing difficulties agreeing with local officials on the East End of Long Island as to the location of landing point for the transmission line and this is delaying the completion of the Article 7 proceeding. There is also ongoing opposition to the project from commercial fishermen. The project is scheduled to being construction in 2021 and go into commercial operation by 2022, but the permitting difficulties raise doubts about the ability to meet this schedule.
The Cost of New Offshore Wind Generation
Building out this new infrastructure will be costly. NYSERDA is moving forward with 1,700 Mw of new offshore wind projects, from two development teams: the Empire Wind project being developed by Equinor US Holdings; and Sunrise Wind, a joint venture of Ørsted’s A/S and Eversource Energy. In announcing the results of the competitive solicitation, NYSERDA states that the contract prices “are approximately 40 percent less than projected by NYSERDA’s 2018 analysis.”29 Nevertheless, both projects require additional public subsidies to be viable: they are designed for the developers to sell the energy output into the competitive NYISO market and to then receive a supplemental payment for Offshore Wind Renewable Energy Certificates (ORECs). This supplemental payment is an above-market subsidy to ensure that the projects are economically viable.
Both contracts have a mechanism to account for the market price of capacity and energy in the future and a fallback if there is a change in methodology or legal challenge, in which case there is simply a fixed OREC price. The fixed OREC prices are different between the two contracts, with Empire using a schedule that starts at $36.35/Mwh and escalates by 2 percent per year over the twenty-five year term of the contact; and Sunrise uses a fixed price of $61.87/Mwh during its term. For the purposes of this analysis, the Empire contract schedule will be used.
The projects are expected to begin construction in 2022 and be completed by 2024, which would make 2030 the seventh year of operation. The fixed OREC price for Empire in that year would then be $40.93/Mwh.
If new offshore wind at this incremental cost of $40.93/Mwh is used to meet the goal of 55,600,000 Mwh of renewable energy in 2030, then New Yorkers will spend an extra $2.3 billion per year for electricity. This incremental cost would be an increase of between 8 percent and 12 percent on statewide electric bills, which could be a significant increase in monthly living expenses for some low-income and working class New Yorkers.
A range of factors will impact future project costs, including:
- The federal production tax credit for large wind projects is being phased out and projects that begin after December 31, 2019 will not be eligible for any tax credit;
- The press to build new projects up and down the Eastern seaboard will create competition for scarce harbor and offshore construction resources as well as the skilled labor needed to build such projects;
- Future projects will push into deeper water and be sited further from land, which may increase construction costs and will increase transmission costs; and
Economies of scale, technology advances, and construction experience may be able to counteract some of the upward price pressure.
3.2.2 Progress on Energy Efficiency Goals
The CLCPA has adopted an energy efficiency target to achieve 185 TBtu of cumulative annual site energy savings relative to forecast energy consumption in 2025.30 If the plan to meet this target is successful, NYSERDA estimates that it will provide 30 percent of the GHG reductions needed to reach the 2030 GHG target.
NYSERDA has recently implemented an online dashboard to track progress towards these goals (available online at https://rev.ny.gov/cleanenergydashboard). The dashboard reports on programs that NYSERDA directly manages under the Clean Energy Fund and programs managed by investor-owned utilities. At the end of the first quarter of 2019, total reported savings are 30.3 TBtu, with 18.0 TBtu from the utility programs and the balance from NYSERDA. The dashboard is still in the early stages of operation and may not yet be capturing all program savings. NYSERDA staff have expressed confidence that the programs as currently configured will be able to meet the 185 TBtu goal by 2025.31 There is little information available at this time regarding the cost-effectiveness in terms of energy consumption reduced or tons of carbon emission avoided per dollar spent on a program-by-program basis.
3.3 Counterproductive Policies
The core environmental objective of the CLCPA and the State Energy Plan is the elimination of greenhouse gas emissions. Both also focus on the need to build climate resilient communities, protect the most economically and environmentally vulnerable communities, and create jobs in a new energy economy. The implementation program of NYSERDA, the PSC, and the DEC has limited use of three technologies that are positioned to help New York hold down GHG emissions: nuclear power, natural gas transmission, and hydroelectric energy from new impoundments.
3.3.1 Shutting Down Nuclear Plants Will Likely Reverse Past Gains
There are six nuclear power units at four stations throughout New York and in 2018 they produced a total of 43,000 Gwh, equal to 28.1 percent of the electric energy delivered in New York. Two units located downstate at the Indian Point Energy Center provided 16,300 Gwh that year, and are set to shut down in 2020 and 2021. Three more units (Nine Mile Point 1, Fitzpatrick, and Ginna) have operating licenses that will expire between 2029 and 2034 and these plants accounted for 16,600 Gwh. The sixth unit, Nine Mile Point 2, produced 10,100 Gwh in 2018 and its operating license runs to 2046.
The PSC has recognized the contribution that nuclear power plants make to avoiding GHG emissions with the establishment of Zero Emissions Credits (ZECs) in its Clean Energy Standard (CES) Order issued August 1, 2016. The CES incorporates two mandatory payment schemes: one supports the development of renewable energy resources via renewable energy credits (RECs) and the other supports the continued operation of four upstate nuclear power plants via ZECs. The cost of the ZECs is added to the bills of all electric customers in New York. Indian Point Energy Center Units 2 and 3 are not included in the ZEC payment plan. The ZECs expire in 2029 and it is conceivable that the entire fleet of nuclear plants may shut down at that point unless the ZEC program is extended.
If these plants are shut down, the energy needed from them will, at least initially, be supplied by natural gas burning plants that will produce approximately 20 MMTCO2e per year.32 The increased demand for natural gas could also put a strain on the existing gas transmission system, a system whose expansion has been limited in recent years (see Section 3.3.2 of this paper). Every large power plant in New York that uses natural gas as a fuel also has a backup supply of another fossil fuel (kerosene, butane, fuel oil #2) and will switch to the backup when the gas transmission system is in high demand to provide gas for heating. The existing natural gas transmission system has been capable of supplying fuel for these plants on this “interruptible” basis but it is unclear whether the system in New York has the capacity to supply the energy needs to replace all the nuclear plants when they shut down.
As noted previously, GHG emissions from the power sector have dropped 33.3 MMTCO2e from 1990 to 2016. The elimination of the nuclear fleet will erase nearly all of those gains achieved over that 26-year period if replaced by natural-gas powered sources. Figure 9 summarizes the timing and change in power production and GHG emissions as the nuclear power plants are shut down.
Although many nuclear plants in the US were expensive to build (with high fixed capital costs), they have low operating costs and for many years have been the resource that provides the baseload for the electric grid in New York and across the country.33 The development and expansion over the past 15 years of new natural gas supplies has brought down the price of natural gas generated electricity to the point that natural gas plants are now often the baseload resources. This shift has created a situation where the nuclear plants are not running enough to cover all of their fixed capital costs and many owners are considering shutting these units down.
It is worth emphasizing that nuclear resources could continue to contribute significantly to emissions goals. After Indian Point shuts down in 2021, the remaining nuclear plants, continuing to operate at current levels, would produce 26,700 GWh. This would make the sum of existing renewable generation, new renewable generation, and nuclear generation a total of 133,800 Gwh of zero emission resources against an expected demand of 141,000 Gwh, meaning that New York’s electric sector would be 95 percent GHG-emission free. The expiration of the ZEC program and expected end of operating licenses, however, makes this result unlikely.

3.3.2 Blocking Natural Gas Pipelines Inhibits a Dependable and Economic Resource
Most coal-fired plants have been shuttered in New York, so the primary role for natural gas in promoting GHG reductions is to provide an economical alternative to oil-fired heating, as a substitute transportation fuel, and to power natural gas plants that supply energy when intermittent renewable resources like wind and solar are not available.
Natural Gas: Bridge to a Clean Energy Future
“In broad terms, we find that, given the large amounts of natural gas available in the U.S. at moderate cost (enabled to a large degree by the shale gas resource), natural gas can indeed play an important role over the next couple of decades (together with demand management) in economically advancing a clean energy system.”
- Ernest Moniz, Director, MIT Energy Initiative, July 19, 2011, Testimony presented to U.S. Senate Committee on Energy and Natural Resources.
Dr. Moniz reiterated this position during his confirmation hearings and subsequently as Secretary of Energy. On a national level, an active natural gas market is essential to driving GHG reductions by making the fuel available to continue to replace coal-fired generation.
A strong opposition to any fuel source that produces GHGs has resulted in constraints on expansion of natural gas through refusal to grant water permits to several natural gas pipelines. For example, on May 15, 2019 the DEC denied water permits necessary for the construction of the Northeast Supply Enhancement Project (also known as the Williams Pipeline Project).34 Other projects rejected over the past few years include the Constitution Pipeline project (2016), and the National Fuels Corp project (2017). This action appears motivated by a general opposition to the use of fossil fuels, specifically the hydraulic fracturing methods used outside New York to extract new supplies of natural gas, and could limit economic growth if new gas customers are turned away.
The opposition to new natural gas pipeline capacity is already having an impact on the retail market for natural gas serving homes and buildings. Consolidated Edison and National Grid have been sufficiently concerned about the adequacy of natural gas supplies that each has instituted a moratorium on new natural gas customers in portions of its service area. Consolidated Edison has proposed several non-pipeline alternatives to meet future demand for natural gas, including efficiency programs to reduce natural gas consumption and thereby free up capacity for new customers; and delivering compressed natural gas (CNG) or liquefied natural gas (LNG) by truck.35 There are likely to be public safety concerns with truckloads of CNG or LNG entering New York City. The number of truck-loads will depend on the total demand for natural gas. The PSC has approved a series of energy efficiency programs proposed by Consolidated Edison but has deferred making a decision on supply-side issues. It has instead directed the company to resubmit those plans as part of a standard gas rate case filing.36 National Grid has recently lifted its moratorium on new natural gas interconnections and will be submitting its own set of non-pipeline alternatives, which are likely to be similar to those of Consolidated Edison, including CNG and LNG deliveries.
3.3.3 Shortsighted Constraints on Importing Clean Hydroelectric Power
In 2017 hydroelectric energy represented 88 percent of the 43,100 Gwh of renewable energy registered under the New York Generation Attributes Tracking System (NYGATS); with much of that energy being produced within New York by the NYPA dams at Niagara Falls and the St. Lawrence Seaway, and the balance imported to New York. This imported hydro has been recognized as an essential element of New York’s ability to meeting renewable portfolio goals since the Renewable Portfolio Standard was first adopted in 2004 by the PSC.
The RPS established criteria for resources eligible to count towards the renewable energy goals and these resources were initially referred to as “Main Tier” resources and are now identified as “Tier 1 RECs.” When the RPS was issued, the PSC limited hydro projects to the incremental output from upgrades provided there was no new impoundment (dam) constructed.37 This policy was reaffirmed with the issuance of the Clean Energy Standard, which imposed an obligation on load serving entities (companies selling electric energy through the transmission and distribution system) to purchase Tier 1 RECs.
The administrative history in the original RPS order provides little background for the rationale against new impoundments. This policy may have stemmed from local opposition in Canada to additional hydro exports and also been driven by concern for potential GHG emissions from new hydro facilities. Although it is correct that there are methane emissions from the surface of hydro impoundments, lifecycle GHG emissions from hydro facilities are on a par with wind and solar (see Background: Greenhouse Gas, and Figure 2).
Recently, a privately developed transmission project, the Champlain Hudson Power Express (CHPE) obtained all necessary permits to construct a 330-mile transmission line from the U.S.–Canada border to New York City. The project has a designed capacity of 1,000 Mw and is expected to be able to deliver approximately 8,000 Gwh per year to New York. The project developers are seeking a long-term delivery contract of hydropower, but have not yet concluded a deal. The absence of Tier 1 RECs has an impact on the price negotiations and ultimately whether the energy will be counted as renewable power.
3.4 Achieving Long-Term Targets Requires GHG Reductions in Other Sectors, Particularly Transportation
The path to the long-term GHG reduction target of 85 percent by 2050 has not yet been explicitly outlined. The CLCPA Climate Action Council (CAC) is directed to provide a scoping plan within two years of CLCPA passage to attain statewide targets. The CLCPA also requires the establishment of advisory panels on transportation, energy intensive and trade-exposed industries, land-use and local government, energy efficiency and housing, power generation, and agriculture and forestry to provide recommendations to the CAC.
While a major focus of the CLCPA is to move New York to an electric supply delivered solely from renewable power, it is clear that the long-term path must include additional sectors – in particular transportation and heating. Tackling these sectors has been a part but not a highlight of the state’s energy strategy. A significant increase in effort in these sectors will be essential to meeting the goal and will have serious long-term impact on the grid and on transmission capacity. Transportation and heating are now provided by the combustion of fossil fuels, and to achieve the GHG reduction objectives, these end-uses must be “decarbonized,” and the fossil fuels replaced with electricity from sources that do not emit GHGs.
GHG emissions from the transportation sector grew 25 percent between 1990 and 2016.38 More than 90 percent of the energy for transportation is in the form of petroleum products with gasoline, distillate oil and jet fuel representing nearly all of the input fuels with bio-energy and natural gas representing the balance. In 2015 the state consumed approximately 800 TBtu of petroleum fuels (jet fuels excluded).39 New York would need to deliver an additional 37,000 to 49,000 Gwh per year of energy to power all non-jet transportation.40 In order to meet decarbonization goals, all of this new power production must be from non-emitting sources.
In 1990 the residential and commercial sectors combined for 60.8 MMTCO2e of GHG emissions, equal to about 26 percent of the New York’s GHG emissions and by 2016 that figure had dropped to 51.6 MMTCO2e; however, that continues to be about one-quarter of the state’s GHG emissions. Most of those emissions are associated with space heating and cooling and water heating. Most space heating and water heating is provided by fossil fuels, while most space cooling is powered by electricity. NYSERDA has estimated that in 2018 557 TBtu was consumed for space heating.41 If it were possible to convert all the space heating load to the efficiency of heat pumps and meet that load with electricity, this would result in an additional electric demand of approximately 39,800 Gwh or an approximately 25 percent increase in electricity consumption compared to 2016 levels.42 As with the transportation figure, this estimate is provided to indicate a potential order of magnitude.
3.4.1 A Note on the Impact of Long-Term Electrification
The National Renewable Energy Laboratory, the Electric Power Research Institute, NYSERDA, and other organizations have all investigated this topic, but none has yet completed a definitive assessment of the long-term impacts on the grid of these additional electric demands. The foregoing analysis suggests that electrification of transportation and heating could add nearly 90,000 Gwh to statewide consumption, which was approximately 160,000 Gwh in 2015 but is projected by NYSERDA to fall to 141,000 by 2030.
This new energy will have to be provided from non-emitting sources in order to reduce GHG emissions and will be in addition to the offshore wind resources and distributed solar presently mandated by the CLCPA. To meet the CLCPA’s goals New York will need to add 55,600 Gwh (refer to Table 3) for existing electric use; this 90,000 Gwh would be additive to that total.
This additional generation will need to be sited and transmission lines run to increase the state’s delivery capacity. There is also likely to be an increase in peak supply requirements for some segments of the distribution network as certain areas switch from a light summer peak for air conditioning to winter peaking for heating. This could be especially problematic in areas upstate that now experience limited air conditioning loads but have cold winters which could require much greater electricity deliveries than in the past.
3.5 Forecast: Resources Needed to Meet CLCPA Goals
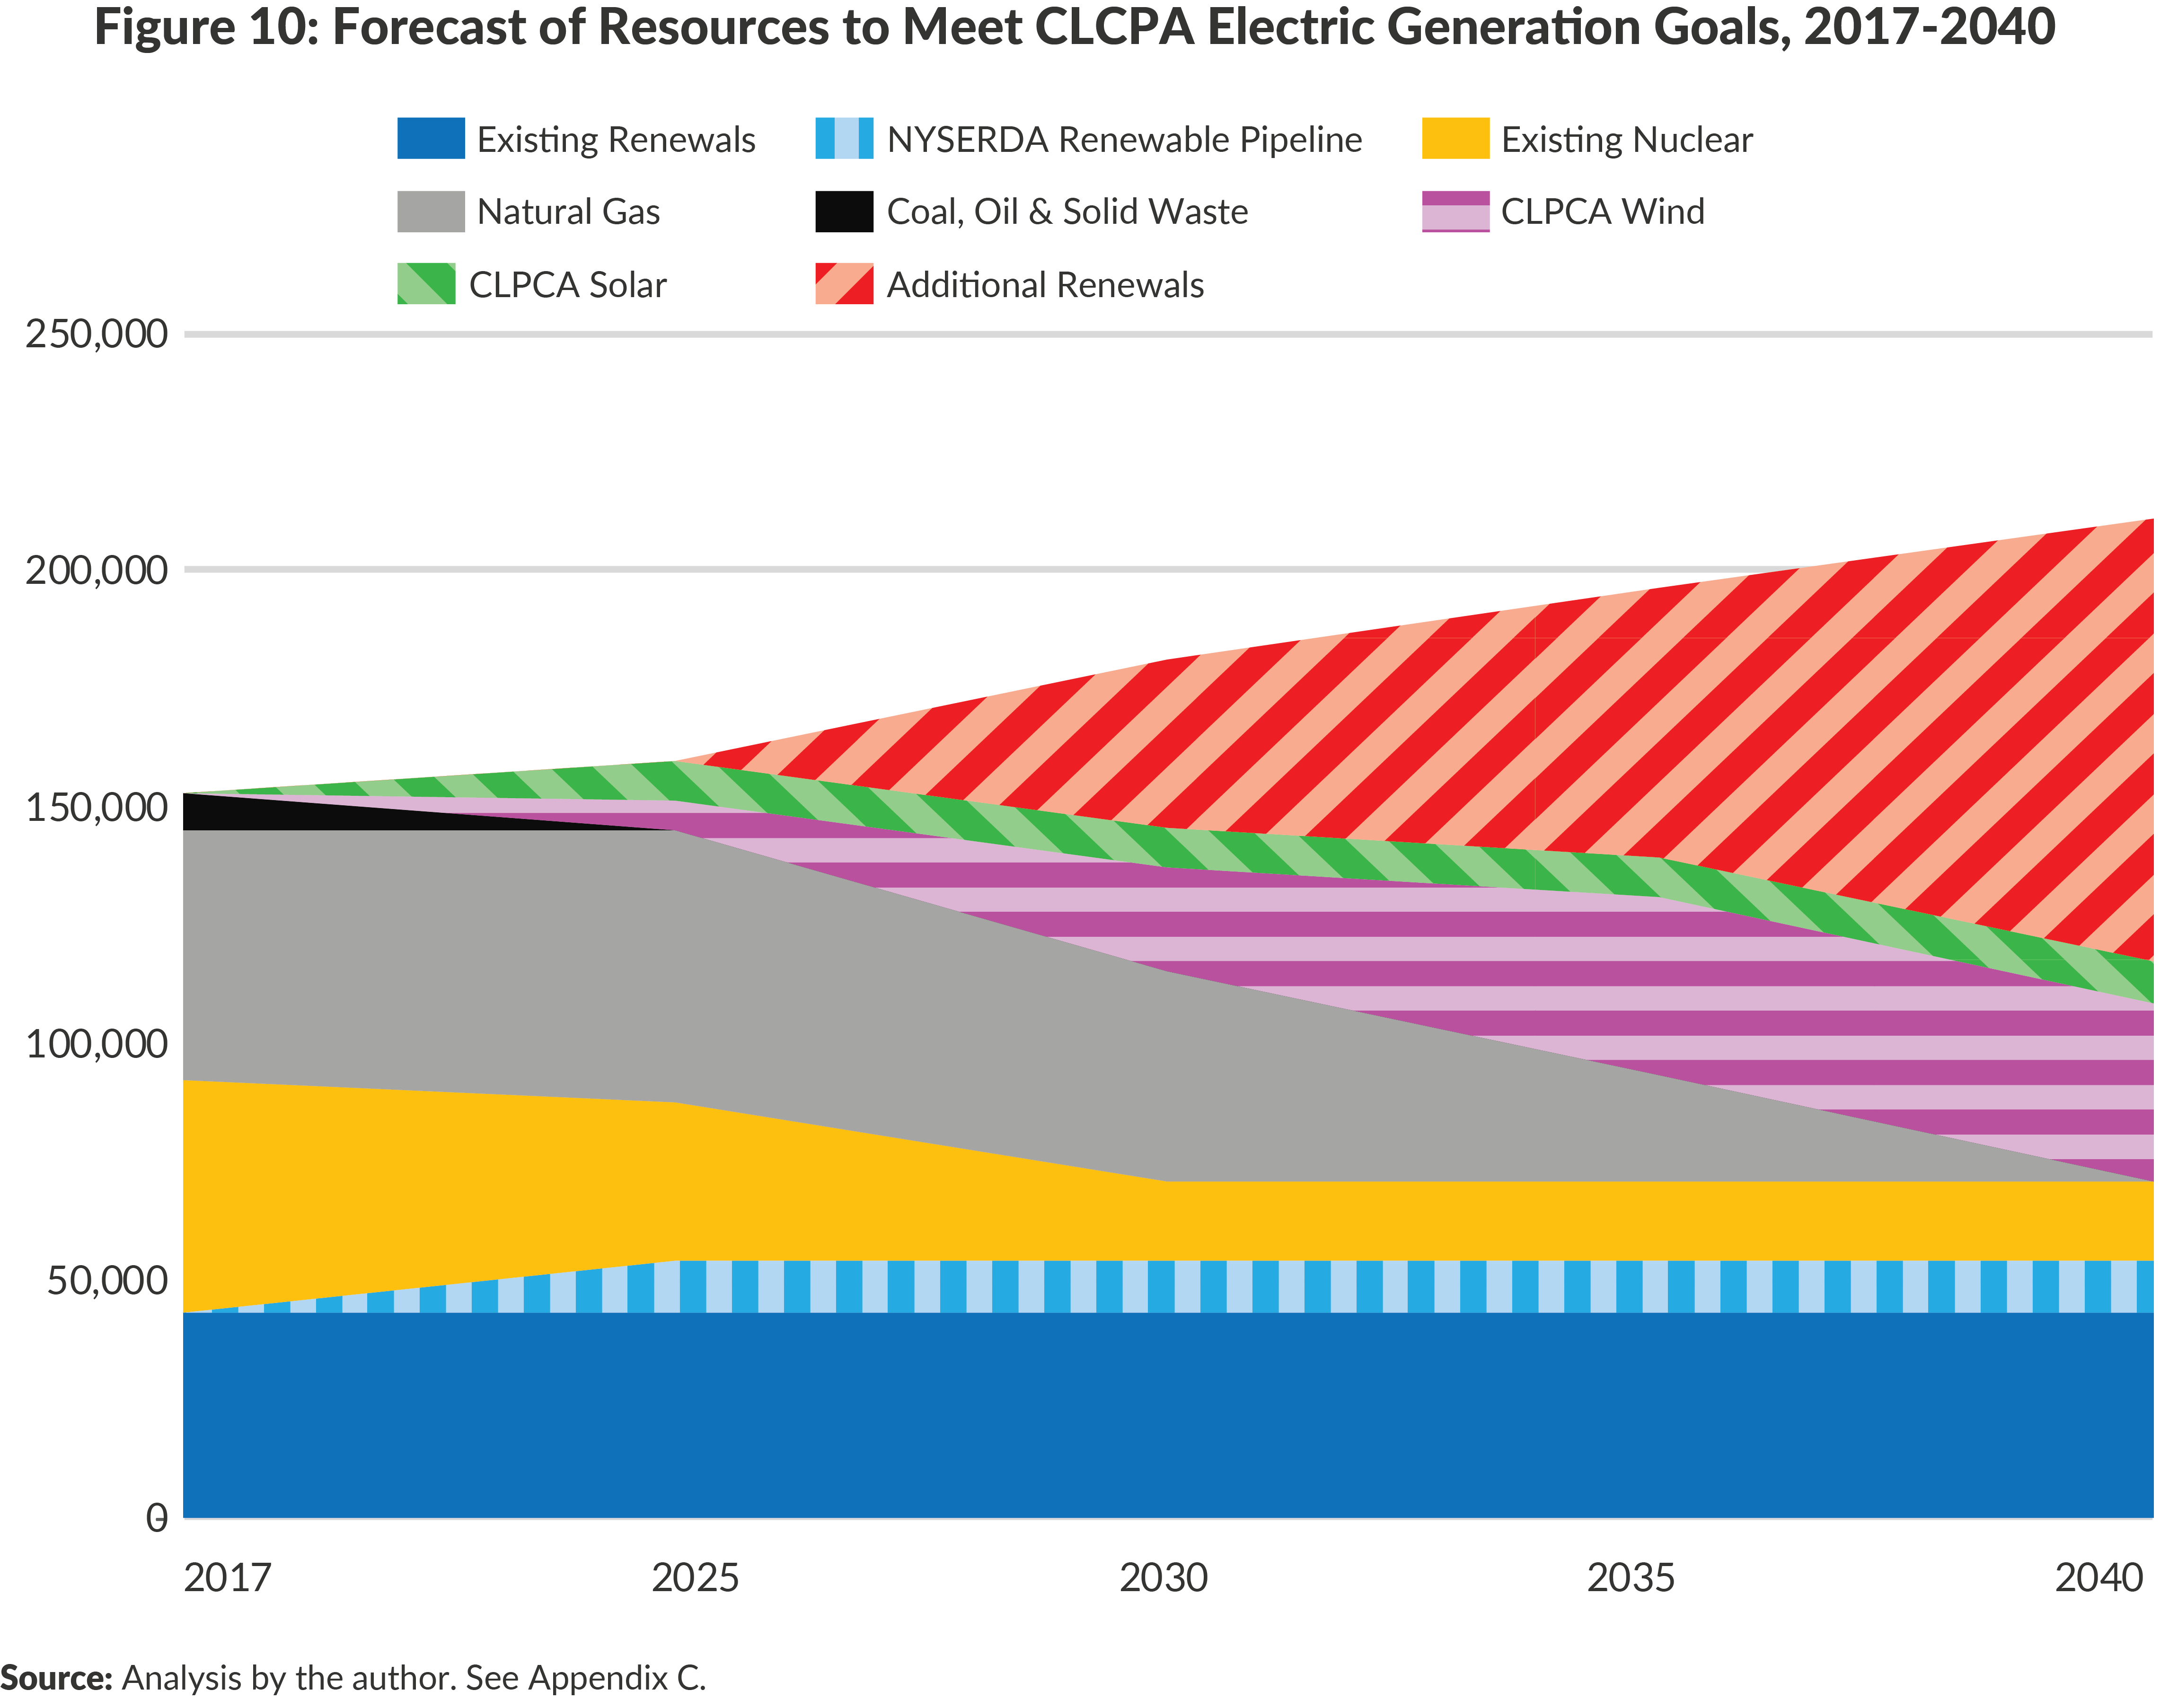
The twin goals of shifting from fossil fueled and nuclear-powered generation and electrifying heating and transportation in New York will transform the mix of generation and increase total electric consumption significantly. At this writing, neither the NYISO nor any New York State agency or authority has provided a long-range projection of what the result of these policies might be. In order to get a sense of whether the current program set out by the CLCPA will meet the goals, an analysis is provided in Appendix C to add up the total energy requirements on one side and the existing, planned and further resources needed on the other to determine how much renewable generation New York may need. The base year for analysis is 2017, the most recent year for which environmental attributes of generation are available through the New York Generation Attributes Tracking System (NYGATS).43
Employing the methodology described in Appendix C indicates that as New York moves to a path of decarbonizing heating and transportation in New York the total electric demand will rise to 211,100 Gwh by 2040. To serve that demand with 100 percent non-emitting resources, nearly 94,000 Gwh of additional renewables will need to be added, a total that is roughly double the amount to be added from offshore wind (37,800 Gwh) and distributed solar (8,400 Gwh) now set by the CLCPA. (See Figure 10.)
This analysis does not take into account the broader economic implications of a massive shift of resources; the response of consumers if electric prices rise; or the actions being taken in other states; however, it gives an order of magnitude to the implications of the CLCPA and indicates areas requiring further public discussion.
The consulting firm McKinsey and Company issued an article on New York’s decarbonization goals in July 2019.44 McKinsey has estimated that the electrification of sectors that now use fossil fuels will drive total electric consumption to 216,100 Gwh by 2040, which is comparable to the results obtained above. McKinsey notes that the transmission system will experience many changes in power flow and that some quick starting power generation will still be required, which could be fueled by natural gas that is manufactured through an electrolysis process, using excess electric power from renewable sources.
Additional Concerns About the Impact of Long-Term Electrification Using Renewable Sources
NYISO has begun to analyze the impacts on the operation of the electric grid and the markets that supply energy in New York and recently published a draft report outlining some of the challenges presented by meeting the goal of supplying 70 percent of electricity from intermittent renewable generation by 2030.[45] NYISO’s draft report was published before the CLCPA was passed and revisions are expected. The report notes ten areas of concern for reliability:
- Maintain Ability to Balance Demand and Supply
- Maintain 10-Minute Operating Reserves
- Maintain Total 30-Minute Operating Reserves
- Maintain Ability to Meet Daily Energy Requirements
- Maintain Reliable Transmission Operations
- Maintain Black Start Capability
- Maintain Voltage Support Capability
- Maintain Frequency Response Capability
- Maintain Resource Adequacy
- Ability to Manage Supply Resource Outage Schedules
The NYISO is working within its committee structure to begin to address these challenges. The NYISO working committees will be examining methods to establish price signals to promote resources and services that will provide the needed capabilities to support these reliability needs. At this writing, there is no estimate of the timeframe to develop these price signals or the impact on total electric costs.
RECOMMENDATIONS TO ACHIEVE GHG EMISSION REDUCTION GOALS
Reducing GHG emissions is an international concern. The wide differences in state energy profiles and their performances in reducing GHG emissions show that New York cannot go it alone if the United States is to achieve substantial GHG emissions reductions; however, in the absence of federal leadership states are setting their own goals and adopting their own approaches.
New York is already extremely green, with the lowest per capita rate of CO2 emissions among all states. Simply put, there is no quick fix or low-cost approach to further lower greenhouse gas emissions. New York has already transitioned away from coal-fired generation, a large proportion of transportation is already provided by an energy efficient network of mass transit systems, and the state has many homes that are part of multi-family dwellings that are relatively energy efficient.
The challenge for New York is to adopt efficient approaches to achieve the worthy long-term GHG reduction goals while limiting harm to the state’s economic competitiveness. With this in mind, New York should prioritize the most cost-effective options in terms of incremental carbon reduction per dollar spent. Doing so will require:
- Reducing GHG emissions of all sectors in the economy;
- Maintaining optionality with respect to fuels, sources, and technologies, with a portfolio approach that includes short and long-term contract commitments; and
- Partnering with other states and Canada to promote market solutions.
There are six main recommendations that result from this analysis and follow from the principles articulated above:
- Establish an economy-wide carbon pricing system to deliver effective price signals to energy consumers throughout the state;
- Retain the use of nuclear energy to continue to obtain the benefits of carbon avoidance;
- Look beyond the borders of New York State for low-cost, low-emissions energy supplies and for opportunities to cut global GHG emissions;
- Avoid self-imposed constraints such as limiting gas pipeline capacity;
- Promote broad transportation solutions that build on existing infrastructure; and
- Establish a prioritization system to pursue renewables that provide the greatest GHG reductions at lowest cost.
Analyzing Options for Carbon Reduction: The Social Cost of Carbon
To further the goal of GHG reductions and help New Yorkers evaluate different energy proposals, the PSC has put in place a consistent standard to recognize the benefits of avoiding GHG emissions. As part of a regulatory proceeding to potentially restructure the electric utility sector, the PSC issued an Order setting out a benefit-cost analysis framework.[46] The Order establishes a methodology for determining the benefits and costs of utility expenditures for changes in the ways that the electric distribution system will operate and in the competitive procurement of resources and energy efficiency programs. Net avoided greenhouse gases are among the benefits to be included when computing the Benefit-Cost scores.
In addition, the CLCPA tasks the DEC with estimating a “social cost of carbon,” which the PSC defines as: “an estimate of the monetized damages to global society associated with an incremental increase in carbon emissions in a given year. It is intended to include changes in net agricultural productivity, human health, property damages from increased flood risk, and the value of ecosystem services due to climate change, etc.”
Determining the social cost of carbon will be important for evaluating the tradeoffs between the costs of different energy proposals and projects and the benefits of incremental GHG emission reductions. The social cost of carbon will be incorporated into the benefit-cost scoring of futures projects and projects with higher costs but lower carbon impacts could be selected over other competitive projects.
4.1 Establish an Economy-Wide Carbon Pricing System
Price signals change purchase and sale behavior in the short-run and unleash innovation in the long-run. In the realm of carbon reduction, there are two approaches to pricing: (1) cap-and-trade systems and (2) carbon fees. Either approach will build the cost of carbon into the delivered price of energy and so energy costs will increase. Whichever system is adopted, it should be economy-wide, including the transportation sector, which represents 33 percent of New York’s GHG emissions, as well as heating and cooling usage in the commercial, industrial, and residential sectors, which account for over 30 percent of statewide GHG emissions. To be most effective, the pricing system should apply to as broad a market as possible covering all sectors and as many participants as possible. Both systems will be most effective if they are at least regional in scale and preferably done on a national basis.
In the absence of economy-wide carbon pricing, the DEC is calculating a social cost of carbon calculation as a proxy. (See Text Box.)
4.1.1 Cap-and-Trade System
The Regional Greenhouse Gas Initiative (RGGI) is an excellent example of an effective cap-and-trade system for cutting carbon emissions. RGGI began with a memorandum of understanding in 2005 among nine states in the Northeast and Mid-Atlantic and compliance began in 2009. There are eight founding members currently involved (Connecticut, Delaware, Massachusetts, Maine, New Hampshire, New York, Rhode Island, and Vermont). Maryland joined in 2007 while New Jersey withdrew in 2011. New Jersey will formally rejoin RGGI effective January 1, 2020.
The program establishes annual caps to the amount of carbon that may be emitted by the electric power sector within the RGGI region. Participation by states is voluntary and if a state withdraws or enters, then the total cap is adjusted proportionately. Each state sets limits on carbon emissions in the electric power sector and issues carbon allowances and a system for participation in regional auctions of carbon allowances.
As noted on the RGGI website, “[f]ollowing a comprehensive 2012 Program Review, the RGGI states implemented a new 2014 RGGI cap of 91 million short tons. The RGGI CO2 cap then declines 2.5 percent each year from 2015 to 2020”.47 Further, the RGGI 2016 Program Review has adopted a model rule to be adopted by the participating states to drive the “regional cap to 75,147,784 tons of CO2 in 2021 and then decline by 2.275 million tons of CO2 per year thereafter, resulting in a total 30% reduction in the regional cap from 2020 to 2030.48
Owners of power plants must obtain allowances proportional to the amount of power that they produce. They begin by purchasing carbon allowances that are made available through quarterly regional auctions. Power plant owners can then buy and sell these carbon allowances. In practice, the plants that can most cost-effectively cut emissions will do so and then have allowances to sell at auction. In this way, the market gets the most cost-effective emissions reduction and the plant making the cuts receives the highest payment available.
While RGGI has experienced growing pains, it has proved effective. Across the RGGI states, power sector CO2 emissions have fallen by over 46 percent from 2009 to 2016, compared to a decrease of only 19 percent for non-RGGI states.49
In 2015, New York received $167.7 million from RGGI auctions; these funds were mostly used by NYSERDA for energy efficiency programs.Other RGGI states have used the proceeds from auctions of allowances to support energy efficiency programs, the development of renewable energy projects, consumer bill assistance and job training programs in energy related fields. A recent study by the Analysis Group has concluded that during the nine-year period from 2009 to 2018 that the costs incurred by the RGGI states have produced positive economic results for the states.50 A review of the most recent three-year period shows a net present value for the nine states of $1.4 billion. RGGI only applies to the power sector and in 2015 electricity from in-state and imported sources accounted for 15.6 percent total MMTCO2e emissions for New York. While RGGI can continue to shrink the emissions from the power sector, the benefits of a cap-and-trade system should be expanded across the entire economy.
In the US, only California has adopted a broad market approach to cap-and-trade with a program that covers 85 percent of statewide GHG emissions. The California emissions trading system was initiated in 2012 and expanded economy-wide in 2015. The European Union also has a cap-and-trade program that goes beyond the electric power sector, currently covering 45 percent of GHG emissions.
A cap-and-trade system can be particularly suited to the multi-family housing stock when it includes public housing. As an example, a portion of public housing is in desperate need of energy efficiency upgrades, from new windows and insulation to new boilers, but many public housing systems lack the capital to make these improvements. A cap-and-trade system would enable public housing to finance improvements through the sale of emissions credits created by improved energy efficiency.
Extending the cap-and-trade system from the electric sector to the full economy is not a simple task, but the experience in California provides a roadmap for policy makers. The California Air Resources Board (CARB) administers the California program and began with the electric power generation sector in 2013 and then extended to distributors of transportation, natural gas, and other fuels in 2015. CARB is now promoting a number of programs targeted at transportation including a Low Carbon Fuel Standard, and the promotion of Advanced Clean Car technologies.
New York should also explore frameworks for tracking carbon reductions that might count towards a future cap-and-trade program. While there is no national carbon cap-and-trade system in place, many states and members of Congress are actively discussing national programs. New York should recognize and properly credit early action if a national program is subsequently adopted.
4.1.2 Carbon Fee
A carbon fee puts an explicit price on the carbon in a fuel. In order for it to be most effective, the fee is applied to all fuels so that it impacts all industries and at a rate high enough to impact behavior. Several countries and one Canadian province already have put carbon fees in place or are in the process of implementing them, including Argentina, Finland, Portugal, Mexico, Norway, Sweden and British Columbia in Canada.51 Some countries have not yet had enough experience, have set the rate too low, or have exempted too large a share of the economy to make a meaningful difference.
The experience of British Columbia, however, shows that an economy-wide fee with few exemptions can be effective. As noted by researchers from Duke University and the University of Ottawa, “[e]mpirical and simulation models suggest that the tax has reduced emissions in the province by between 5% and 15% since being implemented. At the same time, models show that the tax has had negligible effects on the aggregate economy, despite some evidence that certain emissions-intensive sectors face challenges."52
At this time, no states in the US have implemented a carbon fee. In November 2018, voters in the State of Washington rejected a ballot initiative for a carbon tax. At the federal level, carbon tax legislation has been proposed, but has not gotten beyond the discussion stage. Though imposing any new tax or fee is politically challenging, a carbon fee has the benefits of fairness and clarity and the ability to easily work on an economy-wide basis.
In the fall of 2016, the PSC and NYISO began examining the impact of a carbon fee within wholesale electricity markets and created the Integrating Public Policy Task Force (IPPTF), which has issued a series of reports and straw proposals on the topic. The IPPTF proposal would levy a carbon fee on electricity entering the wholesale distribution market based on relative carbon emissions, offset by any already applicable RGGI taxes.53 The proposed fee would only apply to electricity consumption. The proposal has been submitted to the NYISO Market Issues Working Group (MIWG) as the next step in the NYISO governance process and the MIWG is continuing to review the concept and develop a proposal, but no recommendation has yet been made to the Business Issues Committee. This process still has several steps before a carbon fee could be implemented by the NYISO.
4.1.3 Return of Tax Revenue to Consumers
While the objective of these programs is to increase the cost of carbon intensive fuels and discourage their use, a side effect of cap-and-trade systems and carbon fees is the creation of additional revenue. Any program that creates a carbon pricing system must also include clear mechanisms to return those funds to taxpayers in a manner consistent with the payments made. Put simply, the funds collected by state government in the administration of these programs should not go into the State’s General Fund. The experience with RGGI points to a way to use the funds to help consumers lower overall electric costs by using the proceeds to support energy efficiency programs available to all customers and to provide direct bill assistance. Each state that adopts a carbon fee or cap-and-trade program should aim to be revenue neutral and these funds should be returned to consumers through widely available energy programs, lower electric bills, or lower taxes.
4.2 Look Beyond the Borders of New York
As more states adopt climate change policies, there will be additional opportunities to work in coordination to seek the most efficient approaches to cutting GHG emissions. New York should encourage as many possible sellers to compete to provide renewable energy to the New York market in order to promote the greatest amount of competition to drive down prices.
New York should also work with other states to establish national carbon fee or cap-and-trade programs. Reversing the trend of increased emissions in Texas and Florida may provide greater benefits to New Yorkers than a small incremental decrease to New York’s own emissions and might be achieved at lower overall cost.
New York should explore the possibility of working in a buyers’ consortium with other states to purchase large-scale low and zero-GHG energy resources. At present, New York, New Jersey, Connecticut, Rhode Island and Massachusetts are all in the process of issuing solicitations and announcing winners for offshore wind energy projects. Rather than compete against each other, these states should identify opportunities to work together to bring the most cost-effective resources to the market.
Another area of focus should be to encourage additional imports of hydroelectric energy from Canada. New York State currently imports about 7,500 Gwh per year of hydropower from Canada. Hydro Quebec, a Canadian electric utility, has proposed building new transmission lines to New York to supplement the resources that New York already imports from Canada. Champlain Hudson Power Express, a private transmission development company, has completed all permitting requirements to bring 1,000 MW of power from the Canadian border to New York City.54 Depending on demand and operational considerations this would amount to approximately 8,000 Gwh per year. Previous contracts for Canadian hydropower have shown that the Canadian utilities are capable of providing power that is priced competitively for the New York and New England markets while allowing the seller to earn a favorable return. The PSC should review its finding and reconsider the advisability of additional hydro imports as a way for New York to meet the renewable energy goals.
Recently Mayor Bill DeBlasio announced that New York City will pursue a deal to purchase Canadian hydropower and have it delivered to the city through a new transmission line-this would be a positive addition to New York’s resource mix.55
4.3 Retain the Use of Nuclear Energy to Continue to Obtain the Benefits of Carbon Avoidance
Nuclear power should be retained so that the state does not lose ground in its emissions reductions. While the Indian Point facilities are scheduled to shut down in 2020 and 2021, the operation of the remaining nuclear plants seems assured only as long as the ZECs are in place and they are now scheduled to expire in 2029. The implementation of a properly priced carbon fee would be a benefit to the nuclear plants and might reduce or eliminate the need for a continuation of the ZEC program. In addition, in order to continue to reap the benefits of this zero GHG emission resource, the State should explore with the U.S. Nuclear Regulatory Commission whether further extensions of operating licenses are feasible.
4.4 Avoid Self-Imposed Constraints such as Limiting Gas Pipeline Capacity
Opposition to imported fossil fuels has resulted in constraints on expansion of natural gas. By refusing to grant water permits to several natural gas pipelines, the NYS DEC is constraining the energy markets severely.
As discussed, the opposition to natural gas pipelines has led to a moratorium on new gas connections in the service territories of Consolidated Edison and National Grid’s downstate affiliates in Brooklyn and Long Island. There is the potential for further moratoria across the state and then New York will not be able to reap the GHG reduction benefits of converting home heating from oil to natural gas. There is also the risk of constraining the operation of gas-fired power plants necessary to provide a stable and reliable electric supply. Likewise, a lack of stable natural gas supply for new businesses may harm the state’s economic competitiveness.
Regulatory action is making a technology choice rather than allowing resources to compete based on the cost of carbon; as much as possible, New York should create a competitive market of options to reduce greenhouse gases.
4.5 Promote Broad Transportation Alternatives to Reduce GHG Emissions
New York has made a large commitment to electric vehicles and “is striving to be ready to accommodate more than 30,000 plug-in electric vehicles by 2018 and 1 million by 2025 through Charge NY.”56 The sales rate will need to ramp up to about 140,000 vehicles per year and NYSERDA is currently offering rebates up to $2,000 per vehicle. New York is also subsidizing the construction of charging stations throughout the state. There are social equity issues associated with subsidizing the sale of vehicles costing $30,000 and more. In addition, car ownership rates are very low for a large portion of the state’s population, so this is not a benefit of value to many residents.
Furthermore, this is an expensive GHG emissions reduction strategy. If the state is successful in getting 1 million electric vehicles on the road by 2025, there would be a net savings in GHG emissions of approximately 2.8 MMTCO2e.57 It is unclear how much longer the New York vehicle rebate program will run, but if it covered the entire 1 million cars and those cars had a useful life of ten years, then New York would spend $2 billion to avoid 28 MMTCO2e, or approximately $71/Ton of CO2e, approximately 40% above the social cost of carbon currently being employed in analysis of energy projects in New York.
Though there are GHG benefits from the conversion of cars and trucks from fossil fuel to electric power, the state is not putting enough emphasis on one of the key areas that has made New York a low GHG emission state– energy efficient public transportation. In the downstate region, bus and subway ridership is down and traffic congestion is up. While there are many reasons for this, there is a consensus building that poor service on the public transportation network is sending more people to ride hailing services.58 Though a hybrid or electric vehicle produces less greenhouse gases than a gasoline powered vehicle, public transportation emits even less per passenger mile traveled. A recent positive step was the adoption of congestion pricing in the New York City Central Business District, which is expected to reduce personal vehicle use in Manhattan and spur additional use of public transit. Governor Cuomo announced in January 2018 that the Metropolitan Transportation Authority would begin piloting an all-electric bus program as a means of further driving down GHG emissions.59
New York is also participating in the regional Transportation and Climate Initiative, which is “a regional collaboration of 12 Northeast and Mid-Atlantic states and the District of Columbia that seeks to improve transportation, develop the clean energy economy and reduce carbon emissions from the transportation sector.”60 The TCI focuses a great deal of its effort on clean vehicles and fuels and ways, freight efficiency and exploring regional policy issues. Public transportation is included in that, but is not a core focus.
4.6 Prioritize Renewable Projects with Lowest Cost of GHG Reductions
Renewables are and should continue to be part of the state’s energy portfolio; however, policymakers should allow price signals to determine how much wind capacity, distributed solar, utility-scale solar, and hydroelectric power is built rather than mandating specific technologies. All these projects should be put on a common basis of cost to consumer for tons of GHG avoided and those with the lowest net cost should be prioritized for development and contracts.
Clear economic signals provide the best opportunity to find the most cost-effective solutions; this should not preclude short-term use of natural gas to meet emission targets. Proponents of renewable power have voiced concern over making commitments to natural gas pipelines that will lock in financial commitments for decades. There should be a similar concern that the rush to build offshore wind commits electric customers to pay for expensive power contracts for the next two decades.
A balanced portfolio of resources and contract terms will provide New York with the greatest security and stability to reach its long-term GHG reductions goals. Project developers may prefer that all contracts are for twenty-years or greater, but some portion of projects should be for shorter duration. This will allow for competition from new resources five or ten years down the road so that if newer projects can be done at lower cost, New York will reap the benefit. It also allows for the possibility that leaps in technology will be able to fill the mix rather than being locked into old technology for twenty years.
CONCLUSION
New York can continue to provide climate leadership to the nation; the continued focus on getting greener through further emissions reductions is necessary and important. The challenge now is to find the most efficient approaches to secure the greatest amount of carbon reduction per dollar spent. Strong price signals, market incentives, partnerships with other states and Canada, and maintaining flexibility are the best approaches.
Appendix A: 2016 New York State Energy FLow (TBtu)
Download Appendix A Flowchart
Appendix A: 2016 New York State Energy Flow (TBtu)Appendix B: Capacity Factor and the Resources Needed to Meet 2030 Goals
The table below presents the incremental generating capacity that would be needed if only one technology was selected to supply the entire 55,600 Gwh to meet the 2030 incremental statewide target and at least 87,800 Gwh to meet the 2040 incremental statewide targets.
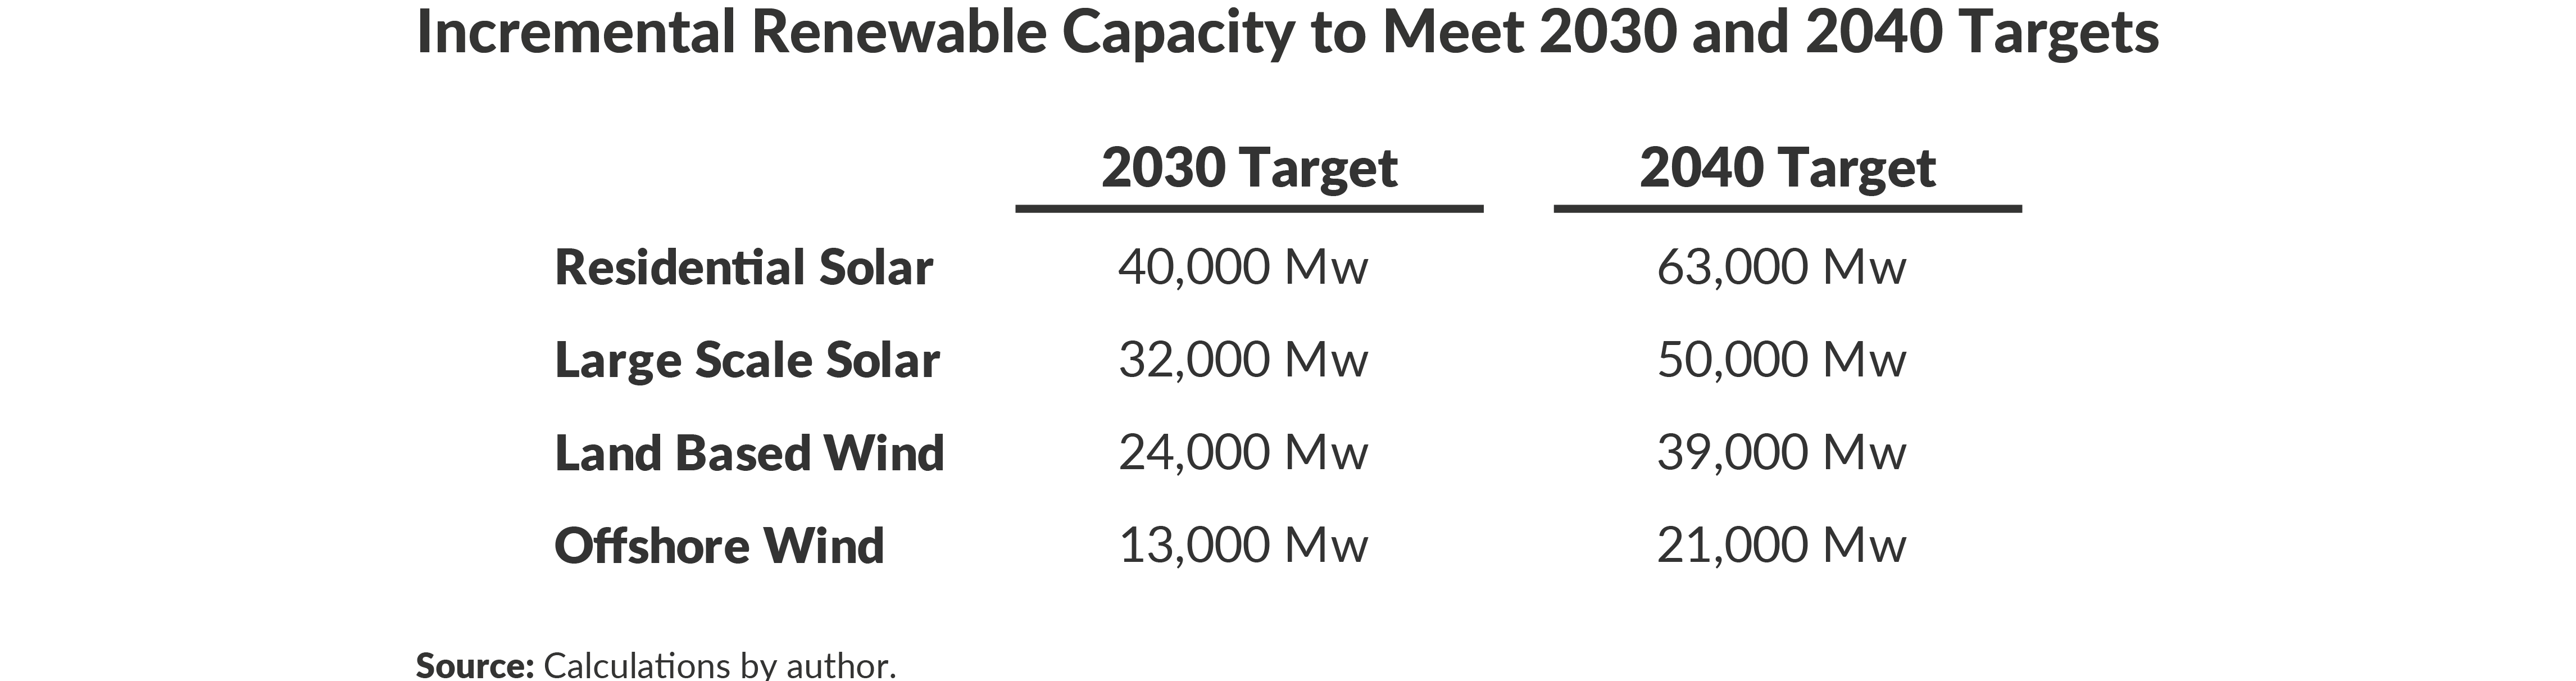
Conventional power plants (natural gas, coal, oil, and nuclear) are available to operate 85 to 95 percent of the hours of the year and if selected by the electric grid system operator, can have capacity factors in the range of 85 percent to 95 percent. Thus, a 1,000 Mw natural gas plant with a 90 percent capacity factor would produce approximately 7,800 Gwh per year (1,000 Mw * 24 hours/day * 365 days/year * 0.9 = 7,800 Gwh). While capacity factors for technologies are often location specific, for the purposes of discussion, this analysis will use median figures from the National Renewable Energy Laboratory for different technologies except as noted.61
| Residential/Distributed Solar | 16 percent |
| Utility Scale Solar | 20 percent |
| Land based Wind | 26 percent62 |
| Offshore Wind | 48 percent |
Using these capacity factors, 1,000 Mw of each technology would be expected to have annual energy production of:
| Residential/Distributed Solar | 1,400 Gwh/Gw |
| Utility Scale Solar | 1,752 Gwh/Gw |
| Land based Wind | 2,278 Gwh/Gw |
| Offshore Wind | 4,205 Gwh/Gw |
If only one technology was selected to supply the entire 55,600 Gwh to meet the 2030 incremental statewide target it would mean installing either:
| Residential/Distributed Solar | 40,000 Mw |
| Utility Scale Solar | 32,000 Mw |
| Land based Wind | 24,000 Mw |
| Offshore Wind | 13,000 Mw |
or some combination of the above.
The CLCPA also sets the following procurement goals:
- 9,000 Mw of offshore wind by 2035
- 6,000 Mw of distributed solar generation by 2025
- 3,000 Mw of statewide energy storage capacity by 2030
Energy storage time-shifts consumption but does not represent any additional renewable energy. Using the above energy production rates for the wind and solar yields:
| Offshore Wind | 9 Gw x 4,205 Gwh/Gw/yr = | 37,800 Gwh |
| Ditributed Solar | 6 Gw x 1,400 Gwh/GW/yr = | 8,400 Gwh |
| TOTAL | 46,200 Gwh |
Appendix C: Meeting Future Renewable Energy Requirements
Annual Energy Load Estimate
NYSERDA, the PSC and the NYISO are all using a forecast of 141,000 Gwh of total energy consumption for 2030 and the load in 2017 was 153,163 Gwh. In the absence of detailed projections from NYSERDA or NYISO, a straight-line assumption of a drop of 936 Gwh per year is employed.
A similar approach is used to estimate the annual impact on load as electrification of transportation and heating take effect between 2021 and 2050. As noted in text, the impact of long-term electrification is conservatively estimated at 90,000 additional Gwh. This results in an additional 3,000 Gwh per year.
Using these two factors, the net load in reference years is:
| Year | 2017 | 2025 | 2030 | 2035 | 2040 |
|---|---|---|---|---|---|
| Load | 153,163 | 159,742 | 181,100 | 196,100 | 211,100 |
Existing Resources
Renewable Resources
The NYGATS report indicates that there was a total of 43,083 Gwh of renewable energy delivered through the New York grid in 2017, with most of this energy derived from in-state and imported hydro with small additions of wind and solar energy as well. For the purposes of this analysis, it is assumed that all of these renewable resources will continue to be available through 2040.
Nuclear Resources
The NYGATS report indicates that there was a total of 49,062 Gwh of nuclear energy delivered through the New York grid in 2017 with 6,887 Gwh of that energy being imported. As noted in Section 3.3.1 above, nuclear power plants in New York are expected to be shut down as they reach the end of their operating licenses, with the first unit shutting down in 2020 and the last in 2045. For the purposes of this analysis, it is assumed that the nuclear plants have sufficient economic incentive to continue to operate, either through the extension of the ZEC program or because the market is making it attractive to operate. The imported energy is assumed to continue to be available through 2040.
Natural Gas
In 2017, natural gas produced in New York and from imports provided 52,278 Gwh of energy. The analysis assumes that natural gas provides sufficient energy to meet load in 2025 and 2030 and then ramps down to zero by 2040 when the CLCPA requires that all generation be provided by non-GHG emitting resources.
Coal, Oil and Solid Waste
In 2017, there was 8,289 Gwh of electric energy from coal, oil and solid waste, which was 0.005% of total energy supply in that year. For the purposes of this analysis, that total is assumed to go to zero by 2025.
New Resources
NYSERDA Renewable Pipeline
NYSERDA is tracking a renewable pipeline of projects in development from wind, solar and other qualifying renewable resources.63 The pipeline contains a mix of resources expected to come into service between 2020 and 2025 and supply a total of 10,884 Gwh. NYSERDA provides no estimate of the likelihood of all projects coming into service so for the purposes of this analysis it is assumed that all projects succeed and are on schedule.
CLCPA Solar
The CLCPA mandates that 6,000 Mw of new distributed solar be in place by 2025. For purposes of this analysis, it is assumed that from 2020 to 2025 1,000 Mw of new distributed solar is installed. Each 1,000 Mw of distributed solar is estimated to generate 1,400 Gwh of energy annually, so at the end of the buildout period in 2025 the 6,000 Mw is producing 8,400 Gwh of energy.
CLCPA Wind
The CLCPA mandates that 9,000 Mw of new offshore wind be in place by 2035. For purposes of this analysis, it is assumed that from 2024 to2035 750 Mw of new offshore wind is installed. Each 1,000 Mw of offshore wind is estimated to generate 4,200 Gwh of energy annually, so at the end of the buildout period in 2035 the 9,000 Mw is producing 37,800 Gwh of energy.
Additional Renewable Energy
Additional renewable resources are required by 2030 to meet the 70 percent renewable energy target set by the CLCPA and then further resources are required to meet the goal of 100 percent non-emitting resources by 2040. The analysis adds further renewable resources to meet these legislative requirements.
Analysis Results
Employing the methodology described above results in the mix of existing and new resources presented in the table below. As New York moves to a path of decarbonizing the heating and transportation loads in New York and serves those needs with 100 percent non-emitting resources, the analysis indicates that nearly 94,000 Gwh of renewables will need to be added by 2040, a total that is roughly double the requirements now set by the CLCPA.
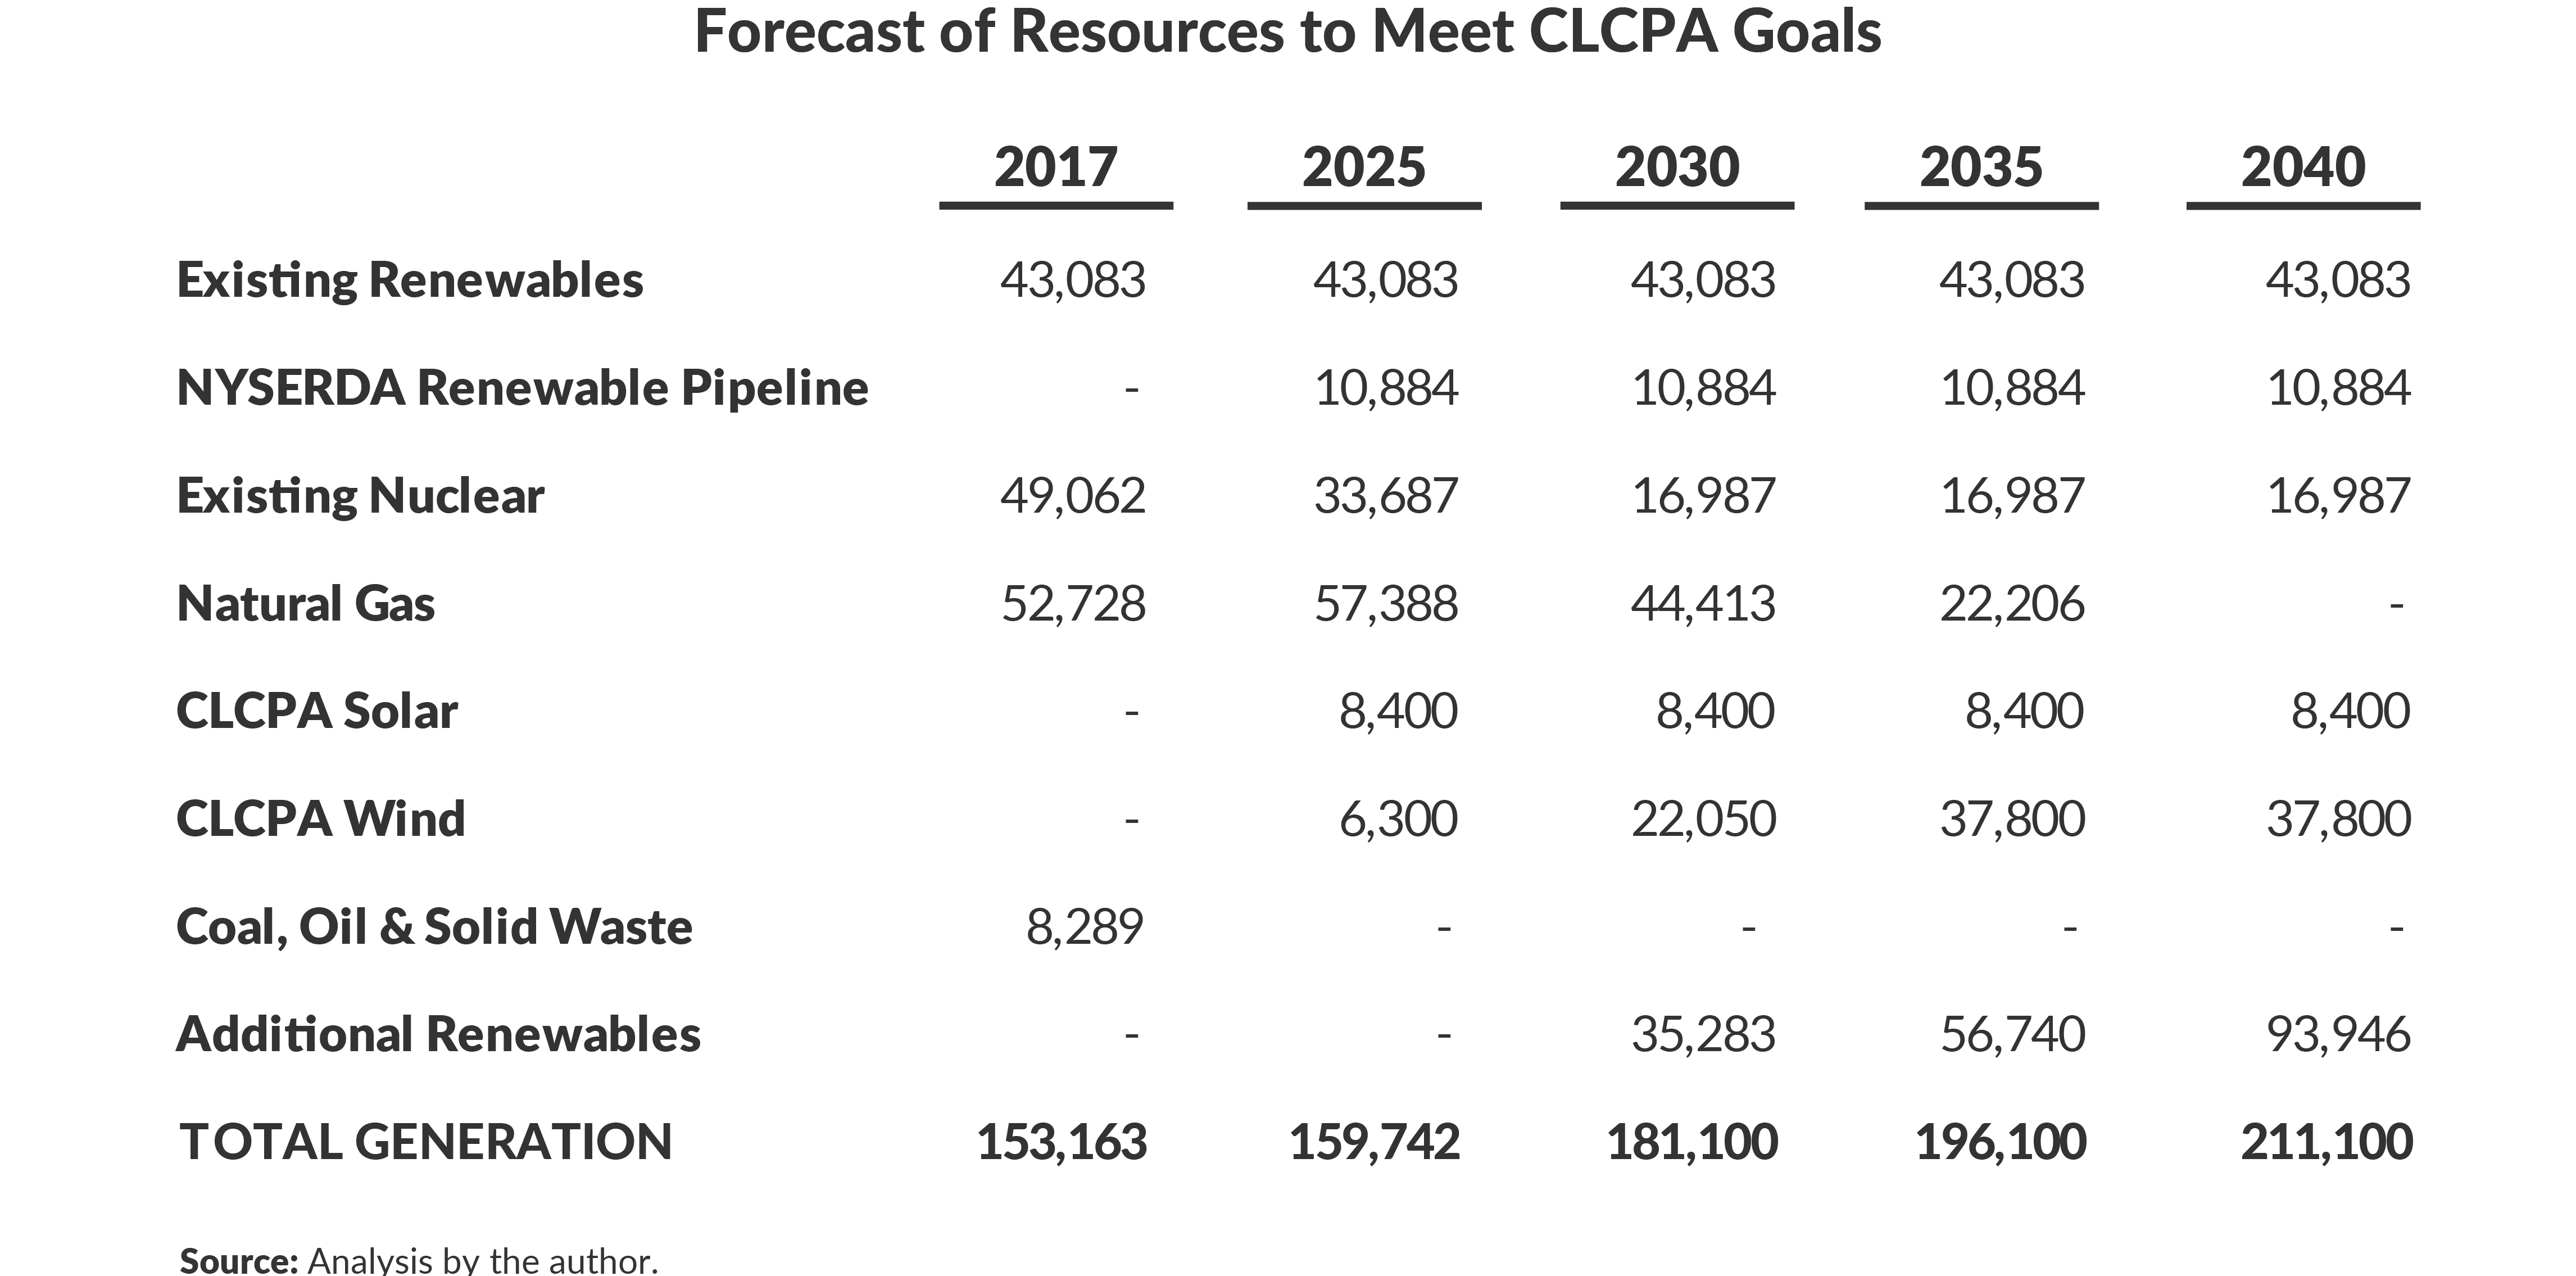
Footnotes
- New York State Energy Planning Board. “The Energy to Lead”, New York State Gov 2015, updated 2017, Sept. 13 2019, https://energyplan.ny.gov/Plans/2015
- Climate Leadership and Community Protection Act. A08429. New York: nyassembly.gov, 2019. Web. Sept. 13 2019.
- When the U.S. Congress established the Corporate Average Fuel Standards in 1975, they established total mileage goals but left the details of how to accomplish those goals to the auto industry. Congress did not specify weight reductions, allowable numbers of cylinders, fuel formulations or any of dozens of other technical approaches that were tested over the coming years. From 1980 to 2016, new passenger cars sold in the United States have gone from 24.3 miles per gallon to 37.7 miles per gallon, an improvement of over 50 percent.
- While the state has significant influence over energy policy, elements of energy policy and implementation are also under the purview of the Federal Energy Regulatory Commission (FERC); New York Independent System Operator (NYISO) which is regulated by FERC; US Department of Energy (USDOE); US Environmental Protection Agency (USEPA); US Nuclear Regulatory Commission (USNRC); and municipalities through zoning and energy efficiency policies.
- Article 7 applies to any project greater than either 10 miles in length and at least 100 kilovolts (Kv) or 1 mile in length and voltages at or above 125 Kv.
- New York State Department of Public Service, “Article 10 Law.” New York State Gov, Board on Electric Generation Siting and the Environment, 2011, September 1 2019, http://www3.dps.ny.gov/W/PSCWeb.nsf/All/D12E078BF7A746FF85257A70004EF402; New York State Department of Public Service, “Article VII Major Electric and Gas Transmission Facilities.” New York State Gov, Public Service Commission, updated August 6, 2019, September 4, 2019, http://www3.dps.ny.gov/W/PSCWeb.nsf/All/A021E67E05B99EAD85257687006F393B.
- New York State Energy Research and Development Authority (NYSERDA) “History of NYSERDA,” New York State Gov, 2019, Sept. 13 2019, https://www.nyserda.ny.gov/About/History-of-NYSERDA.
- NYSERDA, “Funding,” New York State Gov, 2019, Sept. 13 2019, https://www.nyserda.ny.gov/About/Funding.
- A Btu is the amount of energy required to raise the temperature of one pound of water by one-degree Fahrenheit. For comparison purposes, the US Energy Information Agency notes that 1 cubic foot of natural gas is equivalent to 1,034 Btu; 1 gallon of gasoline is equal to 120,429 Btu; and 1 short ton of coal is equal to 19.3 million Btu.
- US Environmental Protection Agency, “Climate Change Indicators: Greenhouse Gases.” EPA, Feb. 22 2017, Sept. 13 2019, https://www.epa.gov/climate-indicators/greenhouse-gases; “EPA Fast Facts from the Inventory of U.S. Greenhouse Gas Emissions and Sinks: 1990-2015” EPA, April 2017. Sept. 13 2019, https://www.epa.gov/sites/production/files/2018-02/documents/fastfacts_20170817-508_0.pdf.
- World Nuclear Association, “Comparison of Lifecycle Greenhouse Gas Emissions of Various Electricity Generation Sources”, World Nuclear Association, July 2011, accessed Sept. 13 2019, www.world-nuclear.org/uploadedFiles/org/WNA/Publications/Working_Group_Reports/comparison_of_lifecycle.pdf.
- These plants burn fuel more efficiently because of the ability to use the heat in both the generating turbine (a modified jet engine) and a heat recovery steam generator, pushing the efficiency of fuel combustion up from 30 percent in conventional steam boilers towards 50 percent today– and forecasted to increase to 60 percent in a few years.
- Weather normalization is performed by calculating what the annual energy sales would have been if the weather had been “normal”, so hot summers see energy adjustments downward and cool summers will have energy adjustments upwards. The NYISO uses these calculations for long range planning so as to not be lulled into complacency by a few cool summers or overreact following a string of hot summers.
- US Bureau of Economic Analysis, “GDP and Personal Income Interactive Data”, BEA, 2019, Sept. 13 2019, https://apps.bea.gov/iTable/index_regional.cfm.
- US Energy Information Administration (EIA), “Rankings: Total Energy Consumed per Capita, 2017”, EIA, 2017, Sept. 13 2019, https://www.eia.gov/state/rankings/?sid=NY#series/12. Rhode Island’s energy efficiency is driven by its population density, compact size with short travel distances, and an economy that is primarily focused on the service industry.
- US EIA, New York: State Energy Profile Analysis, EIA, Aug. 15 2019, Sept. 13 2019, https://www.eia.gov/state/analysis.php?sid=NY.
- US EIA. New York: State Energy Profile Analysis. Note that the EIA provides this data on CO2 and not on CO2e, which limits direct comparisons between this and the preceding table.
- US EIA, State Electricity Profiles, EIA Jan. 8 2019, Sept. 13 2019, https://www.eia.gov/electricity/state.
- New York Independent System Operator (NYISO), Power Trends: New York’s Evolving Electric Grid, NYISO, 2017, p. 8.
- NYISO, Presentation to Market Issues Working Group, February 20, 2019.
- The State Energy Plan incorporates market reforms contemplated under the Reforming the Energy Vision (REV) program, first announced in April 2014 as a DPS staff report. That announcement initiated more than a dozen distinct regulatory proceedings with over forty separate initiatives in seven separate categories: Renewable Energy, Building and Energy Efficiency, Clean Energy Financing, Sustainable and Resilient Communities, Energy Infrastructure Modernization, Innovation and R&D, and Transportation.
- The wording of the CLCPA sets a renewable energy goal for 2030 but shifts to a 100 percent greenhouse gas reduction goal for 2040. At present the largest electric generation resource in New York that doesn’t emit greenhouse gases is nuclear power.
- New York State Department of Environmental Conservation, “High-Volume Hydraulic Fracturing in NYS,” New York State Gov, June 29 2015, Sept, 13 2019, http://www.dec.ny.gov/energy/75370.html. New York State Department of Environmental Conservation, 3-3399-00071/00001 – Valley Lateral Project Notice Decision, August 30, 2017; New York State Department of Environmental Conservation, Constitutional Pipeline Company, Joint Application: DEC Permit# 0-9999-00181/00024 Water Quality Certification/Notice of Denial, April 22, 2016; National Fuels Corporation Joint Application: NYSDEC Permit Nos.: 9-9909-00123/00004 (Water Quality Certification) 9-9909-00123/00001 (Article 24 - Freshwater Wetlands) 9-9909-00123/00002 (Article 15 - Protection of Waters), April 7, 2017; and New York State Department of Environmental Conservation, Notice of Denial/Notice of Incomplete Application Transcontinental Gas Pipe Line Company, LLC Northeast Supply Enhancement Project Joint Application DEC ID: 2-9902-00109/00001 - Water Quality Certification DEC ID: 2-9902-00109/00002 - Endangered/Threatened Species (Incidental Take) DEC ID: 2-9902-00109/00003 - Excavation & Fill in Navigable Waters, April 20, 2018.
- To put this in context, the largest share of renewable energy in 2018 was 23,800 Gwh provided by NYPA hydro power plants followed by land-based in-state wind plants adding another 4,000 Gwh. See: NYISO, 2019 Load and Capacity Data Gold Book
- NYSERDA, Clean Energy Standard Annual Progress Report: 2017 Compliance Year, Feb. 2019.
- Howe, C., Breaking Down the Barriers to Siting Renewable Energy in New York State, New York League of Conservation Voters Education Fund, March 2019.
- Offshore energy projects are also subject to a federal jurisdiction with the landing point of transmission subject to certain local oversight. The Bureau of Offshore Energy Management (BOEM) conducts a detailed public process which evaluates the public interest and environmental impact of any proposed project.
- Bureau of Ocean Energy Management, New York Lease of Outer Continental Shelf Lands Act-A-0512, BOEM, 2018, Sept. 13 2019, https://www.boem.gov/Lease-OCS-A-0512/.
- NYSERDA, 2018 Solicitation Results, https://www.nyserda.ny.gov/All-Programs/Programs/Offshore-Wind/Offshore-Wind-Solicitations/Generators-and-Developers/2018-Solicitation.
- The 185 TBtu site energy savings goal is a shift from the 600 TBtu primary energy savings goal previously announced as part of the State Energy Plan. Site energy consumption measures actual energy consumed at the site while primary energy consumption includes energy used in production, delivery and losses. Site energy is a more tangible measure and better suited to explaining programs to stakeholders.
- Conversation between NYSERDA staff and Seth Hulkower.
- In 2015, natural gas provided approximately 57,000 Gwh of energy and accounted for 25.8 MMTCO2e. Thus, a GHG production rate of 0.00045 MMTCO2e/Gwh. Source: NYSERDA 2018 Greenhouse Gas Inventory, pp. 16-18.
- “Baseload” refers to power plants that plants that run nearly continuously throughout the year. These are generally the plants with the lowest variable operating costs and supply the least expensive power on the grid.
- Whitehead, Daniel, “Notice of Denial of Water Quality Certification,” Division of Environmental Permits, New York State Department of Environmental Conservation, https://www.dec.ny.gov/docs/administration_pdf/nodtgp.pdf
- Acevedo, Enver, Case 17-G-0606, Request for Approval of Non-Pipeline Solutions Portfolio in the Smart Solutions for Natural Gas Customers Program. Consolidated Edison Company, Sept. 28 2018, New York.
- New York State Public Service Commission, Case 17-G-0606, Order Approving with Modification the Non-Pipeline Solution Portfolio, Feb. 7, 2019, New York.
- New York Public Service Commission, Case 03-E-0188 – Proceeding on Motion of the Commission Regarding a Retail Renewable Portfolio Standard Jan. 1 2013.
- NYSERDA, New York State Greenhouse Gas Inventory: 1990-2015, Final Report (March 2018).
- Using a conversion rate of 115,000 Btu/gallon, this is equal to approximately 7 billion gallons of gasoline, and assuming a range of fleet efficiency between 15 and 25 miles per gallon for a mix of heavy and light duty vehicles means that New York vehicles travel between 105 and 140 billion miles per year. See: NYSERDA, The Energy to Lead, Biennial Report to the 2015 State Energy Plan, p. 8. The figure indicates 992 TBtu of total petroleum products, reduced by 178 TBtu of jet fuel with a resulting total of 814 TBtu; rounded to 800 TBtu for this analysis.
- The US Department of Energy currently uses an estimate of 0.35 kwh/mile. See: “eGallon Methodology.” Department of Energy, p. 2, Sept. 20 2019, https://www.energy.gov/sites/prod/files/2013/06/f1/eGallon-methodology-final.pdf.
- NYSERDA, New Efficiency: New York, Analysis of Residential Heat Pump Potential and Economics, Final Report: Report Number 18-44, January 2019, Table 4-3, New York.
- NYSERDA has estimated that a typical single-family home in the New York City or Hudson Valley region deploying a ducted air-source heat pump would use 6,429 kwh for heating in place of 90 mmBtu of natural gas. Source: NYSERDA email correspondence with the author.
- New York General Attribute Tracking System, https://nygats.ny.gov/ng/Report/getdto_view_Report_PublicSystemMix.
- Clune, R., Noffsinger, J., and Tai, H., “The Global Relevance of New York State’s Clean-Power Targets,” McKinsey and Company, Electric Power & Natural Gas Practice, July 2019.
- NYISO, Reliability and Market Considerations for a Grid in Transition, May 2019.
- New York Public Service Commission, Case 14-M-0101 – Proceeding on Motion of the Commission in Regard to Reforming the Energy Vision, Order Establishing the Benefit Cost Analysis Framework, Jan. 21, 2016.
- Regional Greenhouse Gas Initiative, Home Page <www.rggi.org>
- Regional Greenhouse Gas Initiative (RGGI), RGGI 2016 Program Review: Principles to Accompany Model Rule Amendments, Dec. 19, 2017, Sept. 20, 2019 https://www.rggi.org/sites/default/files/Uploads/Program-Review/12-19-2017/Principles_Accompanying_Model_Rule.pdf.
- Analysis of data from US EPA for Electric Power Sector, see: US EPA, State CO2 Emission from Fossil Fuel Combustion, Energy Resources for State and Local Governments, Sept. 20 2019 https://www.epa.gov/statelocalenergy/state-co2-emissions-fossil-fuel-combustion.
- Paul J. Hibbard, Susan F. Tierney, Pavel G. Darling, Sarah Cullinan, The Economic Impacts of the Regional Greenhouse Gas Initiative on Nine Northeast and Mid-Atlantic States: Review of RGGI’s Third Three-Year Compliance Period (2015-2017), RGGI, April 17, 2018, p. 4. Sept. 20 2019. https://www.analysisgroup.com/globalassets/uploadedfiles/content/insights/publishing/analysis_group_rggi_report_april_2018.pdf.
- World Bank, State and Trends of Carbon Pricing 2018, Washington DC, May 2018, p. 19.
- Murray, Brian C, and Nicholas Rivers. “British Columbia’s Revenue-Neutral Carbon Tax: A Review of the Latest ‘Grand Experiment’ in Environmental Policy.” Energy Policy, vol. 86, 2015, pp. 674–683., doi:10.1016/j.enpol.2015.08.011. https://www.researchgate.net/publication/283757444_British_Columbia's_revenueneutral_carbon_tax_A_review_of_the_latest_grand_experiment_in_environmental_policy.
- New York ISO, IPPTF Carbon Pricing Proposal; Prepared for the Integrating Public Policy Task Force Dec., 2018, Sept 22, 2019, https://www.nyiso.com/documents/20142/3911819/Carbon-Pricing-Proposal%20December%202018.pdf/72fe5180-ef24-f700-87e5-fb6f300fb82c.
- Transmission Developers Inc., “Champlain Hudson Power Express”, Sept. 22 2019, http://www.chpexpress.com/docs/CHPE_Fact_Sheet_2017.pdf.
- New York City, Transcript: Mayor de Blasio Announces New York City’s Green New Deal, April 22 2019 https://www1.nyc.gov/office-of-the-mayor/news/211-19/transcript-mayor-deblasio-new-york-city-s-green-new-deal.
- NYSERDA, “Electrical Vehicles,” NYSERDA, Sept. 22 2019, https://www.nyserda.ny.gov/Researchers-and-Policymakers/Electric-Vehicles.
- See: The US EPA estimates the typical passenger vehicle travels 11,500 miles per year and emits about 4.6 metric tons of CO2e per year. Therefore, 1 million typical passenger vehicles produce 4.6 MMTCO2e per year. If these cars are replaced with electric vehicles that consume 0.35 kwh for each mile traveled, then each car uses 4,025 kilowatt-hours per year. If the state is successful in getting 1 million electric vehicles on the road by 2025, those vehicles would use 4,025 Gwh. Since these electric cars would be essentially powered by natural gas burning plants, the conversion factor used in the nuclear power discussion above applies. See: US Department of Energy, “eGallon Methodology.”,p. 2, Sept. 20 2019, https://www.energy.gov/sites/prod/files/2013/06/f1/eGallon-methodology-final.pdf; US EPA, Office of Transportation and Air Quality, “Greenhouse Gas Emissions from a Typical Passenger Vehicle,” US EPA. , EPA-420-F-18-008, March 2018.
- Emma G. Fitzsimmons, “Subway Ridership Dropped Again in New York as Passengers Flee to Uber,” The New York Times, Aug. 1, 2018, Sept. 23, 2019 https://www.nytimes.com/2018/08/01/nyregion/subway-ridership-nyc-metro.html.
- Metropolitan Transportation Authority Press Release, Governor Cuomo Announces All-Electric Bus Pilot Program to Reduce Emissions and Modernize Public Transit Fleet, Jan. 8, 2018, http://www.mta.info/press-release/nyc-transit/governor-cuomo-announces-all-electric-bus-pilot-program-reduce-emissions.
- Transportation and Climate Initiative, https://www.transportationandclimate.org/content/about-us.
- NREL Annual Technology Baseline, https://atb.nrel.gov/electricity/2018/.
- NREL projections for land-based wind are based on new installations installed in states with strong wind regimes, such as Nebraska and Iowa. The wind resources in New York are not as steady or productive and the factor used here is based on the experience of existing wind turbines across the state as calculated by the New York ISO.
- NYSERDA, New York State Clean Energy Standard: Results of Renewable Energy Standard and Renewable Portfolio Standard Solicitations for Long-Term Contracts through December 31, 2018: Final Report March 2019, March 2019.