Housing Affordability Versus Location Affordability
The Rent's Too Damn High! But the Metrocard is a Pretty Good Deal
Introduction
How much more would you pay for an apartment just a short walk from your job than for an equivalent apartment that required an hour-long commute by car to work?
This question highlights two important points about the links between housing costs and transportation costs. First, transportation costs typically are a major component of household budgets, usually second only to housing. Second, a tradeoff between housing costs and transportation costs often exists, and taking both into account can provide a better measure of residential affordability in an area than only considering housing costs.
In recognition of these important points, the U.S. Department of Housing and Urban Development (HUD) has developed a Location Affordability Index (LAI) that measures an area’s affordability based on housing and transportation costs relative to income.1 This policy brief uses the HUD data to compare costs for a typical household in New York City to those in 21 other cities chosen because they are among the 15 largest by population or the central cities of the 15 largest metropolitan areas by population.
The data indicate that for a typical household:
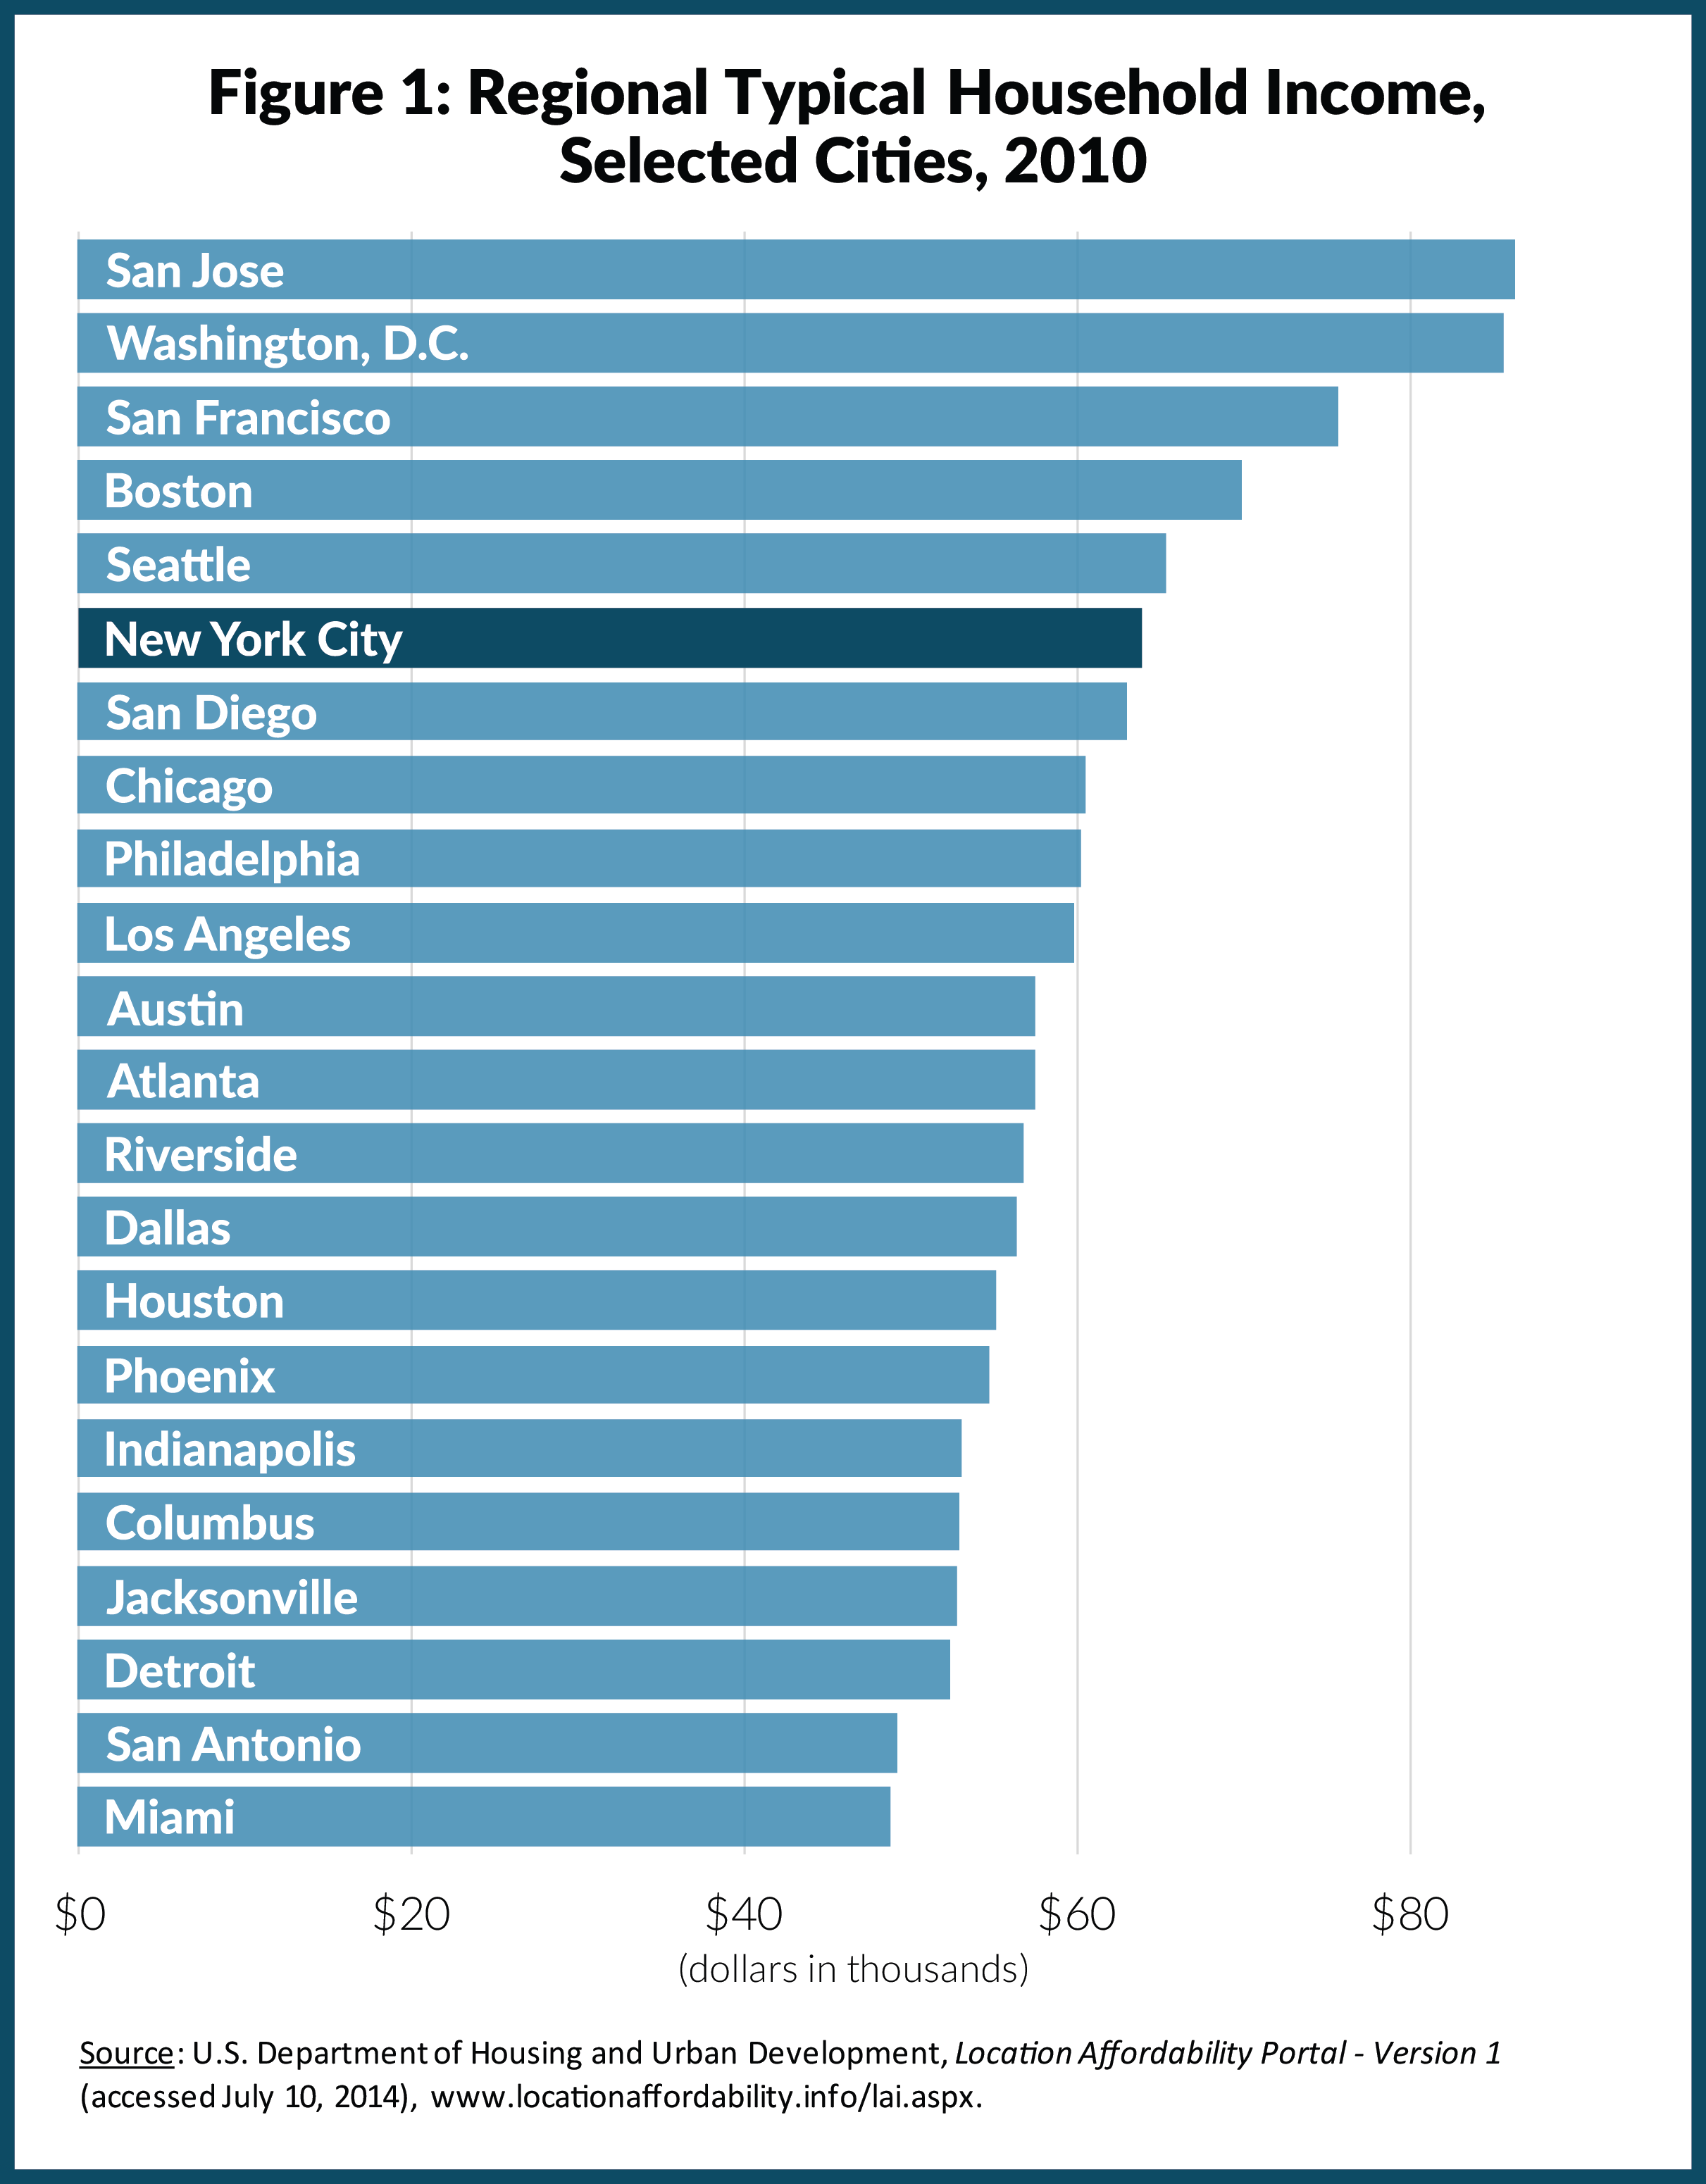
- New York City ranks sixth by regional income ($63,915).
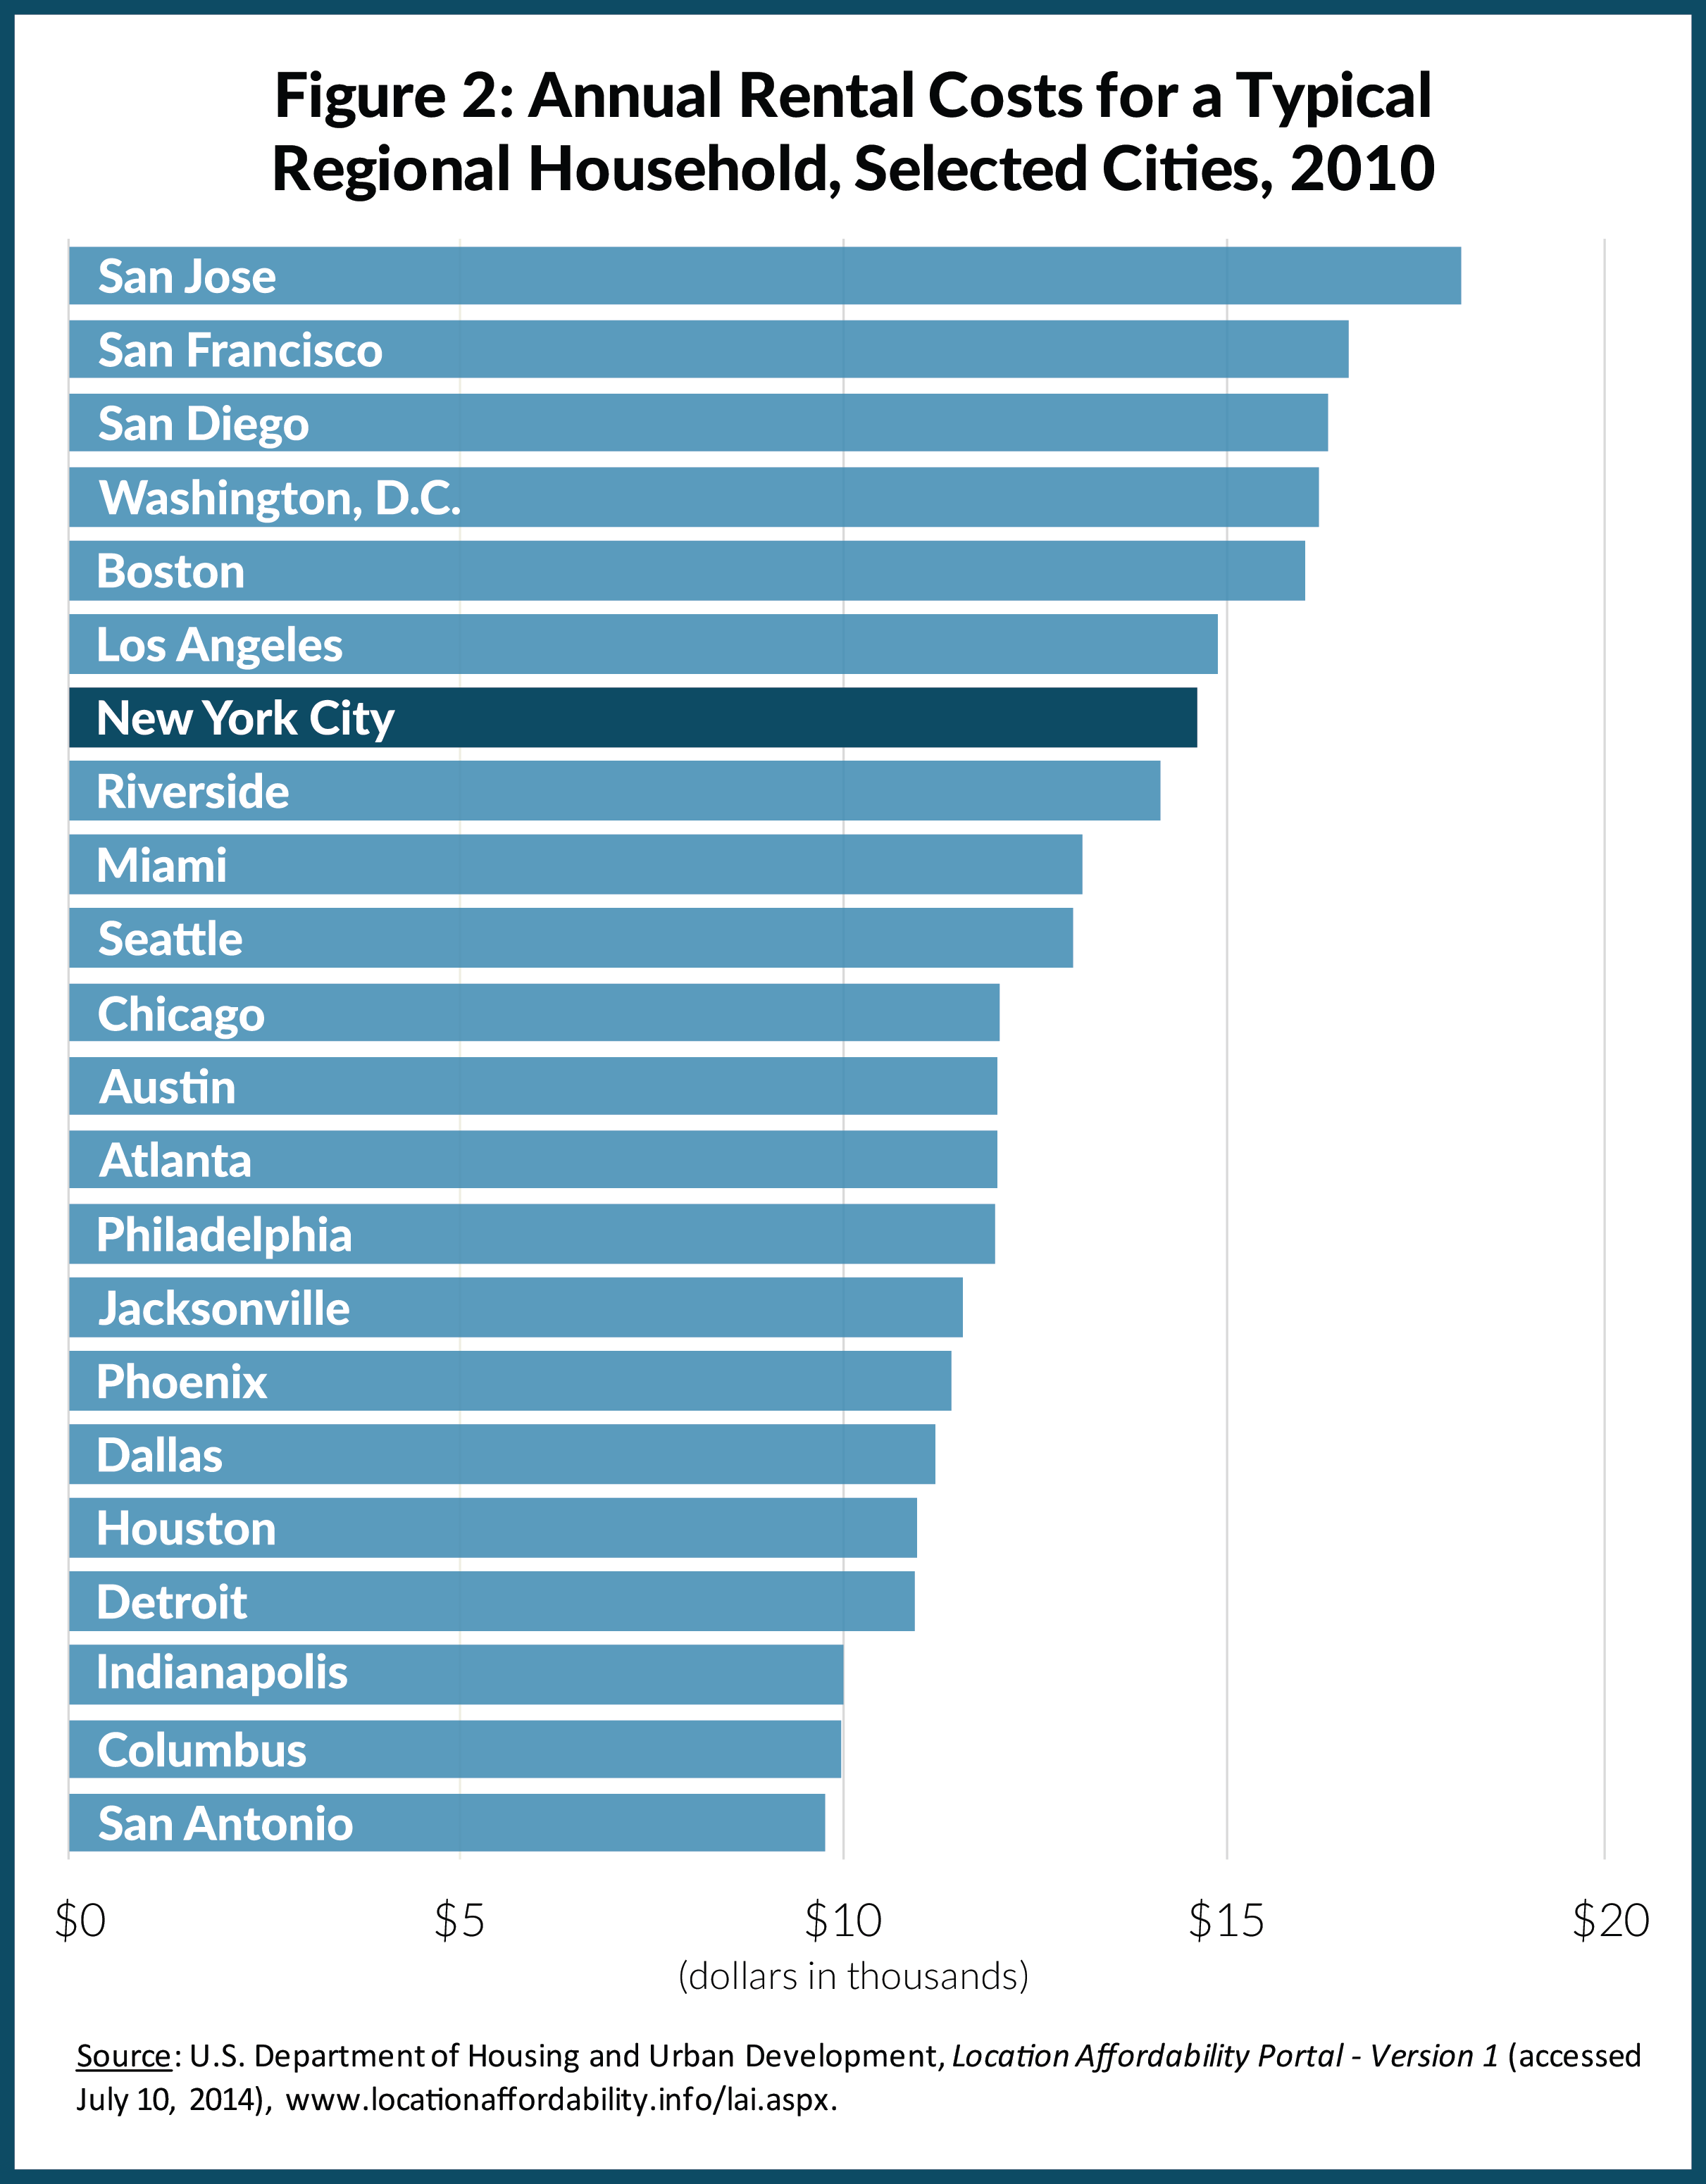
- New York City is the seventh costliest housing market, with annual rent of $14,700.
- New York City has the lowest annual transportation costs ($5,752). Unlike other cities, the majority (56 percent) of households in New York City do not own a car and the same proportion commute by public transit.
- Low transportation costs and high incomes make New York City relatively affordable: New York City is in third place in location affordability. Housing and transportation costs for the typical household are 32 percent of income in New York City, with lower ratios only in Washington, D.C. (29 percent) and San Francisco (31 percent). This is well within HUD’s 45 percent affordability threshold for combined costs as a percent of income.
Overview of the Location Affordability Index
This policy brief uses data for what HUD defines as the “typical regional household.”2 This household is a statistical creation based on average values for selected characteristics – median income, household size, number of workers in the household, and commuting patterns for the workers – of households in the area. For example, a typical household in New York City has 2.69 people, 1.2 commuters, and annual income of $63,915. New York ranks sixth by regional income among the selected peer cities. (See Figure 1).

In addition to household income, the other two elements of the LAI are housing and transportation costs. In each case HUD estimates these costs for the typical household using modeling techniques based on census data for households with similar characteristics. A typical household renting in New York City is estimated to have $14,700 in annual housing costs, ranking seventh highest behind San Jose, San Francisco, San Diego, Washington, D.C., Boston, and Los Angeles. (See Figure 2.) This is consistent with past analysis; New York City rents are high, but not the highest, among large U.S. cities.3

HUD estimates the typical household in New York City spends $5,752 annually on transportation. This is $1,062 less than a typical household in the next lowest cost city, San Francisco. (See Figure 3.)

Transportation costs were $11,217 for a typical household in San Jose, the most expensive city for transportation, nearly twice the cost in New York City.
New York City’s low transportation costs are driven by low household vehicle ownership and high public transit use by commuters. New York City is the only city where a majority of citizens do not own a car (56.5 percent) and a majority of commuters use public transit to get to work (55.9 percent). (See Figure 4.) The extensive bus and subway services provided by the Metropolitan Transportation Authority are an equalizing force for New York’s location affordability that offsets its high rental costs.4

Location Affordability
Because low transportation costs help balance the relatively higher price of housing in New York City, it ranks ninth lowest among the 22 cities in combined housing and transportation costs. Location costs total $20,452 in New York City compared to the lowest costs in Philadelphia ($19,283) and the highest costs in San Jose ($29,337). (See Figure 5.)

The relatively low transportation costs combine with relatively high incomes to boost New York City’s overall location affordability. New York is the third most affordable city for a typical household, behind Washington, D.C. and San Francisco (See Figure 6.) The location cost burden in New York City is 32 percent for the typical household, well
below the 45 percent threshold for combined housing (30 percent) and transportation (15 percent) suggested by HUD as a criterion for affordable housing.

Conclusion
Expanding the concept of affordability to include housing and transportation costs offers a more comprehensive and practical perspective on the location decisions of households. New York City does not rank well among peer cities on housing costs alone, but low transportation costs and relatively high income levels enhance New York City’s competitiveness.
The policy implications of this broader concept of affordability should be clear. New York’s vast transportation system enhances access and encourages increased use of public transit, reducing transportation costs. Municipal leaders should be concerned with the fiscal health and administration of New York City’s major transit agencies – the Metropolitan Transportation Authority, the state and city transportation departments, and the Port Authority of New York and New Jersey. These results also suggest increasing density in transit corridors – an important component of the Mayor’s affordable housing plan – is a sensible approach to development.
Footnotes
- U.S. Department of Housing and Urban Development, Location Affordability Portal – Version 1: About the Portal (accessed July 16 2014), http://www.locationaffordability.info/about.aspx.
- The “typical regional household” is one of eight types of households in the LAI. Each of the household types will be analyzed in another policy brief.
- Citizens Budget Commission, The Affordable Housing Crisis – How Bad Is It in New York City?, www.cbcny.org/sites/default/files/REPORT_NYCAffordableHousing_08062014.pdf.
- The relatively low transportation costs in New York City are likely due to greater reliance on public transit rather than lower costs of car ownership or of public transit. New York City had average car ownership costs of $309 per month for a typical regional household in the LAI, tied for second place behind Washington, D.C. CBC staff analysis of current rates for primary urban transit systems found that a monthly transit pass in New York City costs $112, the third most expensive monthly pass behind Miami ($112.50) and Washington, D.C. ($237). New York City ranks worst among all cities for commute times (39.3 minutes) measured by mean travel time to work.