How Much Do City Taxpayers Really Contribute to the MTA?
The Metropolitan Transportation Authority (MTA) funding debate often is framed in terms of whether the “State” or the “City” is paying its fair share. For example, the most recent budget discussion included calls for the City of New York to pay half of the net operating deficit for Access-A-Ride starting in 2020, up from the current one-third.1 The MTA called this renegotiation “equitable.”2 Fairness was also the focus when the MTA included $3 billion from both New York State and New York City for its 2020-2024 Capital Plan and when the State called on the City to split the costs of the Subway Action Plan.
The challenge of this perspective is its focus on the State and City budgets rather than which taxpayers actually foot the bill. These debates would be clearer if it were widely understood that New York City taxpayers provide 71 percent of the MTA’s non-fare and toll, nonfederal revenue through a combination of local, regional, and State taxes.3 City taxpayers not only provide substantial support through the City budget, but also pay the bulk of taxes dedicated to the MTA and much of the contribution made from the State budget.
In 2018 City taxpayers, through the City budget, contributed nearly $1.7 billion of its own tax revenue to the MTA, including $1.1 billion of direct operating contributions (as recorded in the MTA’s November Financial Plan) and $397 million of capital funding.4 (See Table 1.) Of this $254 million in operating and $164 million in capital contributions were for the Subway Action Plan (SAP).5 The City-sponsored Hudson Yards Infrastructure Corporation (HYIC) also contributed $134 million for debt service on bonds issued by to pay for the extension of the No. 7 train.6
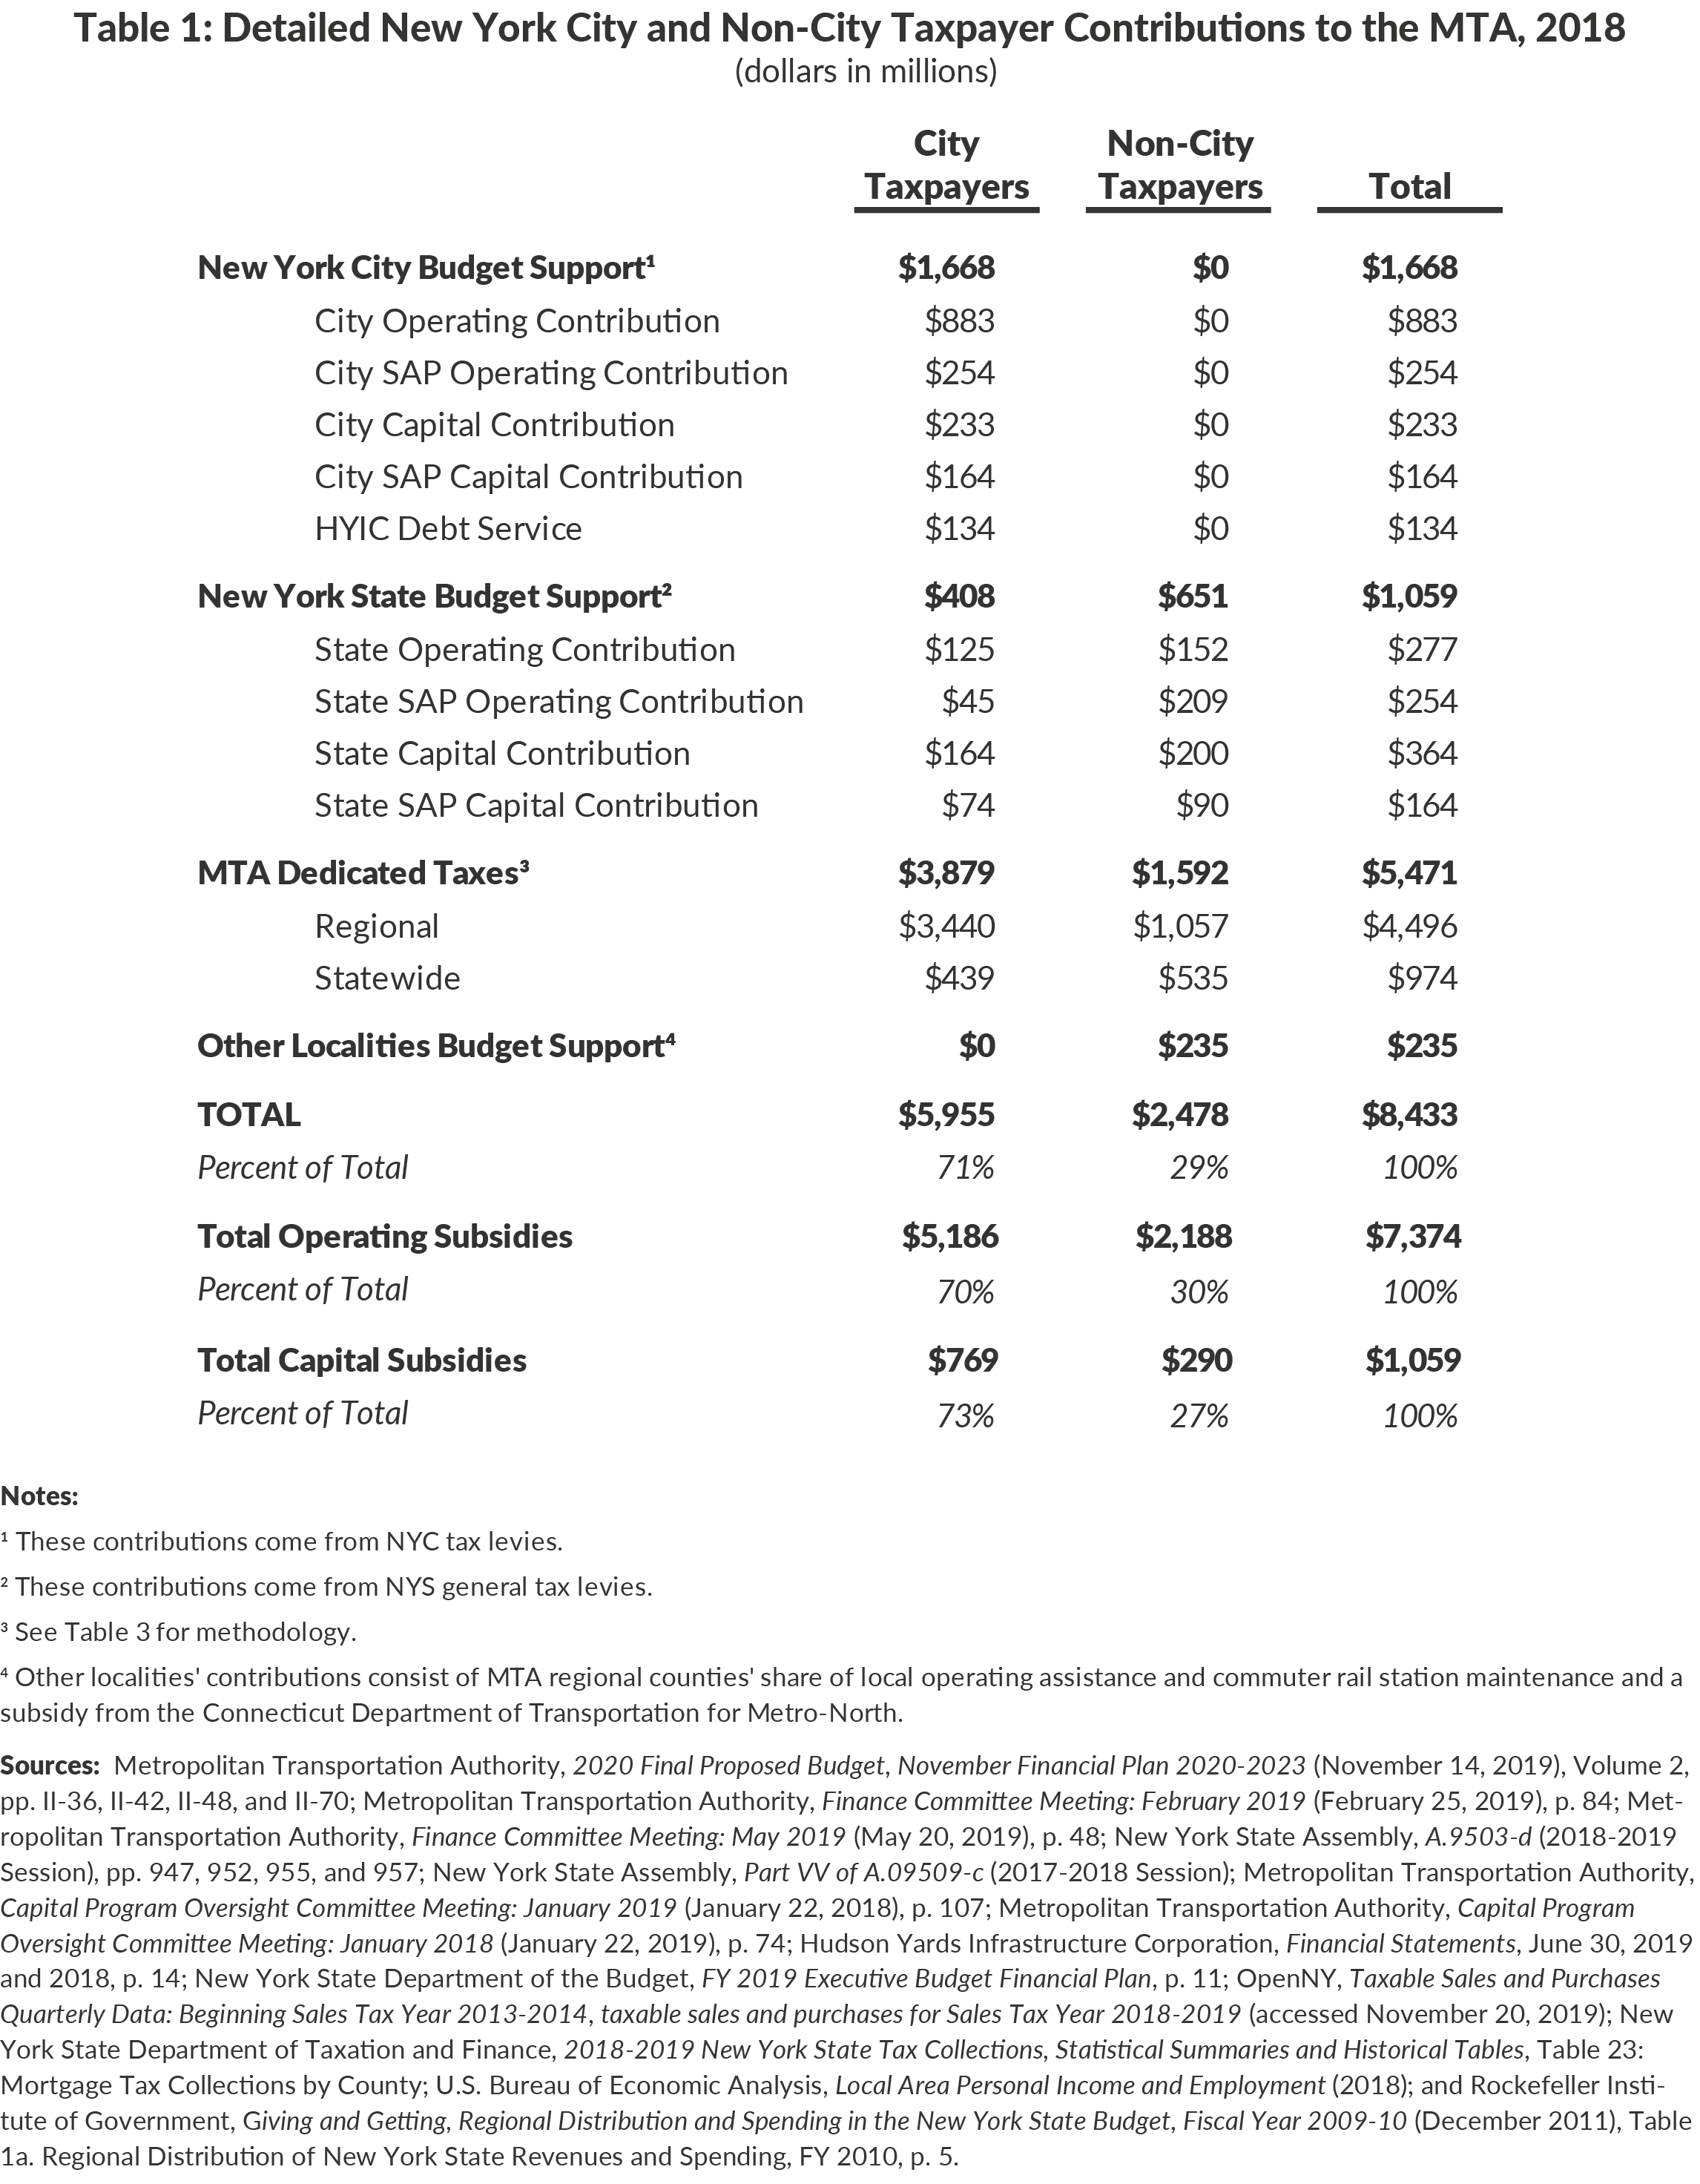
New York City residents and businesses also pay 71 percent of the regional and statewide taxes the State allocates to the MTA. These State-authorized taxes totaled $5.5 billion in 2018, including $4.5 billion from taxes within the MTA region and $974 million appropriated from statewide general taxes.7
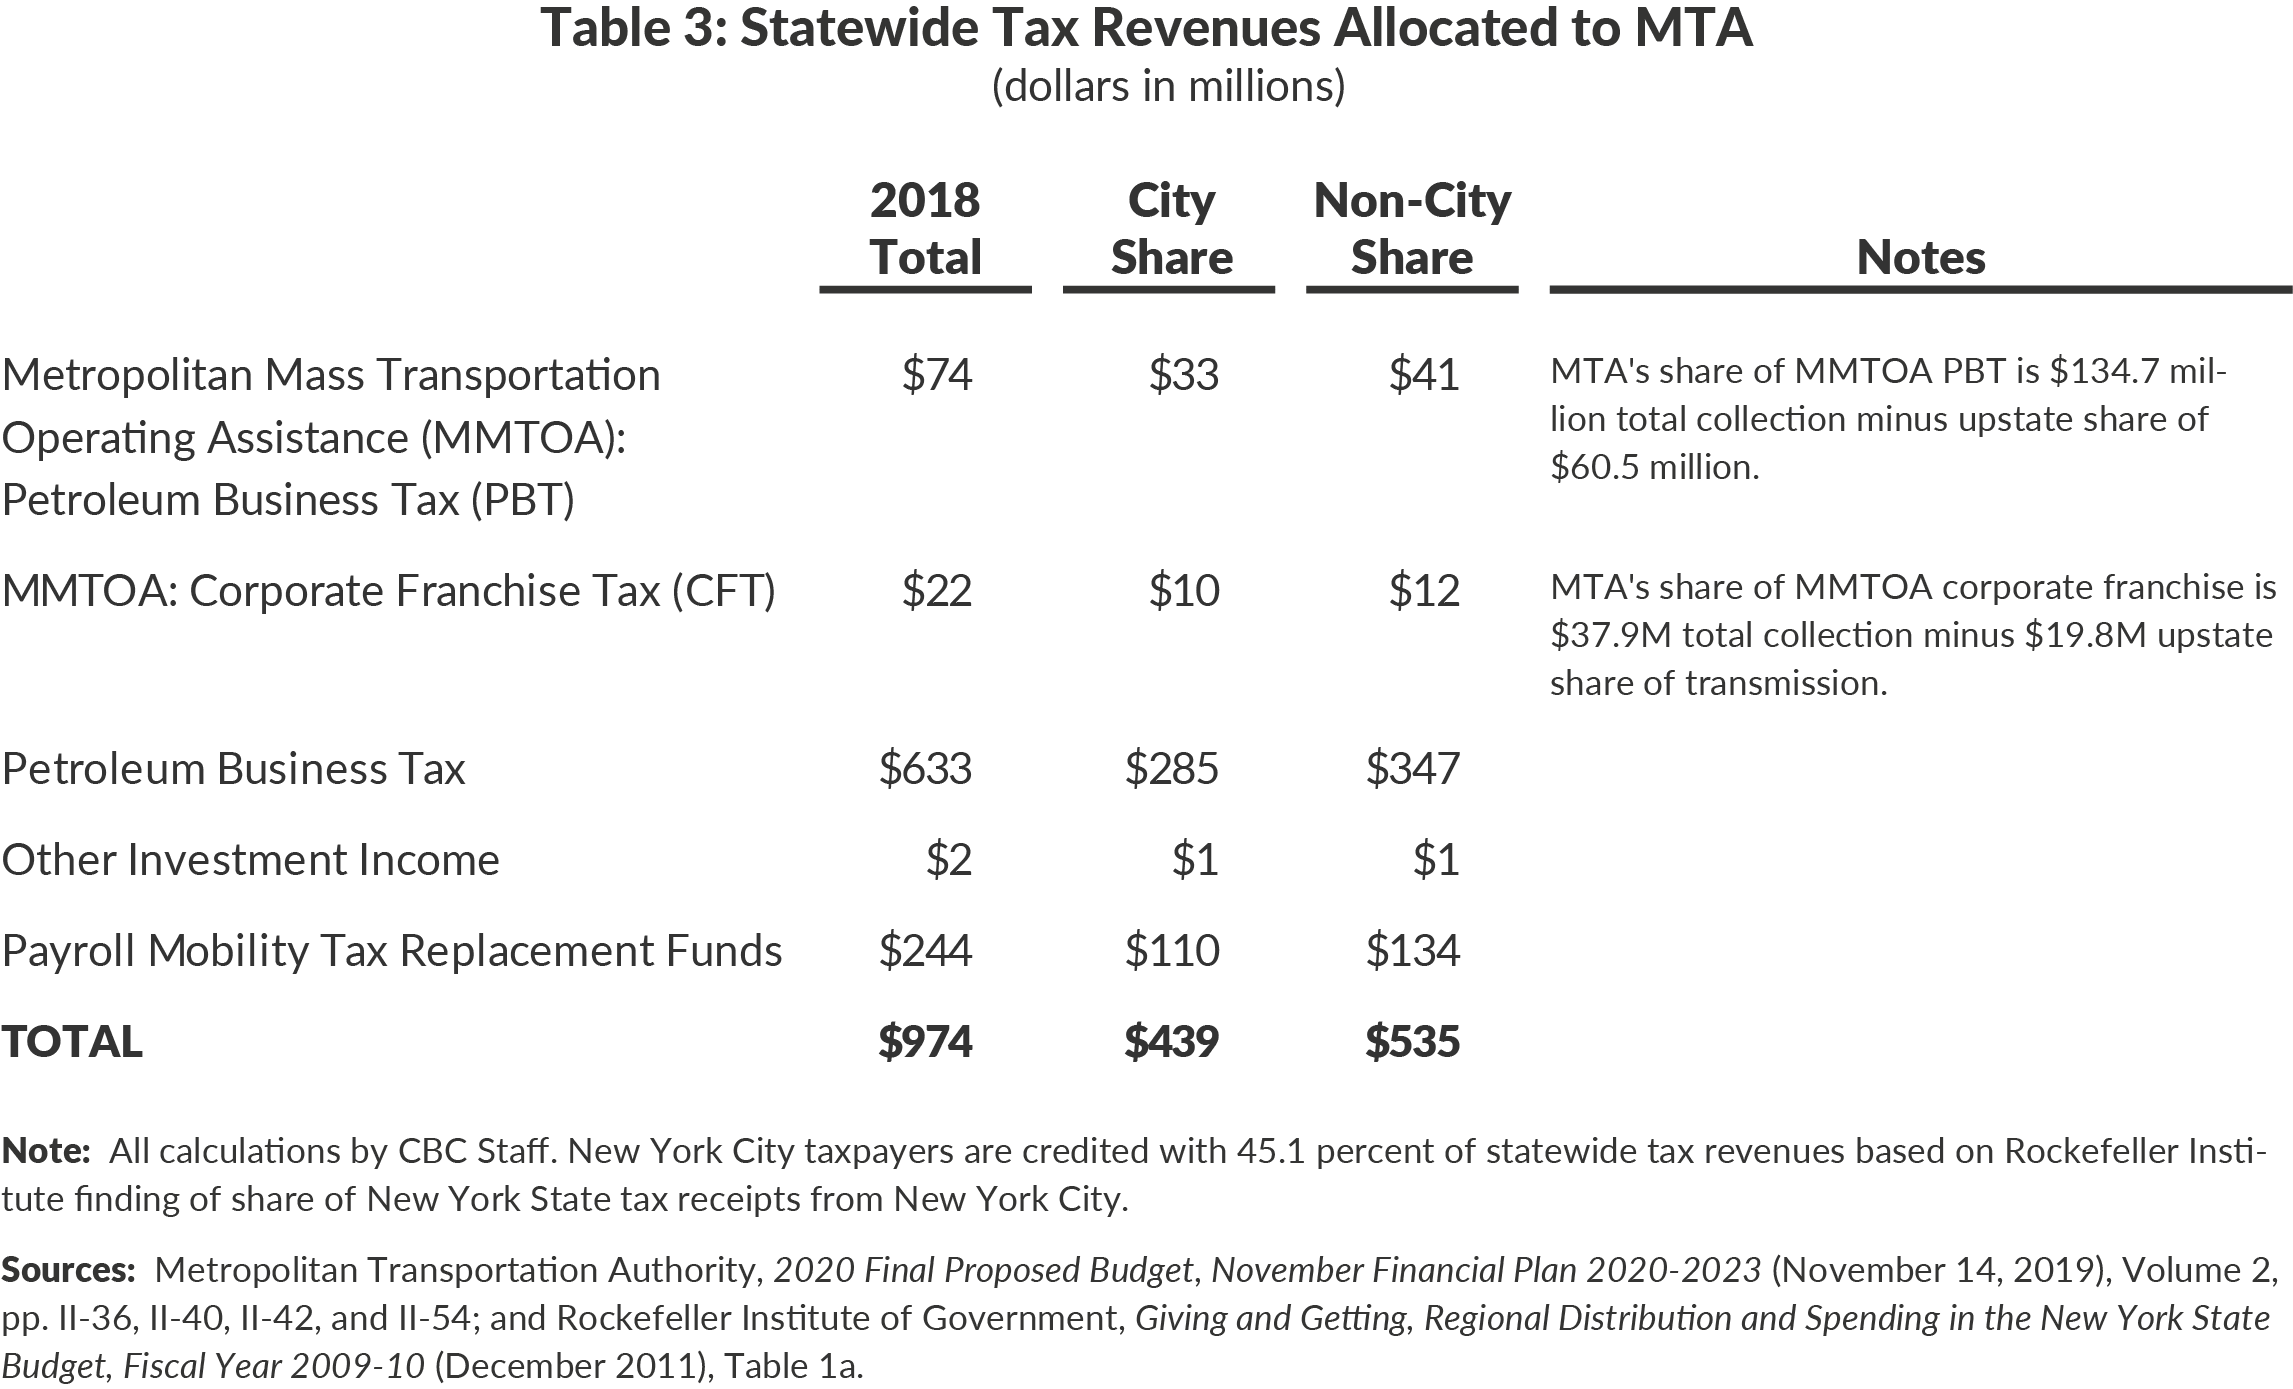
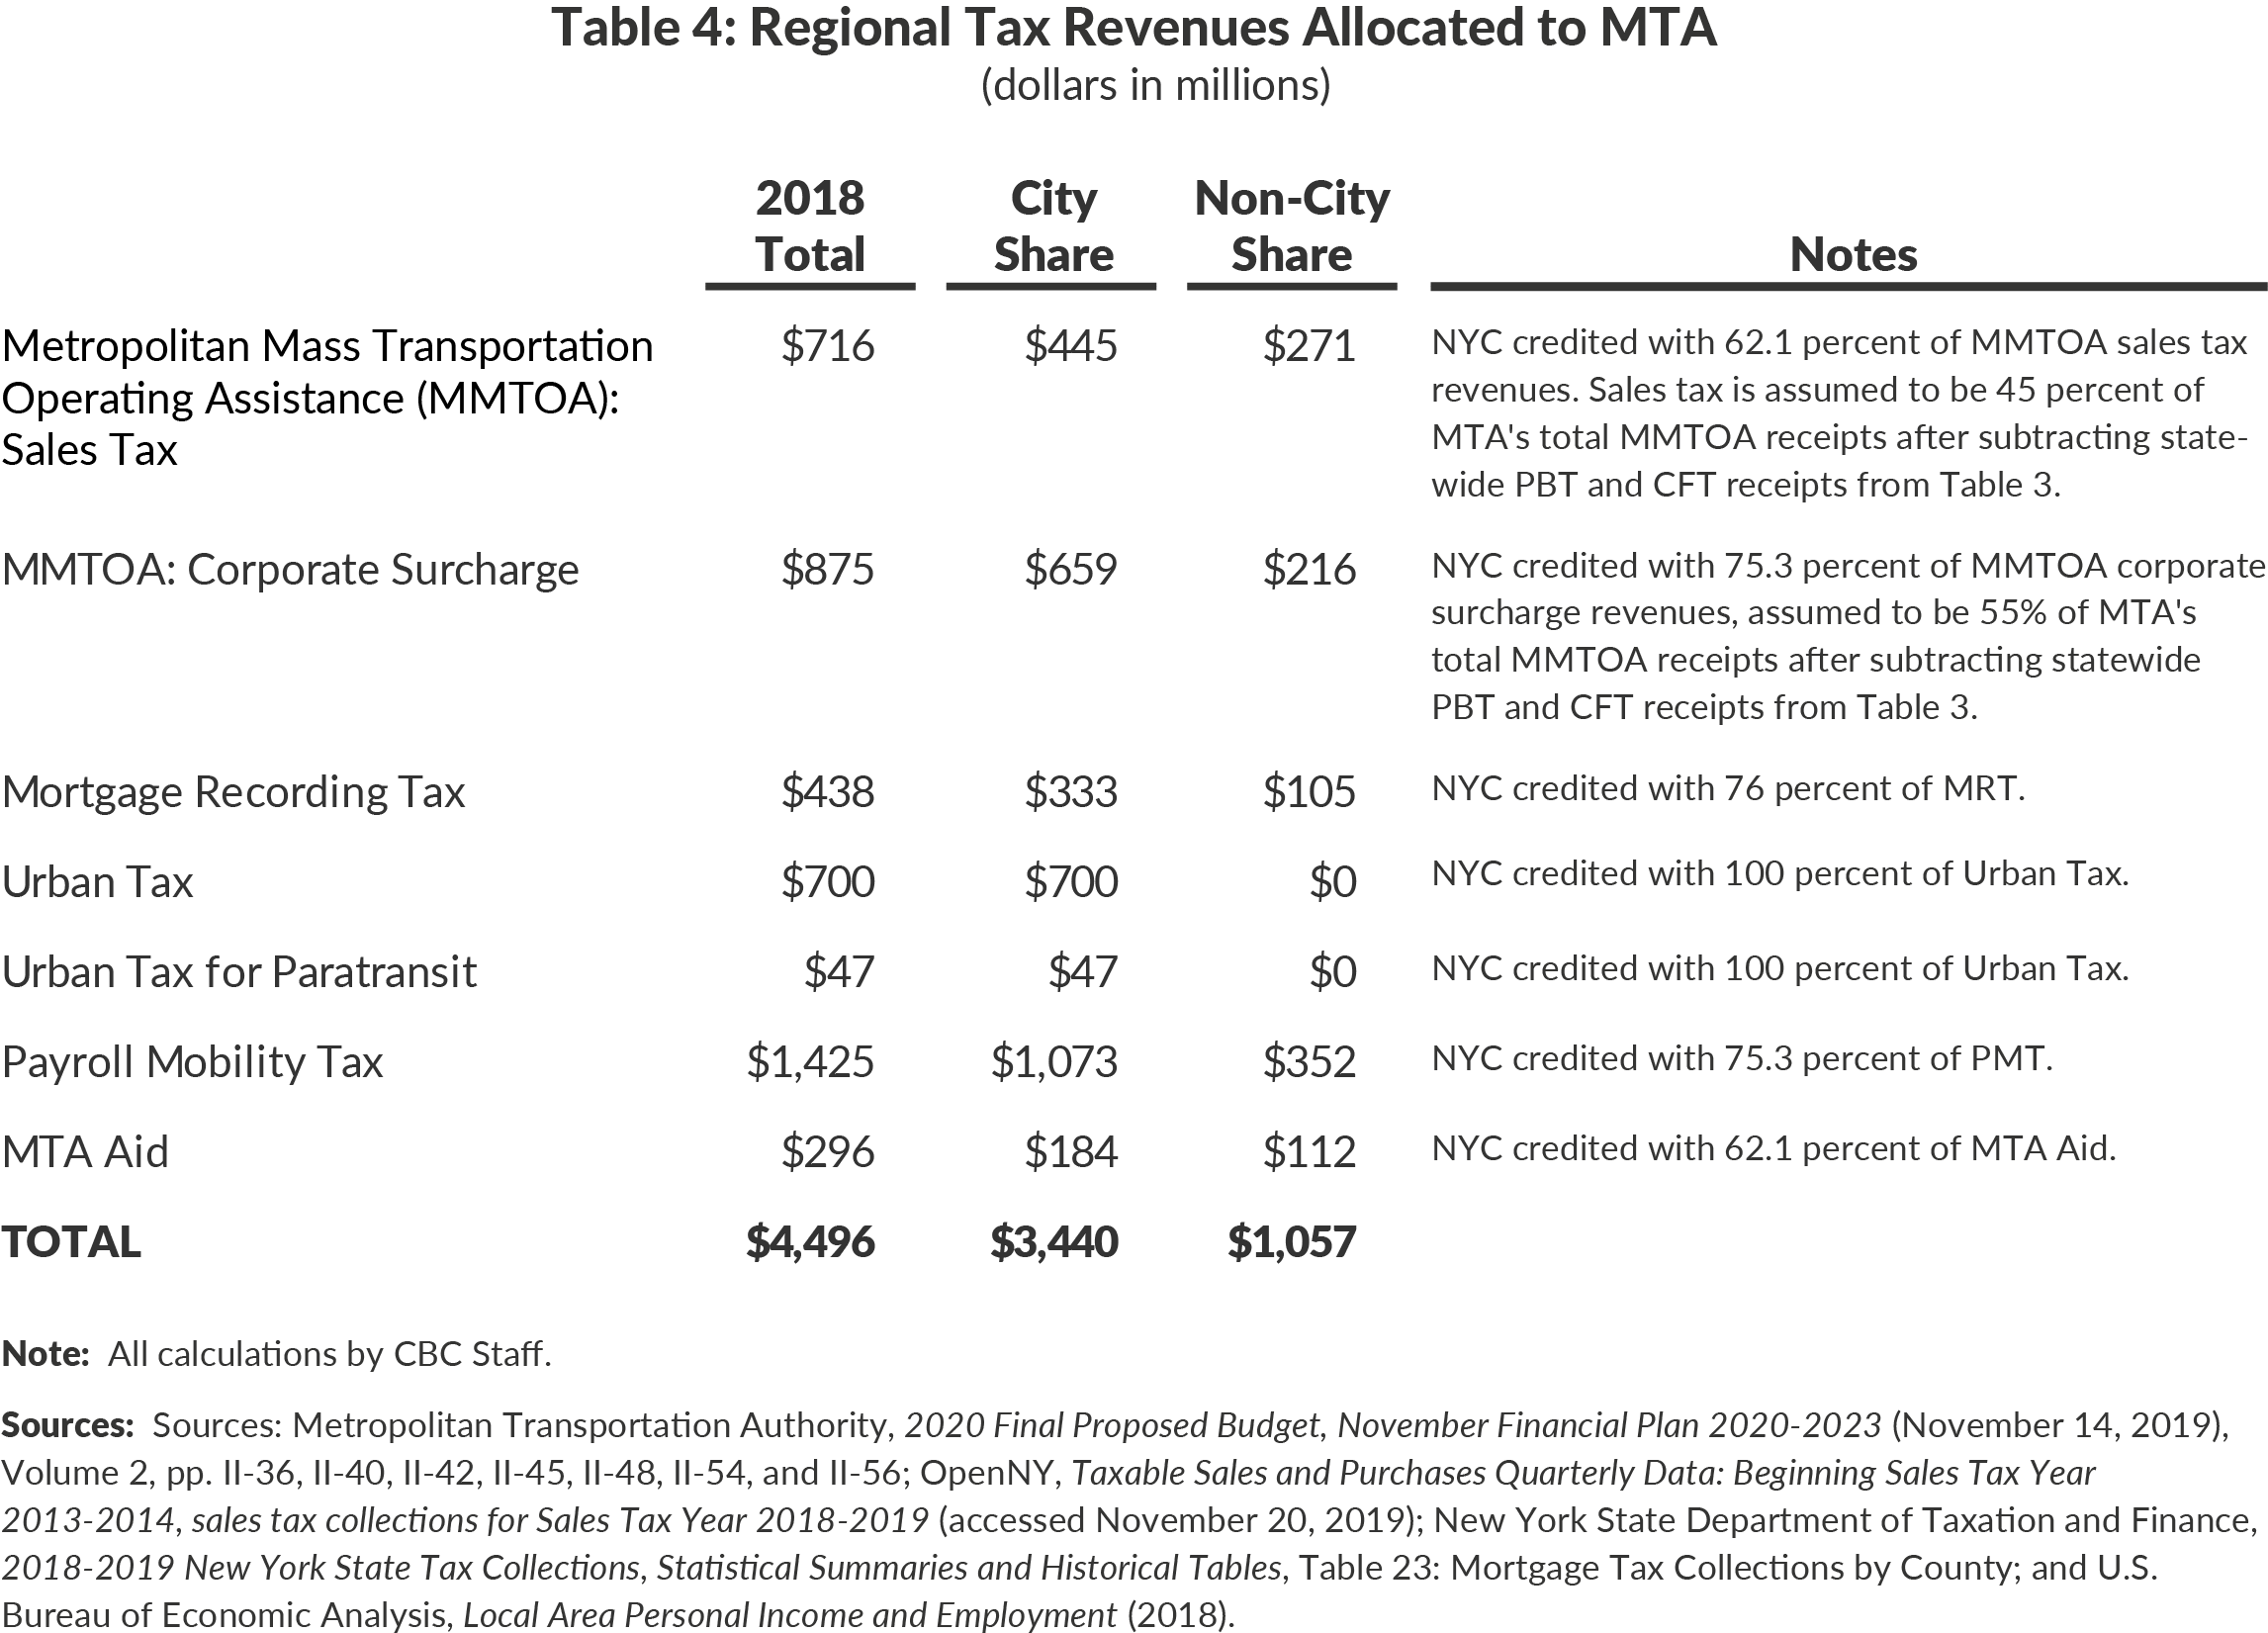
Within the MTA region, the City accounts for 62 percent of the taxable sales and purchases, 76 percent of the collections for mortgage taxes including taxes dedicated to the MTA, and 75 percent of wages and salaries.8 (See Table 2.) Allocating the shares of the various dedicated regional tax revenues reveals that New York City residents and businesses paid $3.4 billion, or 76.5 percent, of the total $4.5 billion MTA regional taxes. New York City taxpayers also contribute 45 percent, or $439 million, of statewide revenues dedicated to the MTA.9 In sum, the City contributed nearly $3.9 billion of the $5.5 billion of the State-authorized general and regional taxes provided to the MTA.
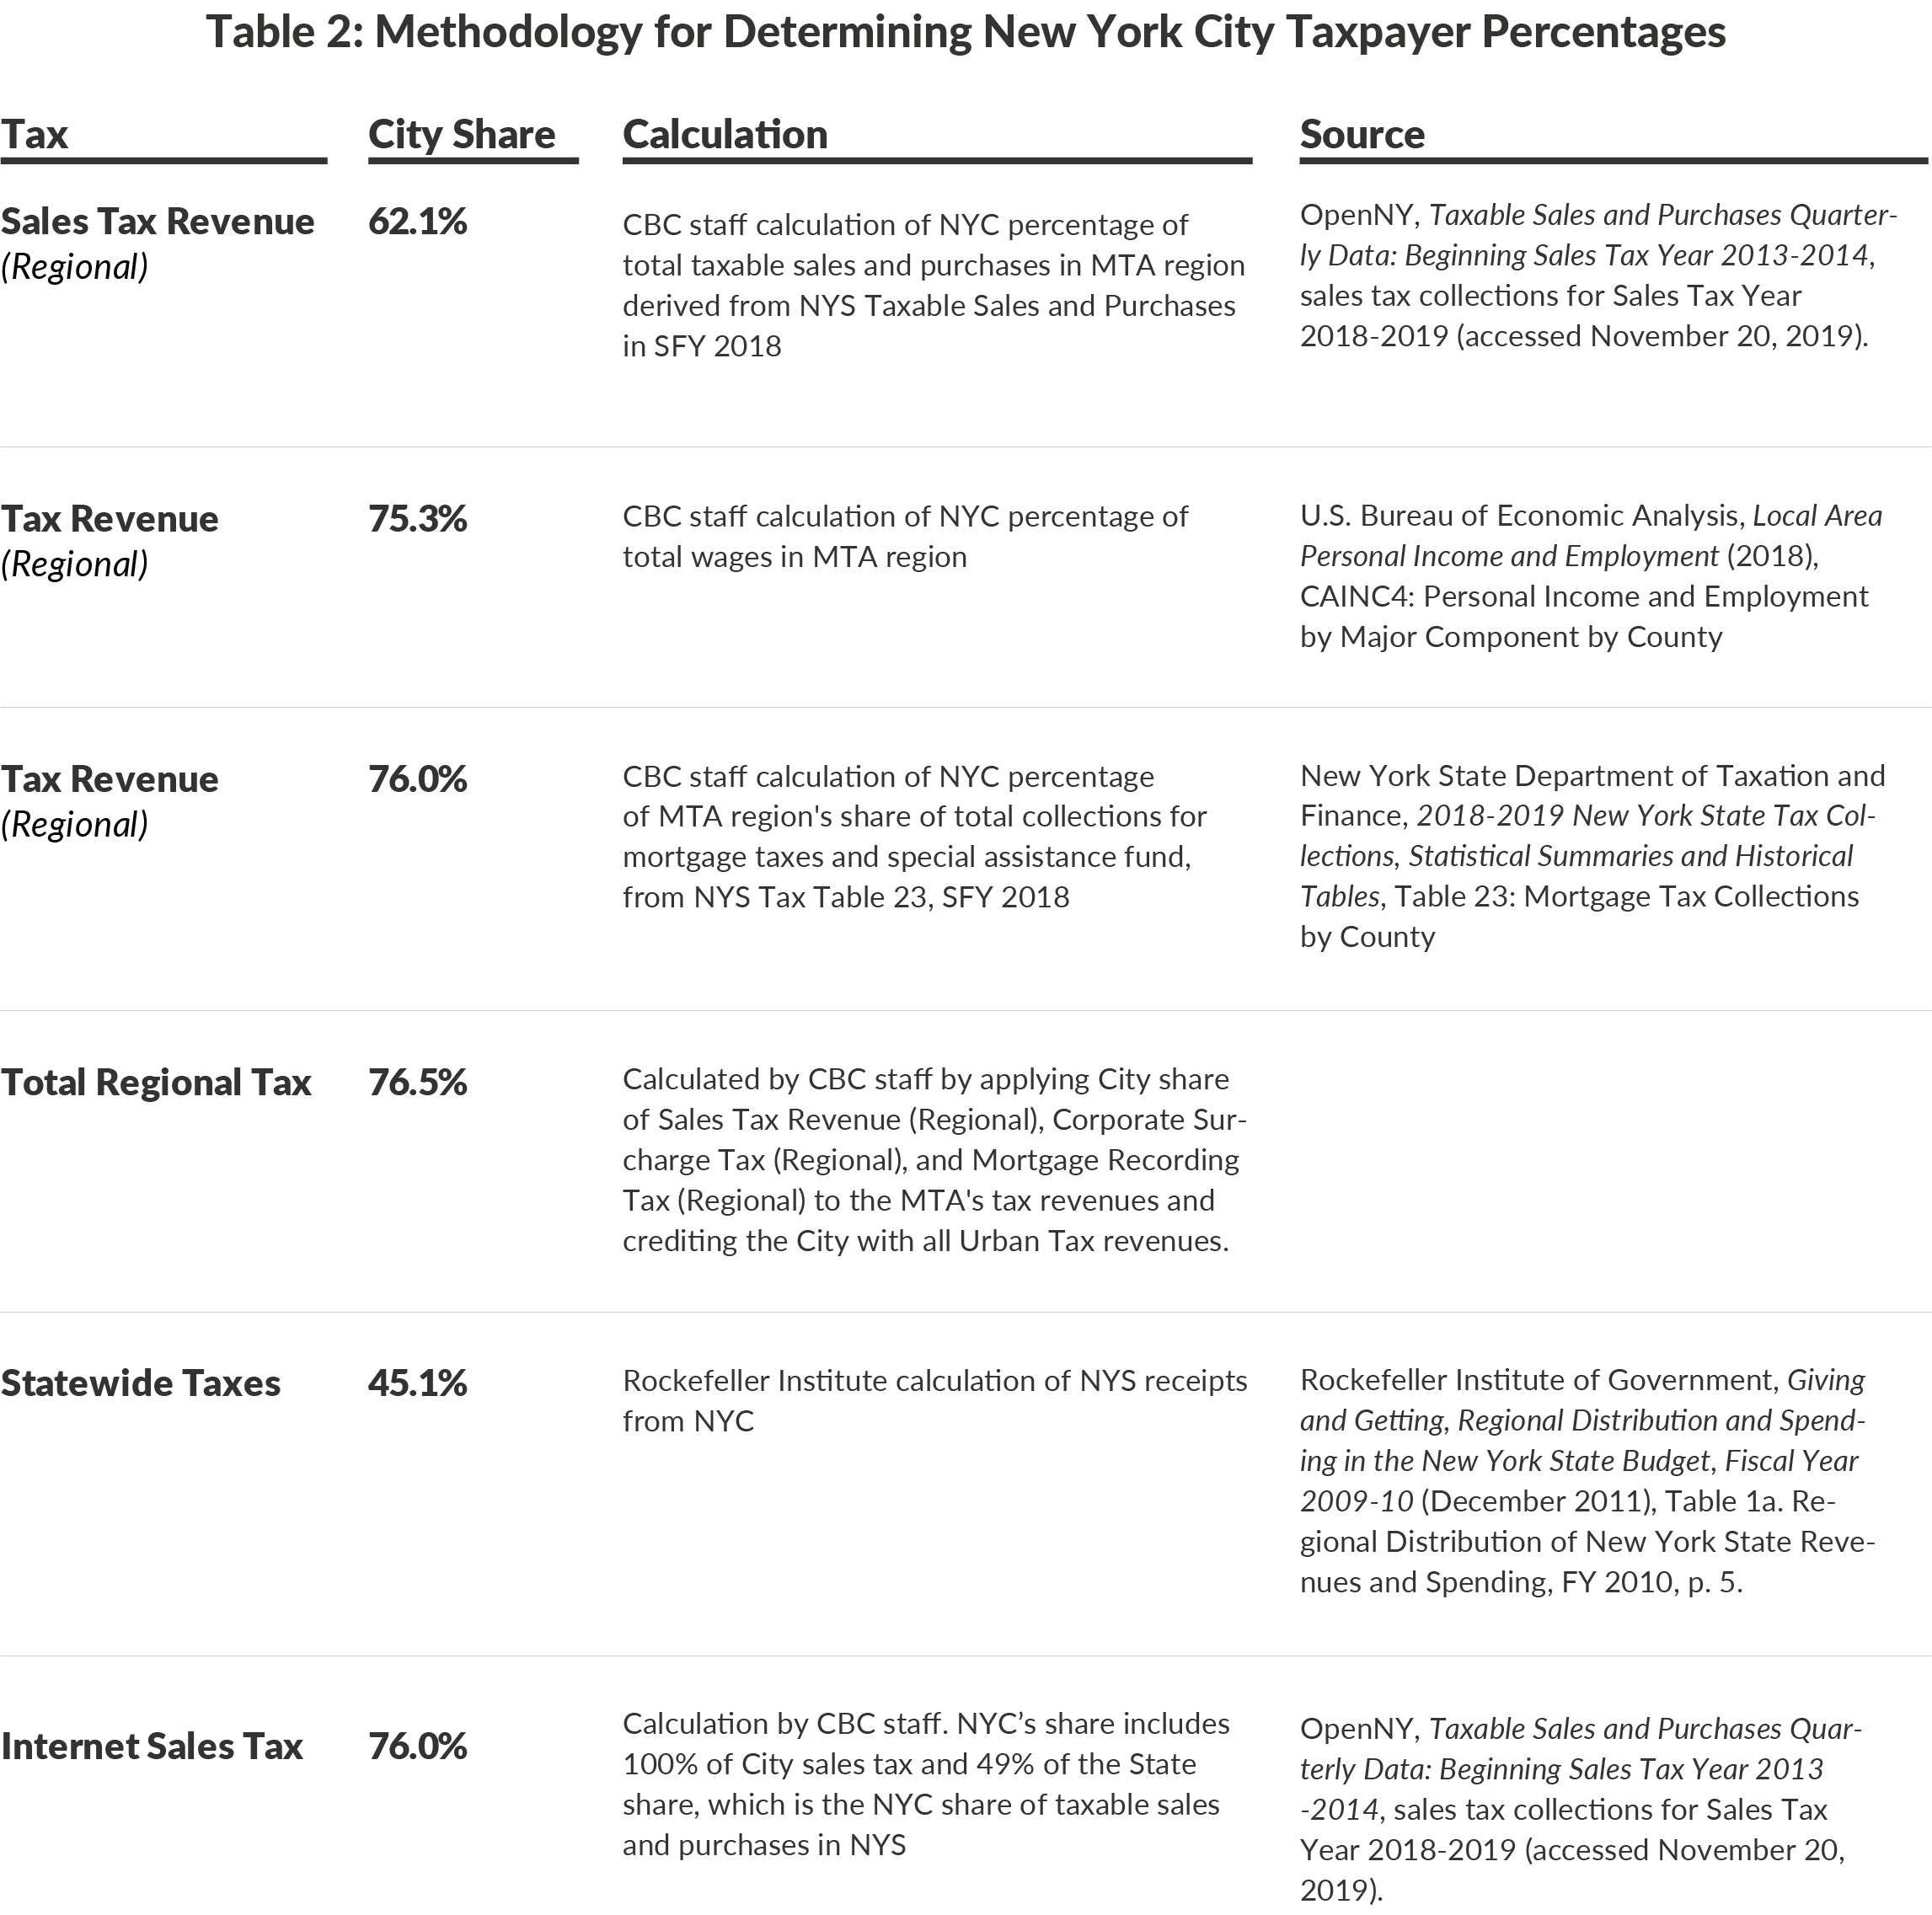
In addition to their other contributions, City taxpayers pay an estimated 45 percent of the State’s $641 million of direct operating and capital budget contributions to the MTA, or $289 million, since they contribute 45 percent of the State’s revenues.10
While the SAP was supported by “equal” State and City one-time payments, City taxpayers funded 28 percent of the State’s share.11 The State’s contribution comes from a combination of Payroll Mobility Tax (PMT) revenue, extraordinary monetary settlements, and other general fund dollars.12 Since 75 percent of the PMT and 45 percent of statewide revenues are generated in New York City, City taxpayers funded $119 million of the State’s portion of the SAP.13
Adding these pieces together, City taxpayers contributed almost $6 billion, or 71 percent, of non-fare and toll, non-federal MTA revenue in 2018, and non-city taxpayers contributed almost $2.5 billion.14
Future Trends
The portion of MTA revenue coming from City taxpayers will increase due to new State-created taxes and fees which will primarily come from City sources. In its 2019 Enacted Budget, the State established a new revenue stream from surcharges on for-hire vehicle trips that start, terminate in, or traverse Manhattan below 96th Street. The MTA forecasts the surcharge will raise $362 million in 2019, growing to $435 million in 2020 and thereafter.15 In the 2020 Enacted Budget, the State enacted legislation directing three new revenue sources to the MTA, which are expected to support $25 billion of the 2020-2024 Capital Program.16 The MTA forecasts the new mansion tax, which applies to New York City real property sales of at least $2 million, will generate $374 million in 2020, growing to $411 million in 2023. The share of City and State internet marketplace tax directed to the MTA will grow from $320 million in 2020 to $329 million in 2023.17 A third source of revenue will come from the creation of a Manhattan central business district tolling program, starting in 2021.18 Toll rates have not yet been set.
The for-hire vehicle surcharges are for trips that include Manhattan below 96th Street and the mansion tax only applies to City sales. City taxpayers will pay all of the City portion of the internet sales tax, and 49 percent of the State portion.19 Overall, in 2020 City taxpayers will pay 93 percent of these new funding sources, and 74 percent of all operating subsidies.20 City taxpayers will also likely pay a substantial portion of the central business district tolls starting in 2021.
Whenever there is a call for “the City” to provide the MTA with funding, it is important to recognize that City taxpayers already provide the majority of the MTA’s subsidies, and will only pay more in future years.
Download Blog
How Much Do City Taxpayers Really Contribute to the MTA?Footnotes
- The City pays one-third of the net operating deficit for Access-A-Ride pursuant to a 1993 agreement. See: Metropolitan Transportation Authority, 2020 Final Proposed Budget, November Financial Plan 2020-2023 (November 14, 2019), Volume 1, pp. I-4 and II-3, https://new.mta.info/sites/default/files/2019-11/MTA%202020%20Final%20Proposed%20Budget%20-%20November%20Financial%20Plan%202020-2023%20Volume%201.pdf.
- Metropolitan Transportation Authority, 2020 Final Proposed Budget, November Financial Plan 2020-2023 (November 14, 2019), Volume 1, p. I-4, https://new.mta.info/sites/default/files/2019-11/MTA%202020%20Final%20Proposed%20Budget%20-%20November%20Financial%20Plan%202020-2023%20Volume%201.pdf.
- This total includes City and State capital receipts for 2018. These receipts will vary from year to year since the City and State reimburse the MTA based on the portfolio of work for each year.
- Metropolitan Transportation Authority, 2020 Final Proposed Budget, November Financial Plan 2020-2023 (November 14, 2019), Volume 2, pp. II-36 and II-70, https://new.mta.info/sites/default/files/2019-11/MTA%202020%20Final%20Proposed%20Budget%20-%20November%20Financial%20Plan%202020-2023%20Volume%201.pdf; Finance Committee Meeting: February 2019 (February 25, 2019), p. 84, http://web.mta.info/mta/news/books/archive/190225_1245_Finance.pdf; Finance Committee Meeting: May 2019 (May 20, 2019), p. 48, http://web.mta.info/mta/news/books/archive/190520_1245_Finance.pdf; Capital Program Oversight Committee Meeting: January 2018 (January 22, 2018), p. 107, http://web.mta.info/mta/news/books/pdf/180122_1400_CPOC.pdf; Capital Program Oversight Committee Meeting: January 2019 (January 22, 2019), p. 74, http://web.mta.info/mta/news/books/pdf/190122_1400_CPOC.pdf; and New York State Assembly, A.9503-d (2018-2019 Session), pp. 947, 952, 955, and 957, https://nyassembly.gov/leg/?default_fld=&leg_video=&bn=A09503&term=2017&Summary=Y&Text=Y;.
- Metropolitan Transportation Authority, 2020 Final Proposed Budget, November Financial Plan 2020-2023 (November 14, 2019), Volume 2, p. II-36, https://new.mta.info/sites/default/files/2019-11/MTA%202020%20Final%20Proposed%20Budget%20-%20November%20Financial%20Plan%202020-2023%20Volume%201.pdf; Capital Program Oversight Committee Meeting: January 2018 (January 22, 2018), p. 107, http://web.mta.info/mta/news/books/pdf/180122_1400_CPOC.pdf; Capital Program Oversight Committee Meeting: January 2019 (January 22, 2019), p. 74, http://web.mta.info/mta/news/books/pdf/190122_1400_CPOC.pdf; and New York State Assembly, Part VV of A.09509-c (2017-2018 Session), https://nyassembly.gov/leg/?default_fld=%0D%0A&leg_video=&bn=A09509&term=2017&Summary=Y&Text=Y.
- Hudson Yards Infrastructure Corporation, Financial Statements, June 30, 2019 and 2018, p. 14, https://www1.nyc.gov/assets/hyic/downloads/hyic-financial-statements-2019.pdf.
- The MTA region includes New York City and Dutchess, Nassau, Orange, Putnam, Rockland, Suffolk, and Westchester counties. See: Metropolitan Transportation Authority, 2020 Final Proposed Budget, November Financial Plan 2020-2023 (November 14, 2019), Volume 2, p. II-36, https://new.mta.info/sites/default/files/2019-11/MTA%202020%20Final%20Proposed%20Budget%20-%20November%20Financial%20Plan%202020-2023%20Volume%201.pdf.
- OpenNY, Taxable Sales and Purchases Quarterly Data: Beginning Sales Tax Year 2013-2014, taxable sales and purchases for Sales Tax Year 2018-2019 (accessed November 20, 2019), https://data.ny.gov/Government-Finance/Taxable-Sales-And-Purchases-Quarterly-Data-Beginni/ny73-2j3u/data; New York State Department of Taxation and Finance, 2018-2019 New York State Tax Collections, Statistical Summaries and Historical Tables, Table 23: Mortgage Tax Collections by County, https://tax.ny.gov/pdf/2018-19_collections/Tables%2023.pdf; and U.S. Bureau of Economic Analysis, Local Area Personal Income and Employment (2018), https://apps.bea.gov/iTable/iTable.cfm?acrdn=7&isuri=1&reqid=70&step=1#acrdn=7&isuri=1&reqid=70&step=1.
- Rockefeller Institute of Government, Giving and Getting, Regional Distribution and Spending in the New York State Budget, Fiscal Year 2009-10 (December 2011), Table 1a. Regional Distribution of New York State Revenues and Spending, FY 2010, p. 5, https://rockinst.org/wp-content/uploads/2017/11/2011-12-Giving_and_Getting-min.pdf.
- These revenues include $188 million of 18-B assistance, $89 million of MTA Bus Company subsidy, and $364 million of non-SAP capital contribution. See: Metropolitan Transportation Authority, 2020 Final Proposed Budget, November Financial Plan 2020-2023 (November 14, 2019), Volume 2, p. II-36, https://new.mta.info/sites/default/files/2019-11/MTA%202020%20Final%20Proposed%20Budget%20-%20November%20Financial%20Plan%202020-2023%20Volume%201.pdf; Capital Program Oversight Committee Meeting: January 2018 (January 22, 2018), p. 107, http://web.mta.info/mta/news/books/pdf/180122_1400_CPOC.pdf; Capital Program Oversight Committee Meeting: January 2019 (January 22, 2019), p. 74, http://web.mta.info/mta/news/books/pdf/190122_1400_CPOC.pdf; and New York State Assembly, A.9503-d (2018-2019 Session), pp. 947, 952, 955, and 957, https://nyassembly.gov/leg/?default_fld=&leg_video=&bn=A09503&term=2017&Summary=Y&Text=Y; and Part VV of A.09509-c (2017-2018 Session), https://nyassembly.gov/leg/?default_fld=%0D%0A&leg_video=&bn=A09509&term=2017&Summary=Y&Text=Y.
- An additional $10 million from both the State and the City was to be provided in 2019 from proceeds of a new for-hire vehicle and taxi surcharge. See: Metropolitan Transportation Authority, MTA Capital Program Amendment Capital Program Briefing (April 2018), p. 17, http://web.mta.info/mta/news/books/docs/2018_April-Capital-Presentation.pdf.
- New York State Department of the Budget, FY 2019 Executive Budget Financial Plan, p. 11, https://publications.budget.ny.gov/pubs/archive/fy19/exec/fy19fp/FinPlan.pdf.
- The State’s contribution includes $60 million of PMT revenue, $194 million of extraordinary settlement fund dollars, and $174 million of capital funding, $10 million of which comes from the for-hire vehicle surcharge. See: New York State Department of the Budget, FY 2019 Executive Budget Financial Plan, p. 11, https://publications.budget.ny.gov/pubs/archive/fy19/exec/fy19fp/FinPlan.pdf.
- In addition to State subsidies, the $2.5 billion of non-City taxpayer funds includes direct operating assistance and taxes from other counties in the MTA region, as well as a subsidy from the Connecticut Department of Transportation for Metro-North lines running through Connecticut. See: Metropolitan Transportation Authority, 2020 Final Proposed Budget, November Financial Plan 2020-2023 (November 14, 2019), Volume 2, pp. II-36 and II-42.
- Metropolitan Transportation Authority, 2020 Final Proposed Budget, November Financial Plan 2020-2023 (November 14, 2019), Volume 2, pp. II-36 and II-50, https://new.mta.info/sites/default/files/2019-11/MTA%202020%20Final%20Proposed%20Budget%20-%20November%20Financial%20Plan%202020-2023%20Volume%201.pdf.
- New York State Assembly, Parts G, OOO, and ZZZ of A.2009-c (2019-2020 Session), https://nyassembly.gov/leg/?default_fld=%0D%0A&leg_video=&bn=A02009&term=2019&Summary=Y&Text=Y.
- Metropolitan Transportation Authority, 2020 Final Proposed Budget, November Financial Plan 2020-2023 (November 14, 2019), Volume 2, pp. II-36 and II-52, https://new.mta.info/sites/default/files/2019-11/MTA%202020%20Final%20Proposed%20Budget%20-%20November%20Financial%20Plan%202020-2023%20Volume%201.pdf.
- New York State Assembly, Part ZZZ of A.2009-c (2019-2020 Session), https://nyassembly.gov/leg/?default_fld=%0D%0A&leg_video=&bn=A02009&term=2019&Summary=Y&Text=Y.
- New York City accounted for 49 percent of New York State taxable sales and purchases in Sales Tax Year 2018-2019. OpenNY, Taxable Sales and Purchases Quarterly Data: Beginning Sales Tax Year 2013-2014 (accessed November 20, 2019), https://data.ny.gov/Government-Finance/Taxable-Sales-And-Purchases-Quarterly-Data-Beginni/ny73-2j3u/data.
- City taxpayers are assumed to contribute 2020 MTA-designated taxes at the same rates as in the 2018 analysis. See: Metropolitan Transportation Authority, 2020 Final Proposed Budget, November Financial Plan 2020-2023 (November 14, 2019), Volume 2, pp. II-36, II-42, and II-70, https://new.mta.info/sites/default/files/2019-11/MTA%202020%20Final%20Proposed%20Budget%20-%20November%20Financial%20Plan%202020-2023%20Volume%201.pdf.