The Learning Ledger
NYS School Aid Continues to Rise in the 2023-24 School Year
Highlights
- State School Aid Increases 8.8 Percent to $37.4 Billion
- Total School Spending Reaches $85.8 Billion, and $35,095 Per Pupil
- Three-Year ‘Phase-In’ Increases Foundation Aid by 30 Percent
- State Aid Per Pupil Increases 10.2 Percent to $15,289
- New York Provides $2.8 Billion to Districts that Already Fund a Sound Basic Education with Local and Regular Federal Resources
- New York Spends Nearly Double the National Average Per Pupil, and Spending has Grown at a Faster Rate
- Improved Educational Outcomes, Narrowed Disparities, and More Accountability Should Accompany Increased Resources
- Conclusion
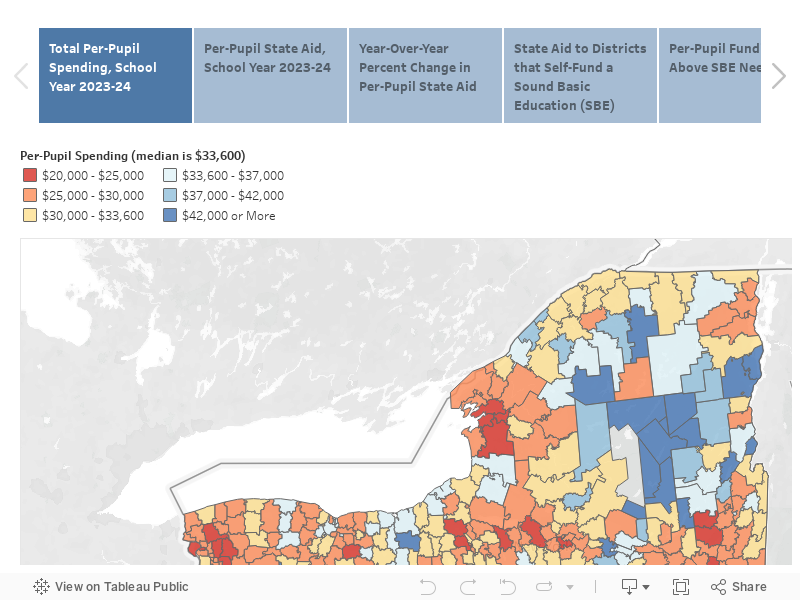
Interactive Maps: School Aid by District: SY 2023-24
New York State’s school aid increases 8.8 percent this year, largely driven by the final year of three-year phase-in of Foundation Aid and despite the State facing massive future budget gaps. The increase is more stark given the continued decline in enrollment; State aid per student increases 10.2 percent.
Aid growth will not end with the completed phase in. State school aid is slated to increase 4.3 percent annually between school years 2023-24 and 2026-27.1
In total, spending on elementary and secondary education will hit a record $85 billion, or $35,095 per pupil, for the 2023-24 school year. New York’s spending per pupil now is approximately double the national average, as it was three years ago based on the latest national data. Still, New York’s outcomes do not appear to reflect its high investment; it still can and should do more to ensure that the massive annual school aid increases lead to sustained improvements in educational outcomes.
Furthermore, even amid significant State fiscal problems, New York State continues to increase aid to wealthy school districts, with $2.8 billion now directed to districts that are able to provide a Sound Basic Education (SBE) with local resources and regular federal aid.2 The State should reduce or reallocate this aid to help stabilize the State’s ongoing finances and better target aid to high-need districts
Specifically, CBC’s analysis found that:
- State school aid increases 8.8 percent this year to $37.4 billion;
- Per-pupil State aid increases 10.2 percent to $15,289;
- Total spending increases 2.4 percent to $85.8 billion, but growth would be 4.1 percent if not for the decline in extraordinary federal pandemic aid;
- Total spending per pupil increases 3.7 percent to $35,095;
- The State is providing $2.8 billion to 152 school districts that fully fund an SBE with local and regular federal resources;
- Another $8.6 billion is provided to other districts, providing funding that exceeds what is needed to fund an SBE (for a statewide total of $11.4 billion); and
- Only five districts statewide lack adequate resources to provide an SBE, with a $9.6 million shortfall.
STATE SCHOOL AID INCREASES 8.8 PERCENT TO $37.4 BILLION
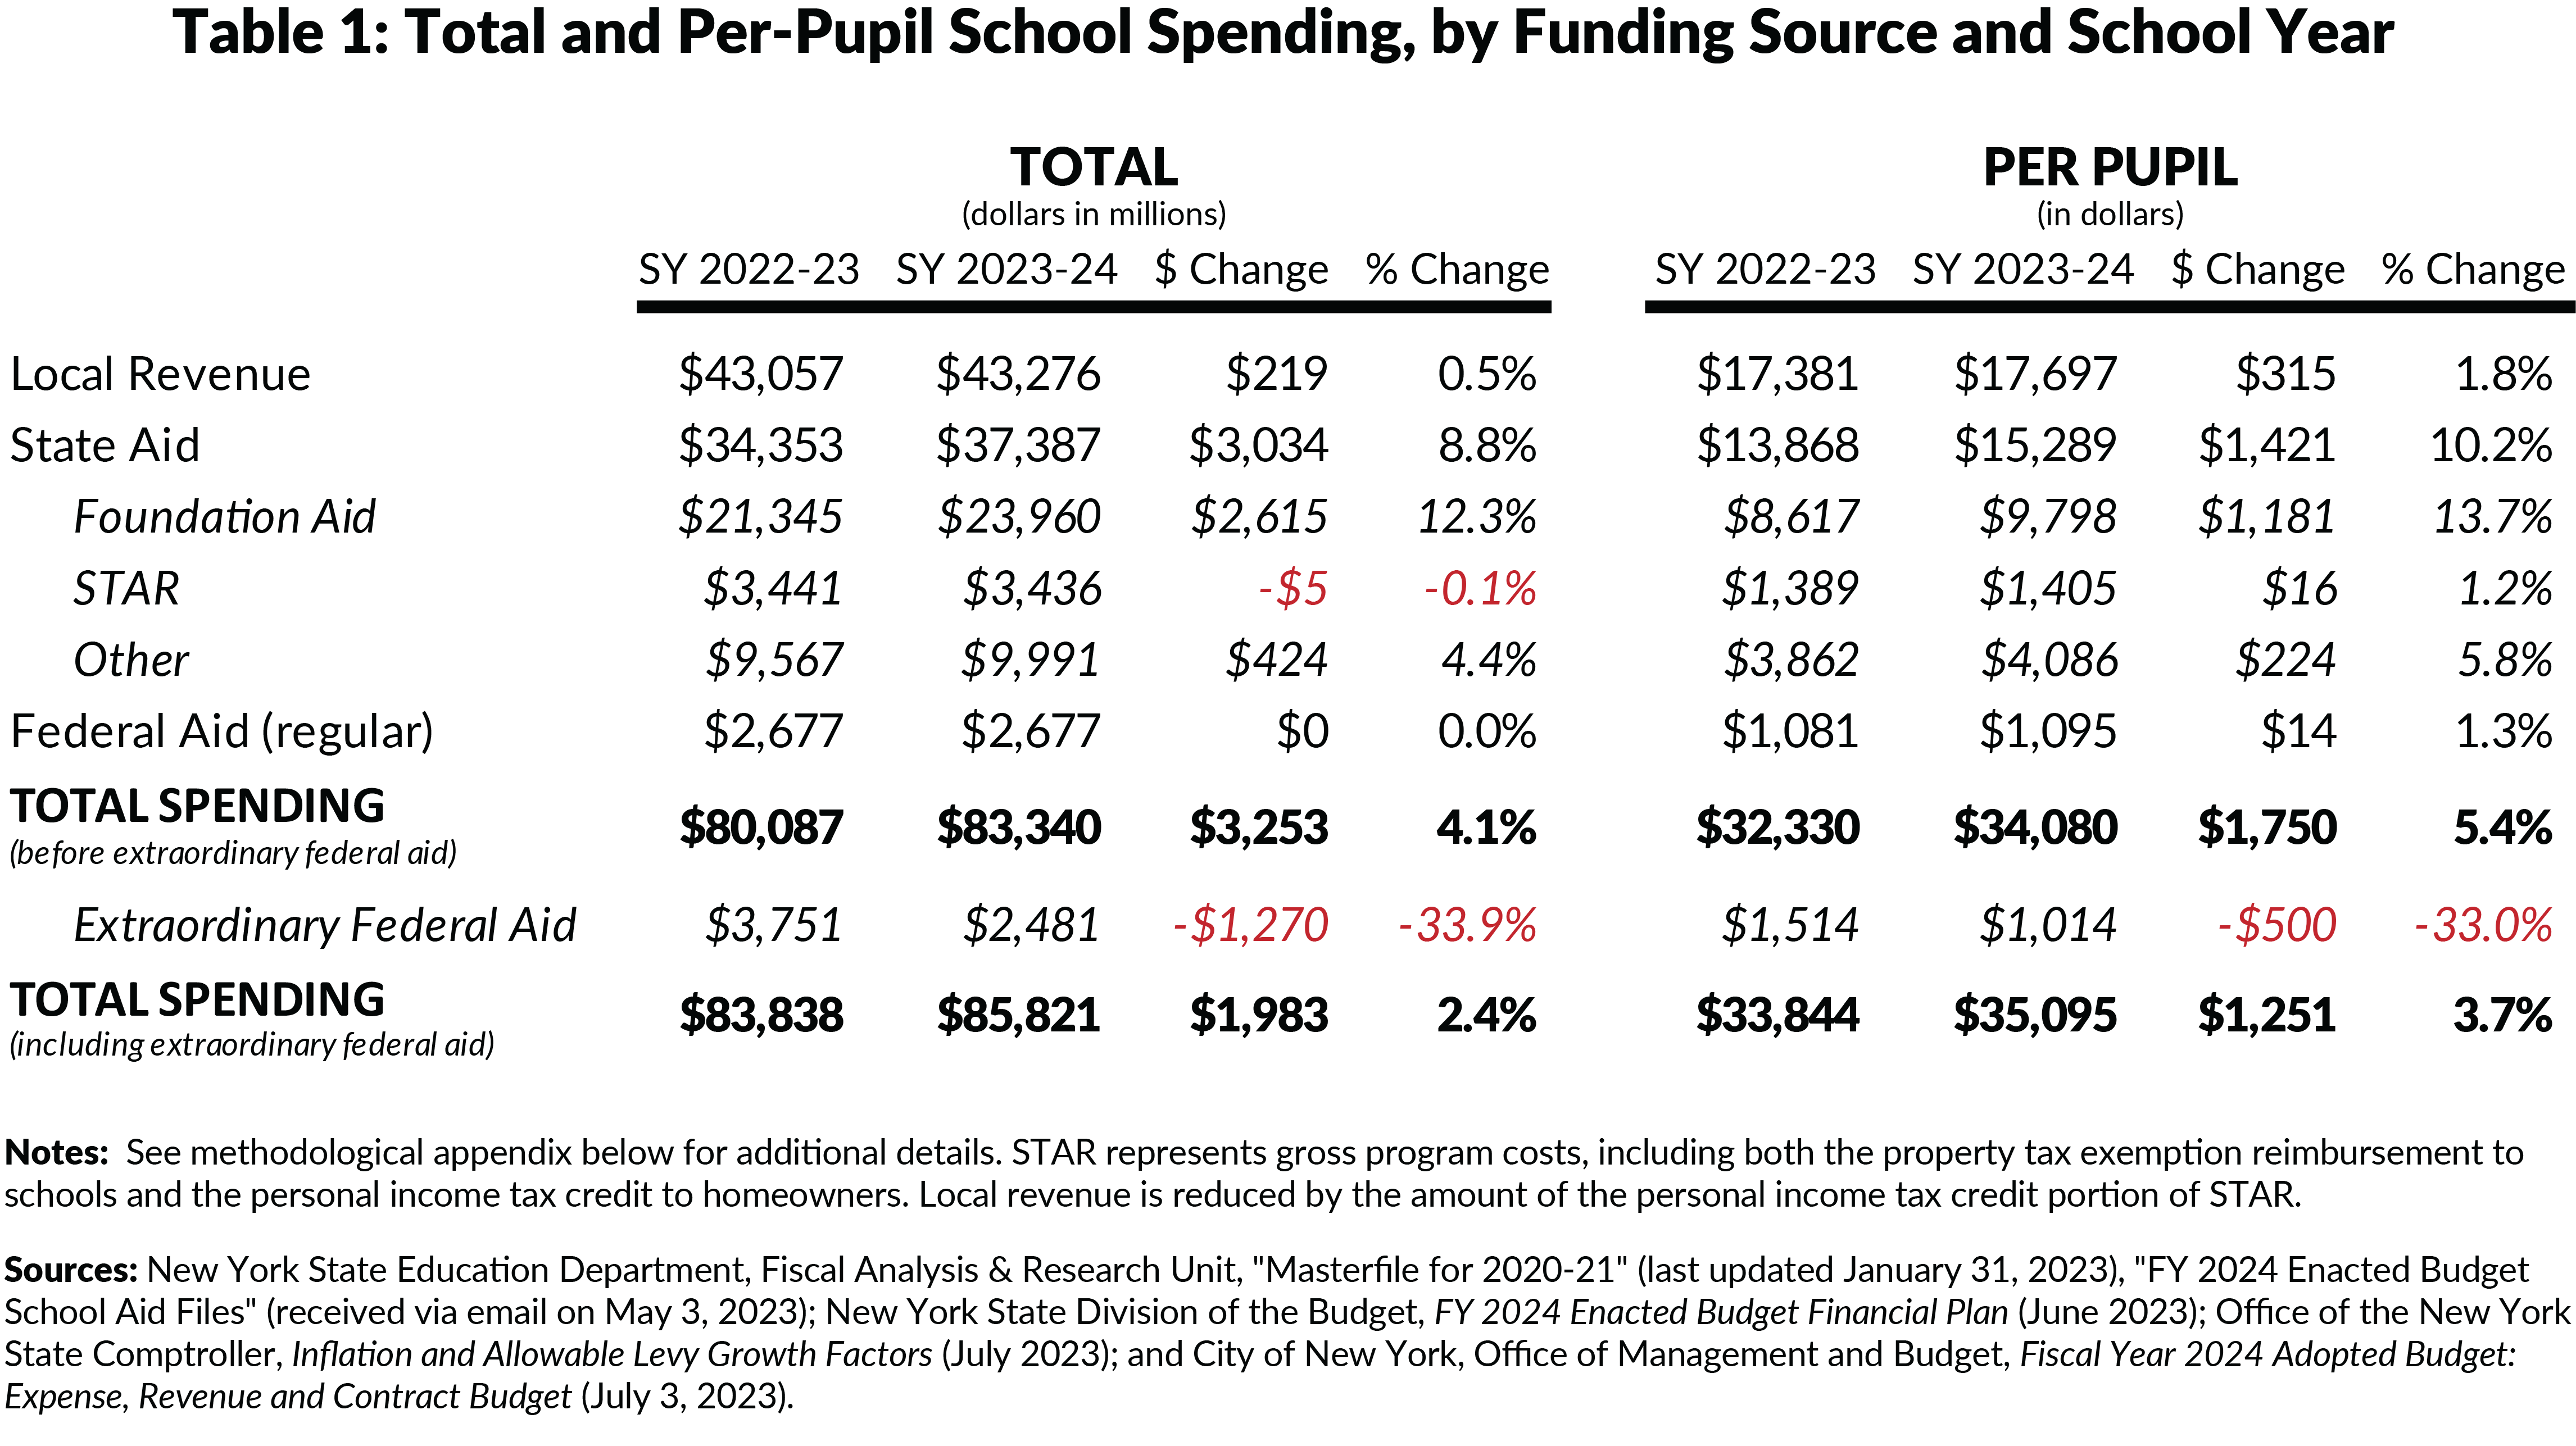
In the 2023-24 school year, New York State school aid increases $3.0 billion, or 8.8 percent, outpacing the total State Operating Funds budget growth of 1.2 percent for the fiscal year 2024.3 (See Table 1.) State school aid growth is largely driven by Foundation Aid, which increased $2.6 billion, substantially larger than last year's increase of $1.5 billion.4
TOTAL SCHOOL SPENDING REACHES $85.8 BILLION, AND $35,095 PER PUPIL
Total school spending including State, federal, and local resources is $85.8 billion in the new school year, a 2.4 percent increase.5 This growth would have been 4.1 percent were it not for the year-to-year decline in resources from the temporary federal Elementary and Secondary School Emergency Relief (ESSER) funds from the Coronavirus Response and Relief Supplemental Appropriations Act (CRRSA) and the American Rescue Plan (ARP).6 Excluding these extraordinary federal pandemic aid resources, school spending totals $83.3 billion for the 2023-24 school year.
The increase in total spending per pupil is 3.7 percent, which is greater than the aggregate spending increases due to declining enrollment. Spending per pupil reaches $35,095.
THREE-YEAR ‘PHASE-IN’ INCREASES FOUNDATION AID BY 30 PERCENT
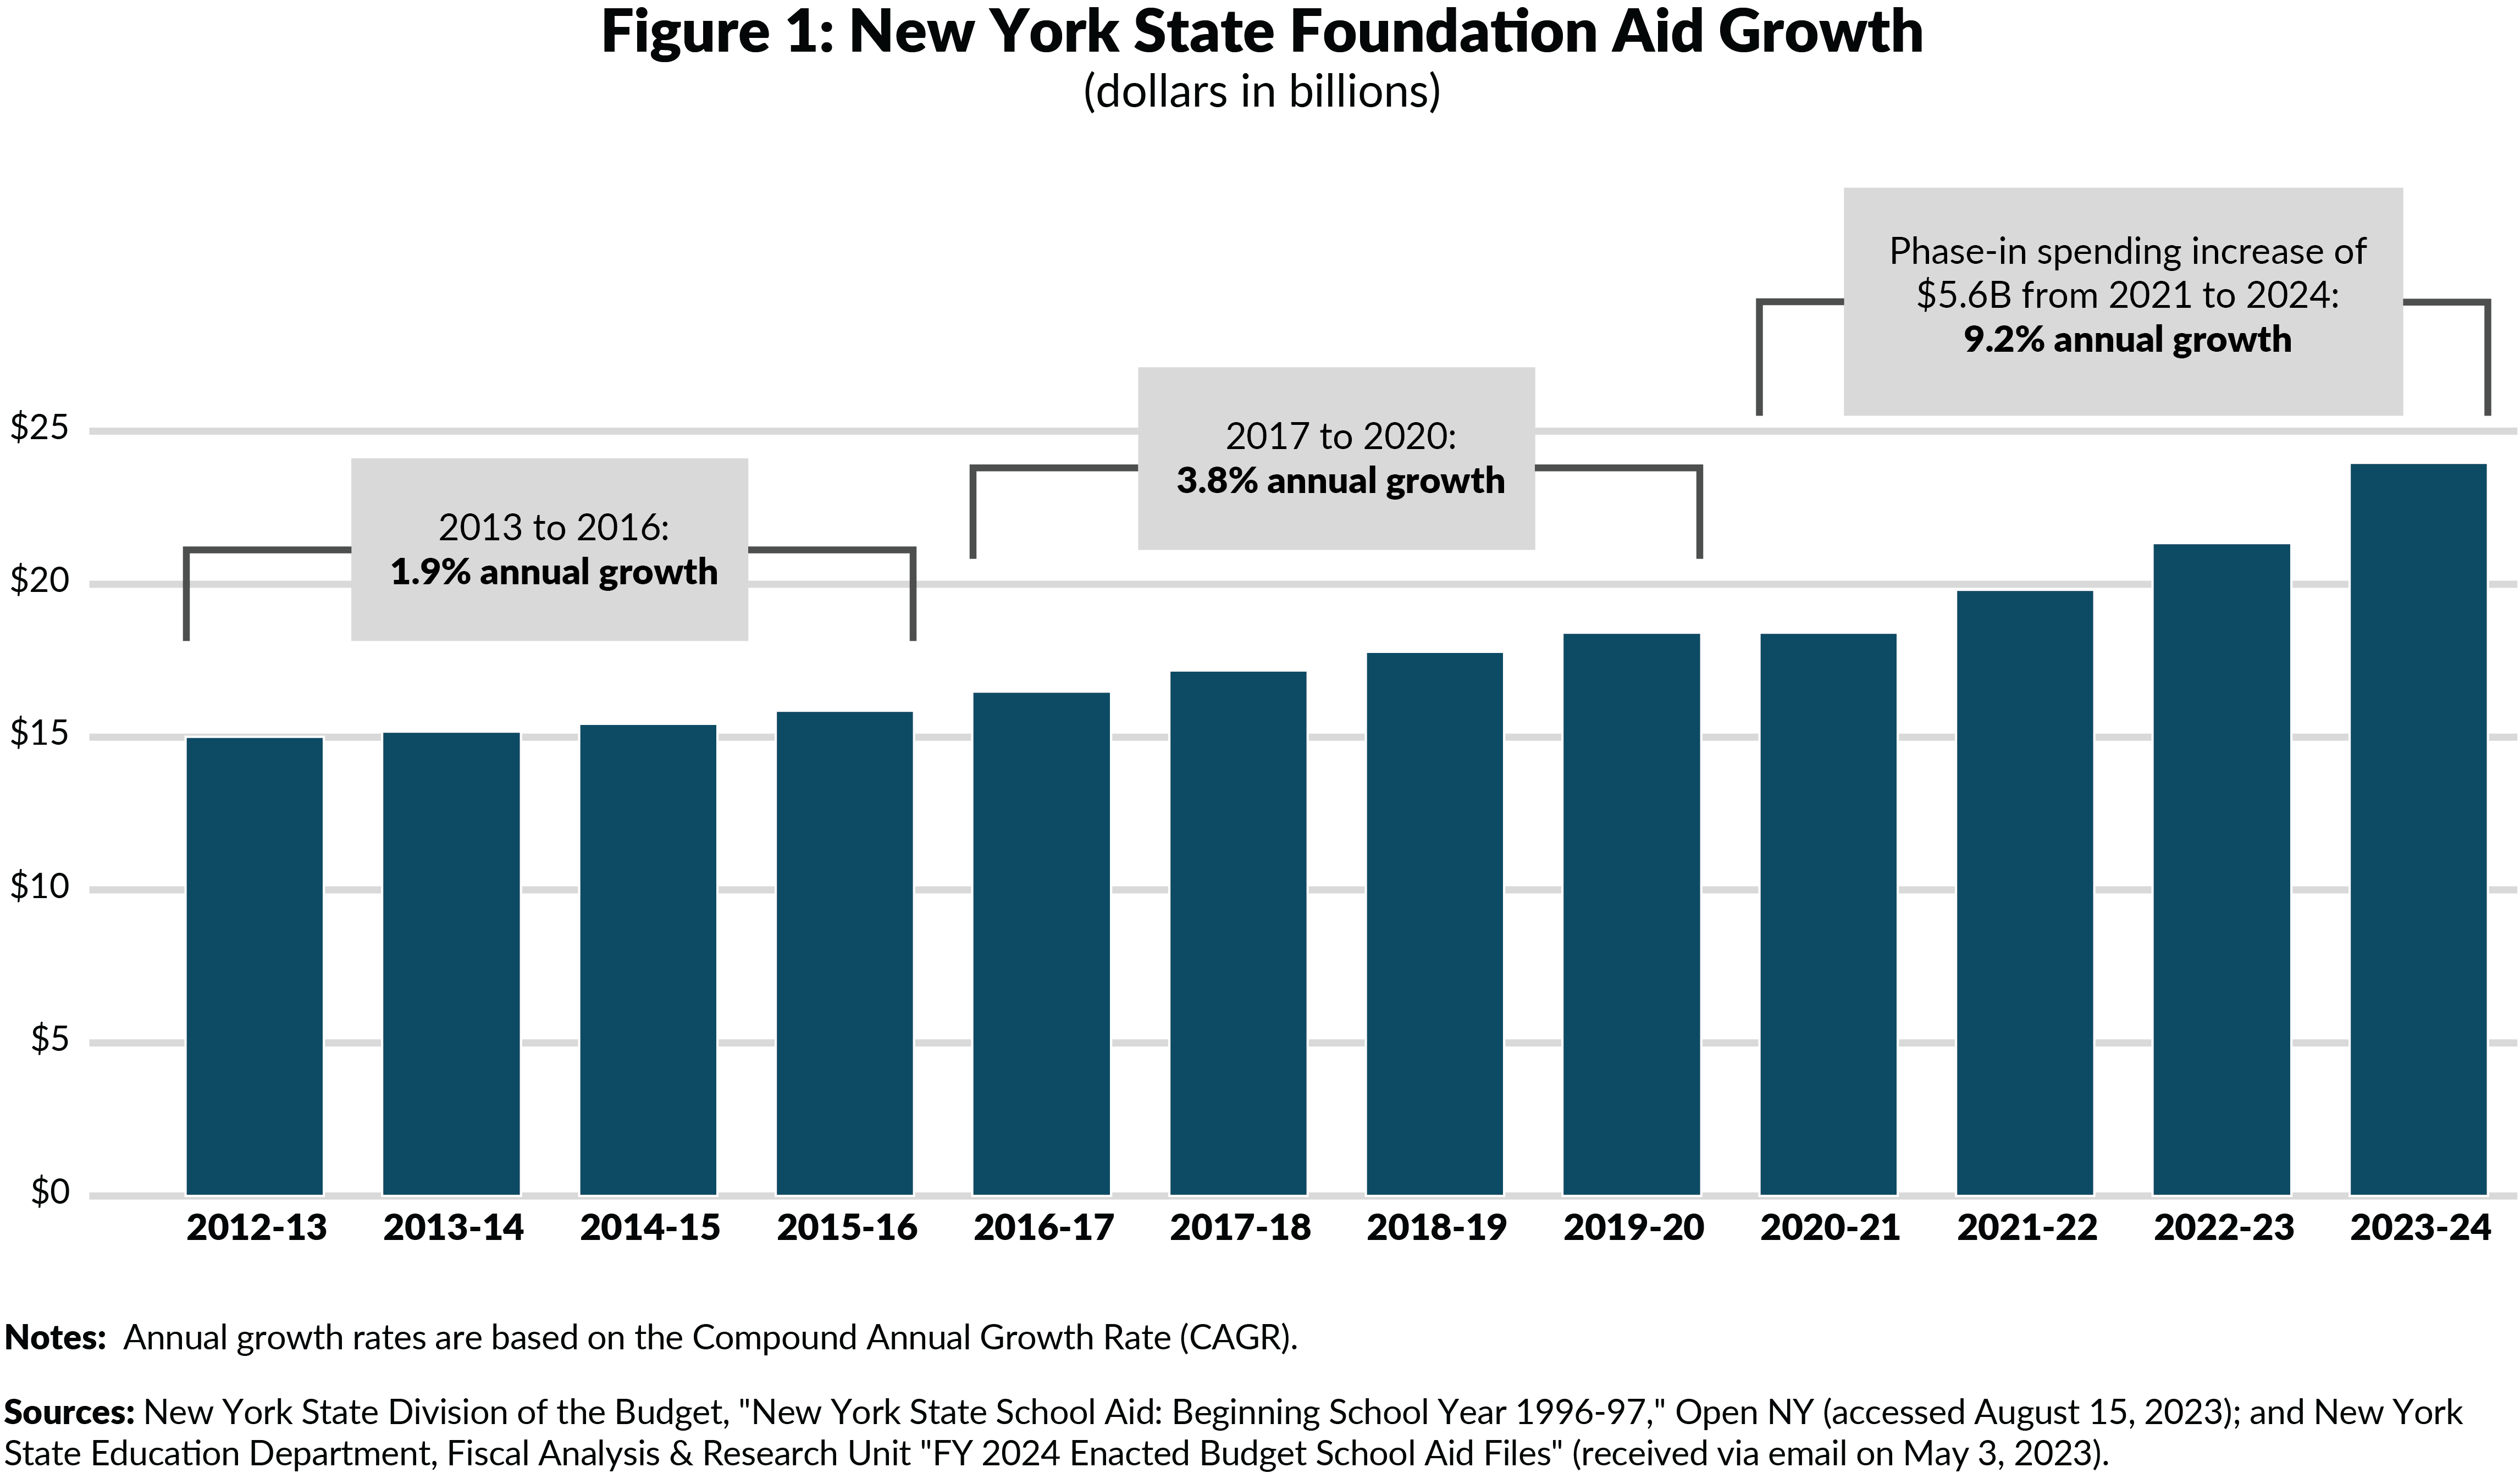
This is the last year of a three-year phase-in of the Foundation Aid formula, which directs roughly 60 percent of State school aid. Foundation Aid increased $1.4 billion in the phase-in’s first year, $1.5 billion in the second, and $2.6 billion in the third—a cumulative three-year increase of $5.6 billion. (See Figure 1.) Over this time, Foundation Aid increased approximately 9.2 percent annually, far exceeding the growth rate from 2013 to 2020.
STATE AID PER PUPIL INCREASES 10.2 PERCENT TO $15,289
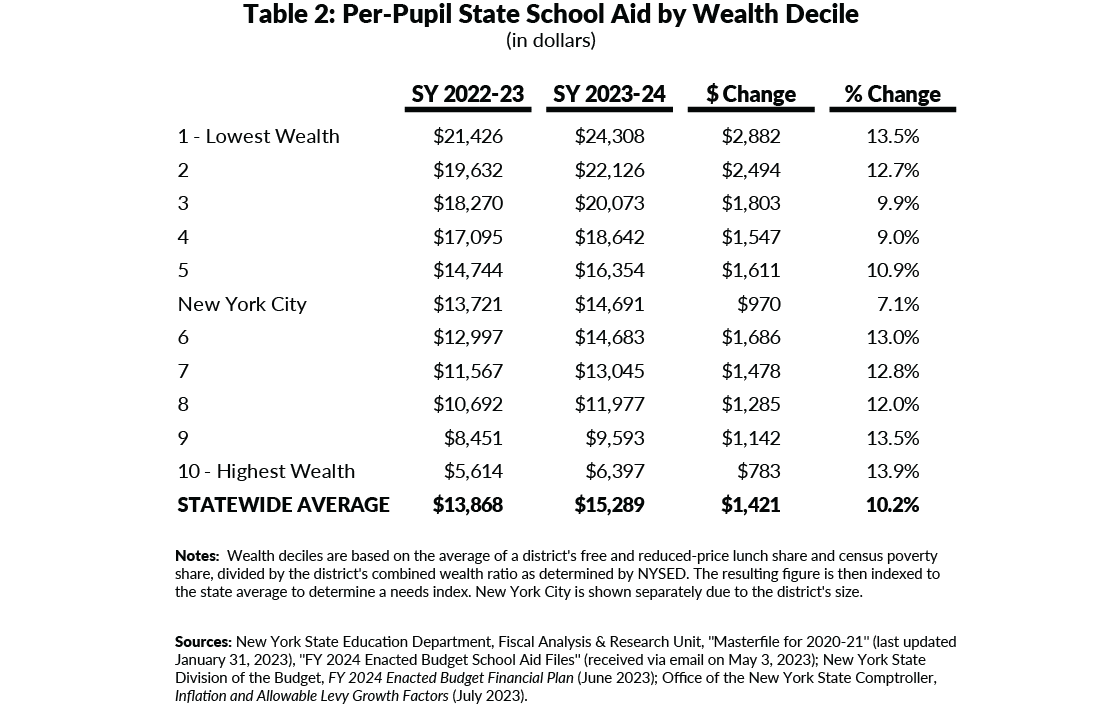
State aid per pupil is increasing 10.2 percent, or by $1,421. (See Table 2.) The growth rate generally is higher for the wealthiest districts. State aid to districts in the highest wealth deciles (9 and 10) increases at least 13.5 percent in the 2023-24 school year. State aid per pupil to the lowest wealth decile also increases 13.5 percent. Conversely, the growth rate is slowest in New York City and the third and fourth wealth deciles, increasing between 7.1 percent and 9.9 percent.
However, lower wealth districts receive more State aid per pupil, so lower growth rates still generate higher per-pupil dollar increases. The State provides an average of $24,308 per pupil for districts in the lowest wealth decile and $6,397 per pupil for districts in the highest wealth decile; the increase per pupil is $2,882 for districts in the lowest wealth decile and $783 in the highest wealth decile.
Notably, five districts in the State still do not have adequate State, federal and local funding to provide an SBE, with a total revenue shortfall of $9.6 million, a marginal amount compared to the $83.3 billion in regular school spending and the $37.4 billion in State Aid. The number of districts with total spending below the SBE level has consistently decreased over time. For example, there were 29 districts underfunded by $83 million in the 2020 school year.7
NEW YORK PROVIDES $2.8 BILLION TO DISTRICTS THAT ALREADY FUND A SOUND BASIC EDUCATION WITH LOCAL AND REGULAR FEDERAL RESOURCES
New York State’s education aid allocation is progressive; per-pupil State aid is higher for lower-wealth districts. However, the school aid formulas still do not sufficiently target State aid based on need. Specifically:
- The Foundation Aid formula, while needs-based, directs significant aid to wealthy districts because:
- Formula-calculated local share contributions are sometimes lower than actual local funds raised, thereby overstating the aid needed by high-wealth districts;
- Hold harmless provisions prohibit decreases in Foundation Aid even if enrollment declines or district wealth increases; and
- Measures of pupil need are outdated, such as poverty level which is drawn from the 2000 Census.8
- Some expense-based aids, such as funding for textbooks and software, are not allocated based on need, but rather on a per-pupil basis, district spending, or other factors.9
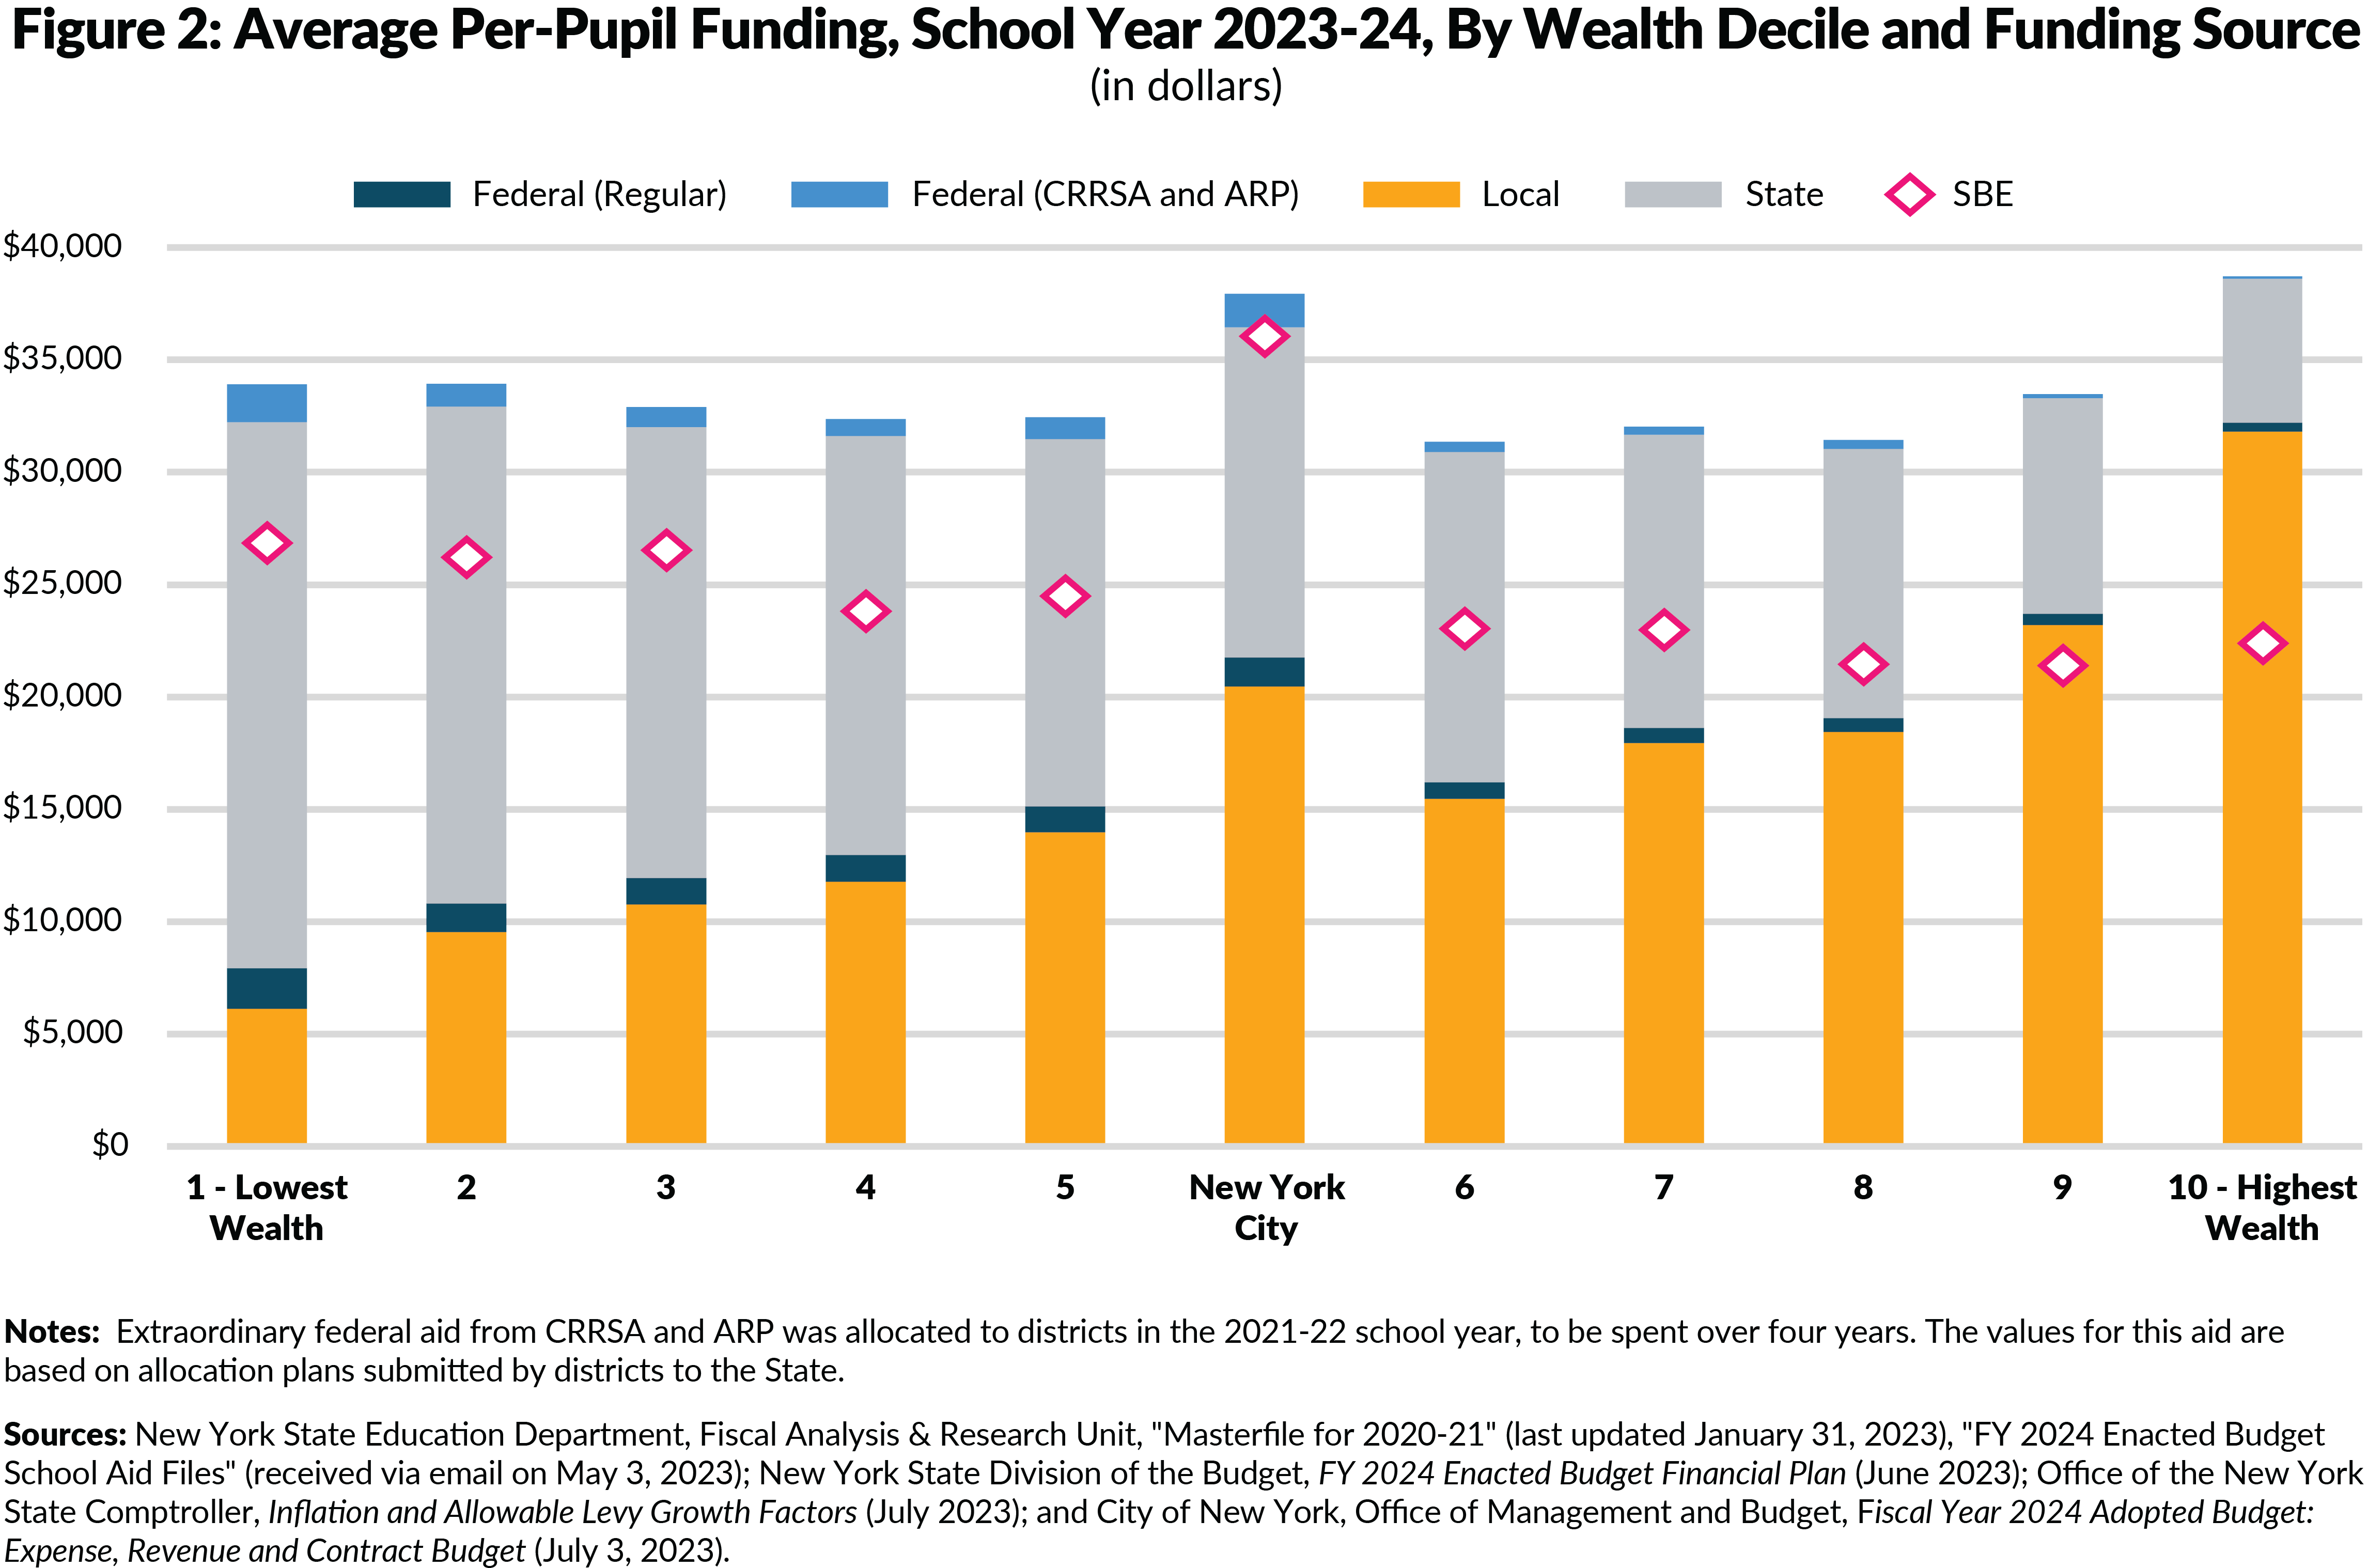
CBC previously found that the Foundation Aid formula and expense-based aid allocations direct billions of dollars to districts with sufficient local revenue and federal aid to provide an SBE.10 This year, 152 such districts will receive a total of $2.8 billion in State aid despite the fact that they self-fund an SBE.
Most of these districts are concentrated in the top wealth deciles: 116 of the 136 districts in the two highest-wealth deciles self-fund an SBE yet still receive $2.1 billion in State aid. In the highest-wealth decile, local resources per pupil average $31,811, just $128 short of the average total revenue per pupil in all other districts outside of New York City. (See Figure 2.) This portion of the State’s aid provides the best opportunities for cost savings going forward by freezing or reducing aids to these districts, including by distributing expense-based aids based on need.
NEW YORK SPENDS NEARLY DOUBLE THE NATIONAL AVERAGE PER PUPIL, AND SPENDING HAS GROWN AT A FASTER RATE
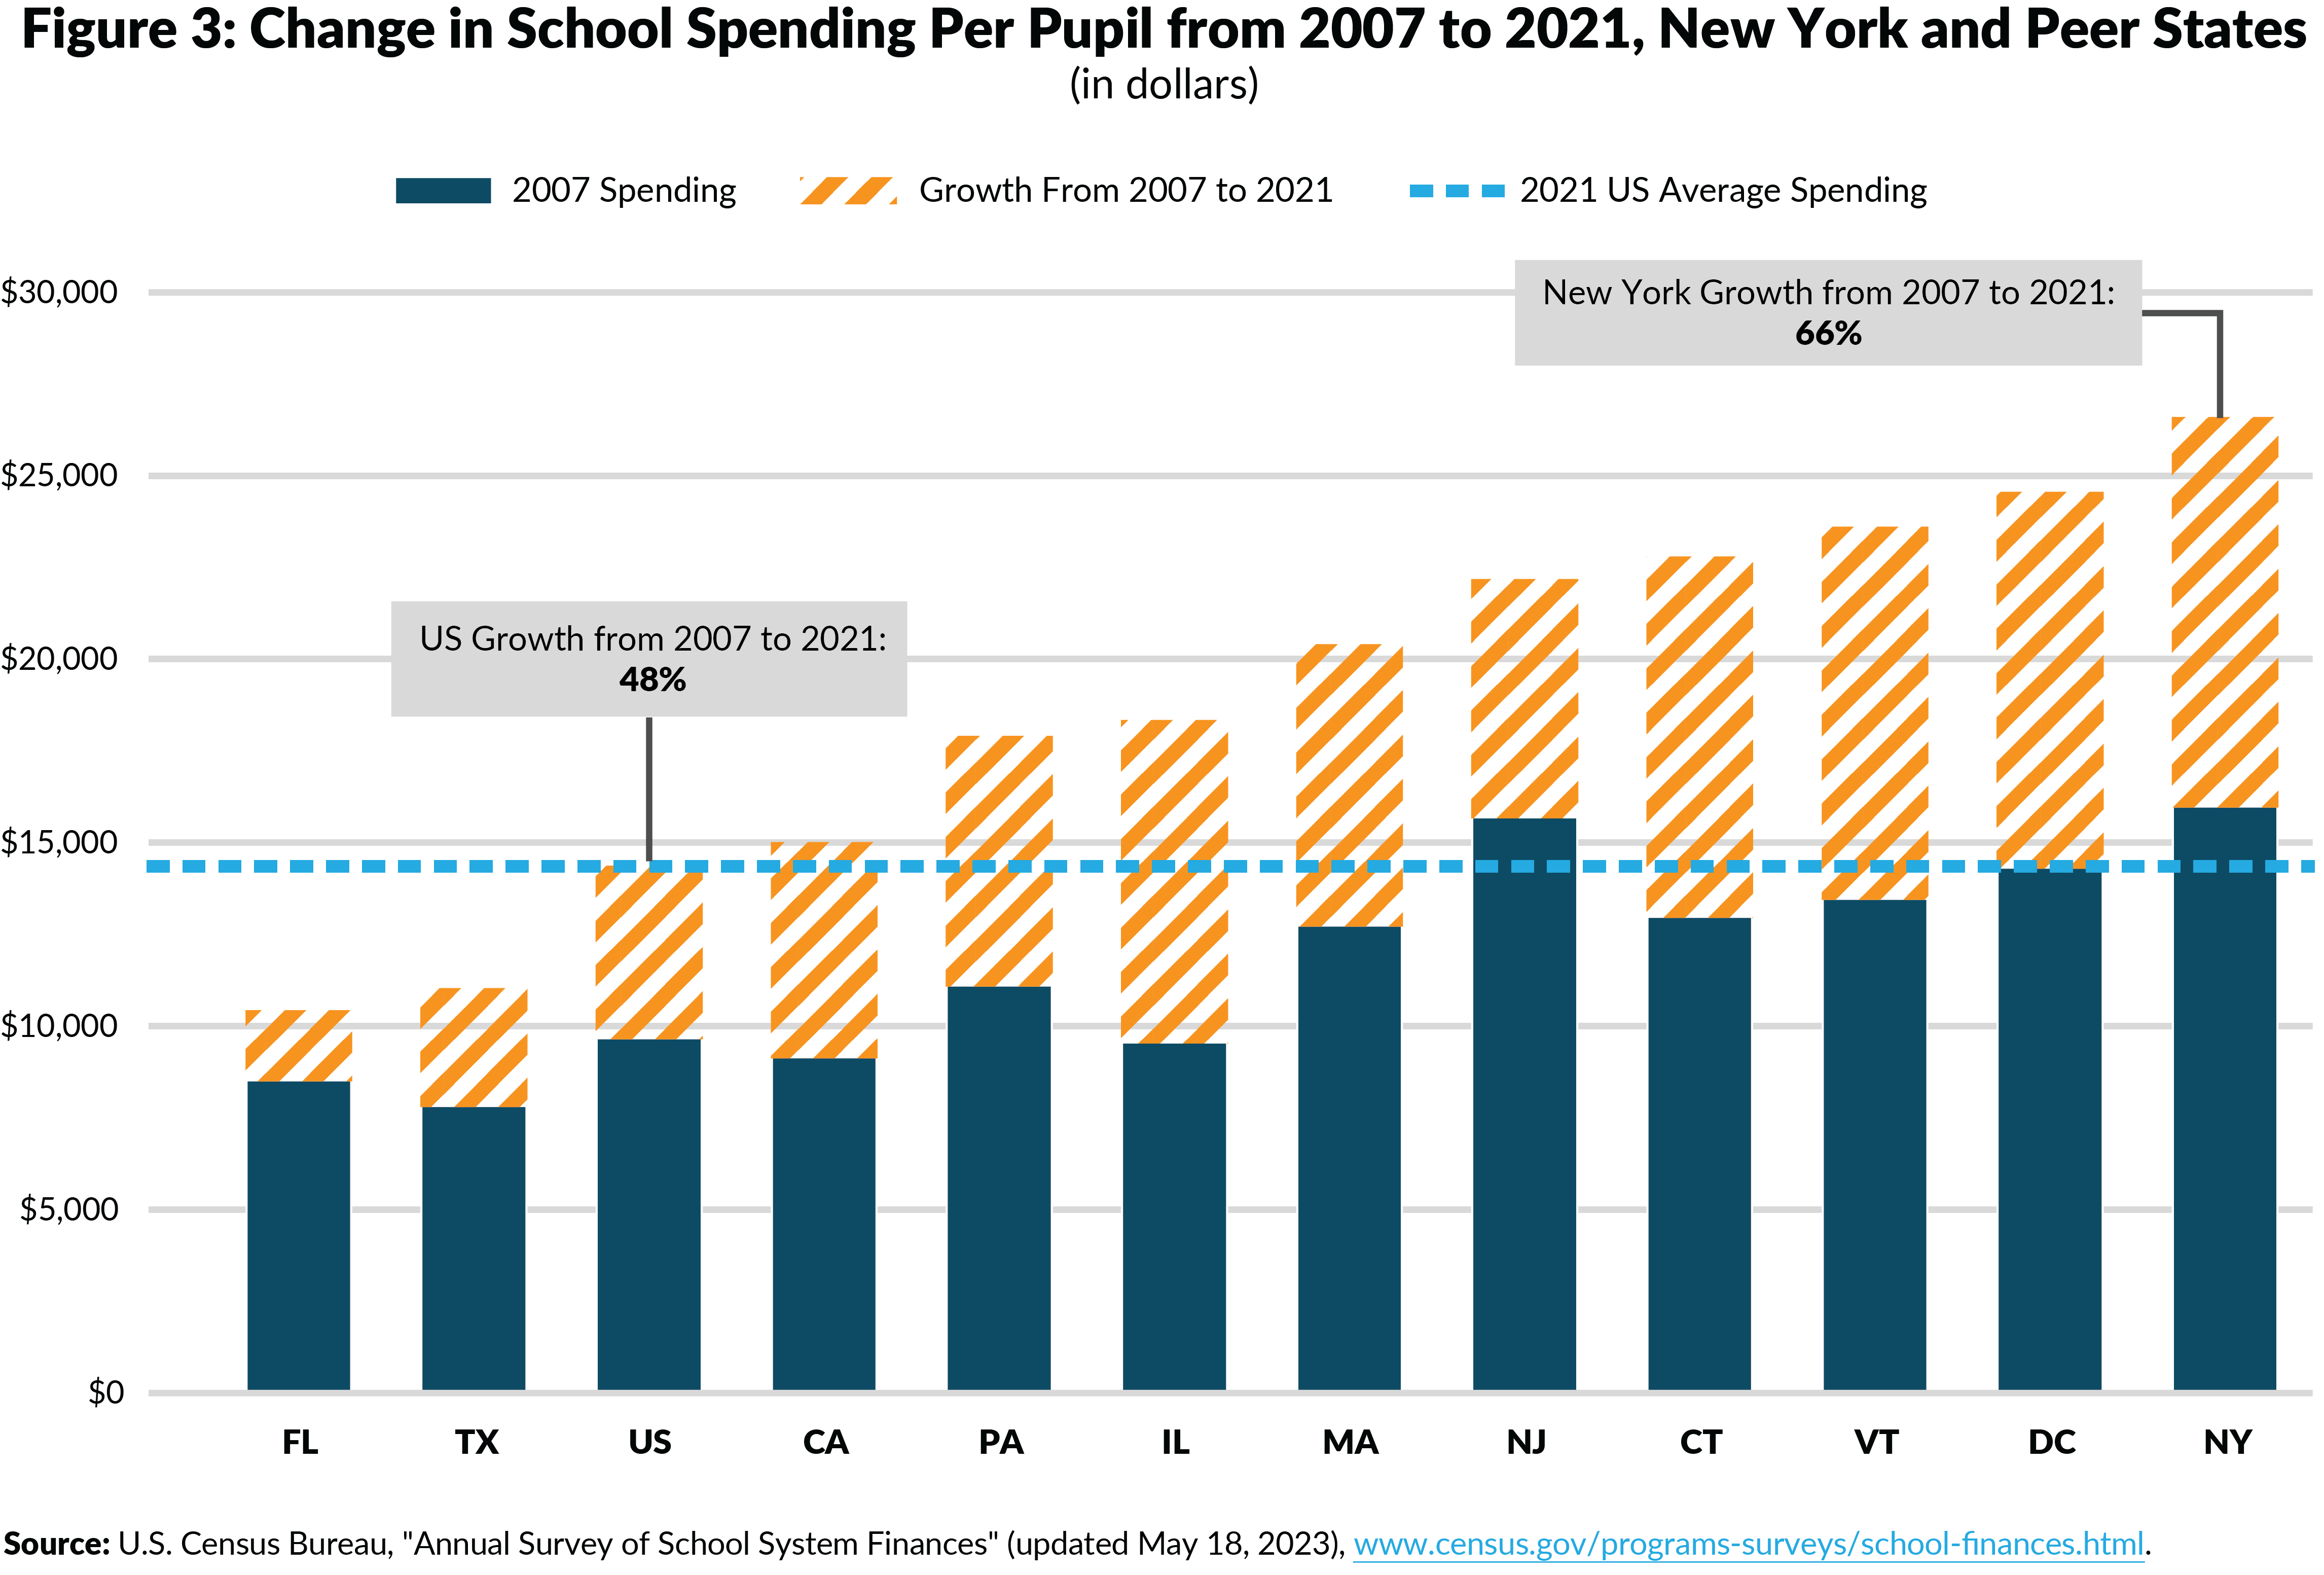
From 2007 to 2021 (the most recent year for which national data are available), school spending per pupil grew by 66 percent in New York, higher than the national 48 percent rate.11 (See Figure 3.) While spending in some similarly populous and neighboring states increased more, per-pupil spending in New York remains the highest. The State exceeds the next highest spender, Washington D.C., by $2,036 and far exceeds its neighbors. Growth in New York has far exceeded that of its neighbors. For example, in 2007 New York’s per-pupil spending exceeded New Jersey’s by $290; by 2021, the difference grew to $4,411. Over the same period, the differences with Massachusetts grew from $3,243 to $6,196, and with Pennsylvania from $4,883 to $8,687.
IMPROVED EDUCATIONAL OUTCOMES, NARROWED DISPARITIES, AND MORE ACCOUNTABILITY SHOULD ACCOMPANY INCREASED RESOURCES
The significant infusion of State funds combined with billions of dollars in extraordinary federal pandemic aid should deliver improved outcomes—accelerated achievement, narrowed disparities, and reversed pandemic-caused educational and social and emotional learning loss. Supporting these improvements and assessing whether this spending has delivered results is critical.
New York’s higher and faster growing spending does not appear to be delivering commensurate results. Based on the National Assessment of Educational progress (NAEP), from 2007 to 2022 New York’s average reading and math scores of 8th graders decreased approximately the same amount as national averages. Average reading and math scores for New York’s 4th graders decreased more than the national average. The share of students scoring at the “basic” proficiency achievement level or better dropped for 4th and 8th graders in reading and math in both New York and national averages.12
The impact of the extraordinary federal pandemic aids also remains unclear.13 In the largest program, ESSER, New York received $11.4 billion, with $7.0 billion going to New York City. However, reporting on planned spending was limited to PDFs with high-level aggregation, and reporting on the assessed impacts of the spending on addressing pandemic learning and social impacts is absent.
Given the importance of educating New York’s youth and the significant expenditure, the State should have a comprehensive performance management system for school districts that uses robust metrics to track activities and results, identifies and spreads best practices, and appropriately holds districts accountable. This means not only tracking performance, but utilizing the analysis of performance to inform improvements in management, program, and future funding decisions. A well-designed system would not only measure inputs and processes, such as the amount spent, but also measure outcomes, quality, and efficiency. It also would have a process to review these measures, work with districts on corrective action plans and improvements where needed, and hold districts accountable for meeting standardized goals.14
The State is currently implementing an accountability system as required by the federal Every Student Succeeds Act (ESSA) of 2015. ESSA requires states to develop accountability plans to drive continuous improvement. However, ESSA’s provisions took years to implement and have been disrupted by initial implementation timelines, regulatory reversals under the prior federal administration, and the pandemic.15 Furthermore, the State does not have a system of analyzing the use of extraordinary federal pandemic funding, nor is there any apparent link to using the results of district-level and Statewide performance data to inform a revised approach to State policymaking and budgeting of school aid. Still, ESSA’s requirements can be the foundation upon which the State builds a robust system as recommended above. Doing so would increase the likelihood that New York’s significant spending on education produces commensurate results.
CONCLUSION
School districts in New York State will spend $85.8 billion—$35,095 per pupil—this year. New York continues to inadequately target its school aid; $2.8 billion in State aid is allocated to districts that fund a sound basic education with local and federal resources alone. Additionally, State aid continues to climb even as significant budget gaps are projected beginning next year; gaps of $9 billion to $14 billion annually over the life of the financial plan, likely growing to $22 billion by fiscal year 2028.16 To balance the budget, the State should rein-in spending growth; poorly targeted school aid is a reasonable option for spending control.
As New York leads the nation in per-student spending, it should also aim to lead the nation in educational outcomes. However, inadequate performance monitoring, improvement, and management systems do not track whether fiscal outlays are driving educational outcomes. As students, teachers, and staff head back to school, it is clear that New York’s aid allocations, performance, and programming should be prioritized for proactive improvement.
Download Report
NYS School Aid Continues to Rise in the 2023-24 School YearSchool Aid by District: SY 2023-24
Technical Appendix
District Omissions: Ten districts are excluded from the map view. Eight of these districts are ineligible for most State aid because they employ fewer than eight teachers. Four of these districts (South Mountain, Piseco Common, Raquette Lake, and Inlet Common) contract with neighboring districts for educational services, while the other four districts (North Greenbush Common, Wainscott Common, Sagaponack Common, and New Suffolk Common) operate only elementary schools with low enrollment, while contracting with neighboring districts for students in higher grades. Two additional districts (Laurens and Montauk) are excluded because data were not included in the Enacted Budget school aid runs for the upcoming school year due to possible inconsistencies.
Spending Calculations and Estimates: Spending figures contain estimated funding for the 2023-24 school year by district calculated as follows:
Federal: Regular federal aid is equal to actual federal aid from the 2020-21 Masterfiles. Extraordinary federal aid from COVID relief bills is not included in this analysis.
State: Includes all aid included in the 2023-24 school aid runs plus estimated School Tax Relief (STAR) gross program costs within the district (based on total planned STAR costs for school year 2023-24 proportional to actual STAR costs in 2020-21).
Local: Local funding is estimated based on actual local revenue from the 2020-21 Masterfiles increased by the allowable tax levy growth factor in each subsequent year, and reduced by the personal income tax credit portion of STAR. This approach varies from prior CBC school aid analyses that did not net out the personal income tax credit portion of STAR.
Sound Basic Education (SBE): Each district’s SBE amount is calculated by CBC by adding the “foundation amount” reported in school aid runs plus other expense-based aid for transportation, construction, and other costs for school year 2020-21 from Masterfiles inflated by CPI factors reported by the Office of the New York State Comptroller.
Wealth Decile Calculations: Wealth deciles are based on the average of a district’s free and reduced-price lunch share and census poverty share, divided by the district’s combined wealth ratio as determined by New York State Education Department (NYSED). The resulting figure is then indexed to the state average to determine a needs index.
Districts with Resources in Excess of SBE: The “State Aid to Districts That Self-Fund a Sound Basic Education (SBE)” map contains data only for the 152 districts where local resources and regular federal aid exceeds the calculated SBE amount. The total amount of State aid directed to these 152 districts is $2.8 billion. The “Per-Pupil State Funding in Excess of SBE Needs” map reflects the difference between each district’s SBE per student and its total spending per student, (up to the district’s State aid subtotal). For five districts, this value is negative, reflecting an SBE shortfall totaling $9.6 million. The total for all other districts’ State aid in excess of an SBE is $11.4 billion (this figure includes the $2.8 billion in State aid allocated to districts that self-fund an SBE.)
Enrollment: Enrollment estimates are based on school year 2023-24 enacted budget school aid runs.
Map Sources
New York State Education Department, Fiscal Analysis & Research Unit, “Masterfile for 2020-21” (last updated January 31, 2023), https://oms32.nysed.gov/faru/Profiles/2020-21_FiscalProfiles.html, “FY 2024 Enacted Budget School Aid Files” (received via email on May 3, 2023); New York State Division of the Budget, FY 2024 Enacted Budget Financial Plan (June 2023), www.budget.ny.gov/pubs/archive/fy24/en/fy24en-fp.pdf; Office of the New York State Comptroller, Inflation and Allowable Levy Growth Factors (July 2023), www.osc.state.ny.us/files/local-government/property-tax-cap/pdf/inflation-and-allowable-levy-growth-factors.pdf; and City of New York, Office of Management and Budget, Fiscal Year 2024 Adopted Budget: Expense, Revenue, and Contract Budget (July 3, 2023), https://www.nyc.gov/assets/omb/downloads/pdf/erc6-23.pdf.
Footnotes
- New York State Division of the Budget, FY 2024 Enacted Budget Financial Plan (June 2023), pp. 91 to 93, www.budget.ny.gov/pubs/archive/fy24/en/fy24en-fp.pdf.
- New York State’s constitution guarantees every student the right to a sound basic education. While a large portion of school aid is distributed primarily based on districts’ needs, including their wealth and students’ pedagogical needs, the State generally provides funds and funding increases annually to all districts, including those with significant local resources.
- New York State Division of the Budget, FY 2024 Enacted Budget Financial Plan (June 2023), www.budget.ny.gov/pubs/archive/fy24/en/fy24en-fp.pdf.
- Patrick Orecki, More Money, Little Accountability: New York Continues to Increase State School Aid (Citizens Budget Commission, October 03, 2022), https://cbcny.org/research/more-money-little-accountability.
- Local revenues are based the most recent year of available (school year 2020-21) and further inflated by the allowable tax levy growth factor (up to 2% annually), for all districts outside of New York City. New York City figures are based on the Fiscal Year 2024 Adopted Budget.
- CRRSA funds were appropriated in the 2021-22 enacted state budget and must be spent between March 13, 2020-September 30, 2023. For ARP, the funds must be spent between March 2021 and September 30, 2024. ARP values are based on data submitted by districts to the State. CRRSA values are proportional to New York City’s actual and planned disbursements.
- David Friedfel, “Adopted Budget Continues Unequal Access to a Sound Basic Education” Citizens Budget Commission Blog (May 22, 2019), https://cbcny.org/research/adopted-budget-continues-unequal-access-sound-basic-education.
- David Friedfel, A Better Foundation Aid Formula (Citizens Budget Commission, December 12, 2016), https://cbcny.org/research/better-foundation-aid-formula.
- Testimony of David Friedfel, Director of State Studies, Citizens Budget Commission, submitted to the New York State Senate Committees on Education, and Budget and Revenue, Testimony on the Distribution of the Foundation Aid Formula as it Relates to Pupil and District Needs (December 3, 2019), https://cbcny.org/advocacy/testimony-distribution-foundation-aid-formula-it-relates-pupil-and-district-needs.
- David Friedfel, A Better Foundation Aid Formula (Citizens Budget Commission, December 12, 2016), https://cbcny.org/research/better-foundation-aid-formula; and Testimony of David Friedfel, Director of State Studies, Citizens Budget Commission, submitted to the New York State Senate Committees on Education, and Budget and Revenue, Testimony on the Distribution of the Foundation Aid Formula as it Relates to Pupil and District Needs (December 3, 2019), https://cbcny.org/advocacy/testimony-distribution-foundation-aid-formula-it-relates-pupil-and-district-needs.
- U.S. Census Bureau, "Annual Survey of School System Finances" (updated May 18, 2023), www.census.gov/data/tables/2021/econ/school-finances/secondary-education-finance.html.
- Based on National Assessment of Educational progress (NAEP) data for 2007 and 2022. New York 4th grade reading scores decreased from 224 to 214 versus national average from 220 to 216. New York 8th grade reading scores decreased from 264 to 262 versus national average from 261 to 259. New York 4th grade math scores decreased from 243 to 227 versus national average from 239 to 235. New York 8th grade math scores decreased from 280 to 274 versus national average from 280 to 273. See U.S. Department of Education National Center for Education Statistics, “National Assessment of Educational Progress” (accessed August 7, 2023), https://nces.ed.gov/nationsreportcard/.
- Testimony of Patrick Orecki, Director of State Studies, Citizens Budget Commission, submitted to the New York State Senate Committees on Education, New York City Education, and Budget and Revenue, Testimony on New School Aid Spending and Performance (October 5, 2021), https://cbcny.org/advocacy/testimony-new-school-aid-spending-and-performance.
- See U.S. Department of Education “Every Student Succeeds Act (ESSA)” (accessed August 24, 2023), www.ed.gov/essa; and New York State Education Department, Understanding the New York State Accountability System under the Every Student Succeeds Act (ESSA) for 2022–2023 Accountability Statuses Based on 2021–2022 Results, p. 2, (March 2023), www.nysed.gov/sites/default/files/programs/accountability/22-23-sy-haw-final_0.pdf.
- Alyson Klein, “Trump Education Dept. Releases New ESSA Guidelines” (EducationWeek, March 13, 2017), www.edweek.org/policy-politics/trump-education-dept-releases-new-essa-guidelines/2017/03.
- Citizens Budget Commission, Briefing on the New York State and New York City Fiscal Year 2024 Budgets (August 4, 2023), https://cbcny.org/media/briefing-new-york-state-and-new-york-city-fiscal-year-2024-budgets.