Mapping the Mayor's Housing Plan
An Update
Following the release of data on fiscal year 2017 fourth quarter housing starts, the Citizens Budget Commission (CBC) has updated its map of housing developments created or preserved under New York City’s Housing New York Plan to include all projects that have closed through the end of the fiscal year.
According to the Department of Housing Preservation and Development, the City financed 13,490 affordable housing units between April and June 2017, including the preservation of 9,966 existing units and the creation of 3,524 new units. This activity brought the number of affordable housing units built or preserved during fiscal year 2017 to 24,293. In total, the City has financed 77,651 units since Mayor Bill de Blasio took office in January 2014.[1]
The final quarter of the fiscal year is typically the most active period for the City’s housing agencies. In 2017, more than 50 percent of Housing New York projects closed in the fourth quarter. Six large preservation deals accounted for a plurality of the fourth quarter unit count:
- Four Mitchell-Lama complexes:
- Penn South in Manhattan (2,189 units);
- Big Six Towers in Queens (978 units);
- Stevenson Commons in the Bronx (948 units); and
- Michelangelo Apartments in the Bronx (492 units).
- Two multibuilding affordable housing portfolios in Brooklyn:
- Brooklyn Ecumenical Co-op portfolio in Fort Greene, Crown Heights, and Bedford-Stuyvesant (550 units); and
- Neighborhood Stabilization Association portfolio in Sunset Park (408 units).
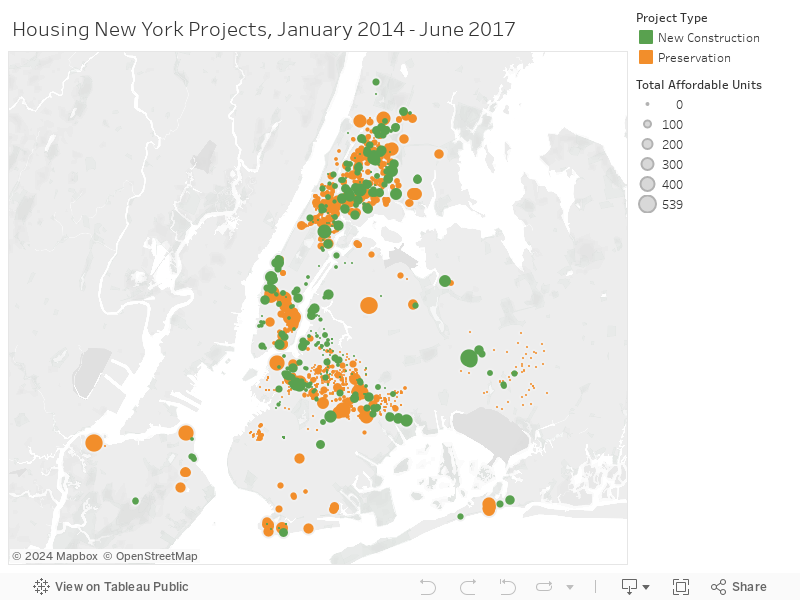
To reflect these additions, CBC has updated its map of projects financed through the Mayor’s housing plan to include all units built or preserved in fiscal year 2017.
The map in Figure 1 shows each building financed through the Housing New York plan. The scale of each dot represents the number of affordable units preserved or constructed in each housing development, and the dots are colored to indicate whether the development is new construction (green) or preservation (orange). Affordable housing projects classified as confidential, meaning they provide assistance to individual homeowners or housing for domestic violence survivors, are not shown on this map. Clicking on a dot allows the user to see additional information about the project, including the number of units by affordability level.
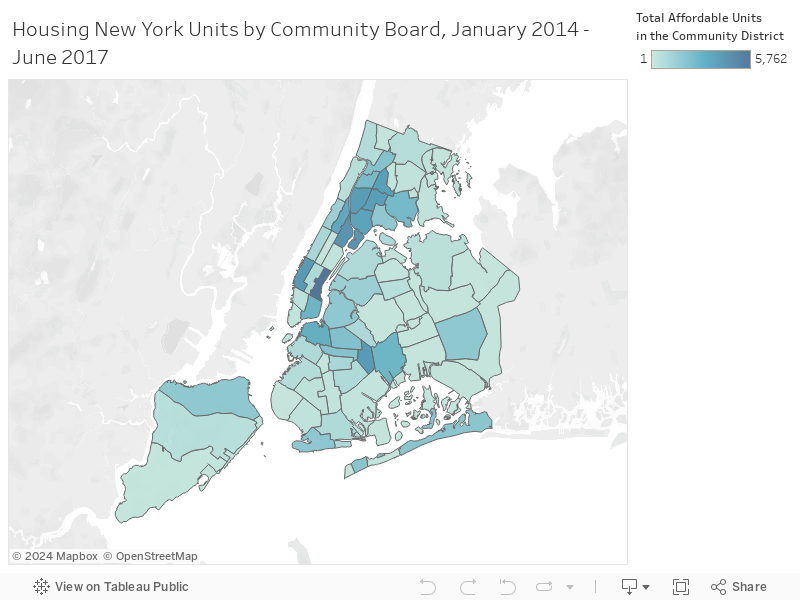
The map in Figure 2 is shaded to show the total number of units built or preserved in each community district, including confidential units not shown on Figure 1. Clicking on each district will show the total number of affordable units by level of affordability, as well as the number of affordable rental and homeownership units.
Footnotes
- NYC OpenData, “Housing New York Units by Building” (accessed September 5, 2017, last updated September 5, 2017), https://data.cityofnewyork.us/Housing-Development/Housing-New-York-Units-by-Building/hg8x-zxpr.