New York City Homeowners
Who's Got the Unfairest Tax Burden of Them All?
One of the basic principles of good tax policy is equity: similarly situated taxpayers should have similarly sized tax bills. New York City’s property tax system does not comport with this principle: owners of one-, two-, and three-family homes are subject to highly disparate effective tax rates due to statutory caps on the growth in the assessed values of their homes. This means that homeowners in areas where property values are growing quickly benefit at the expense of those whose property values are relatively stable. The inequitable tax burdens among small homeowners are some of the most prominent and compelling reasons for reform of the City’s property tax system.
Background
New York City has a classified property tax system, which means that properties are assigned to a class based on size and use, with each class subject to different rules for the calculation of values and tax liabilities. The four tax classes are:
- Class 1: Residential properties up to three units and most condominiums up to three stories;
- Class 2: Residential properties including rental buildings, cooperatives, or condominiums with four or more units;
- Class 3: Utility properties; and
- Class 4: Commercial and industrial properties, such as office and retail buildings.
In fiscal year 2019 the full market value of taxable properties across all tax classes reached $1.25 trillion.1 Class 1 properties account for nearly half (47 percent) of total market value. Class 2 and Class 4 properties each account for roughly one-quarter of total market value, while Class 3 properties account for less than 3 percent. This analysis focuses on Class 1 properties because of their substantial share of citywide market value and the extent of disparities in tax burdens among properties in that class.2

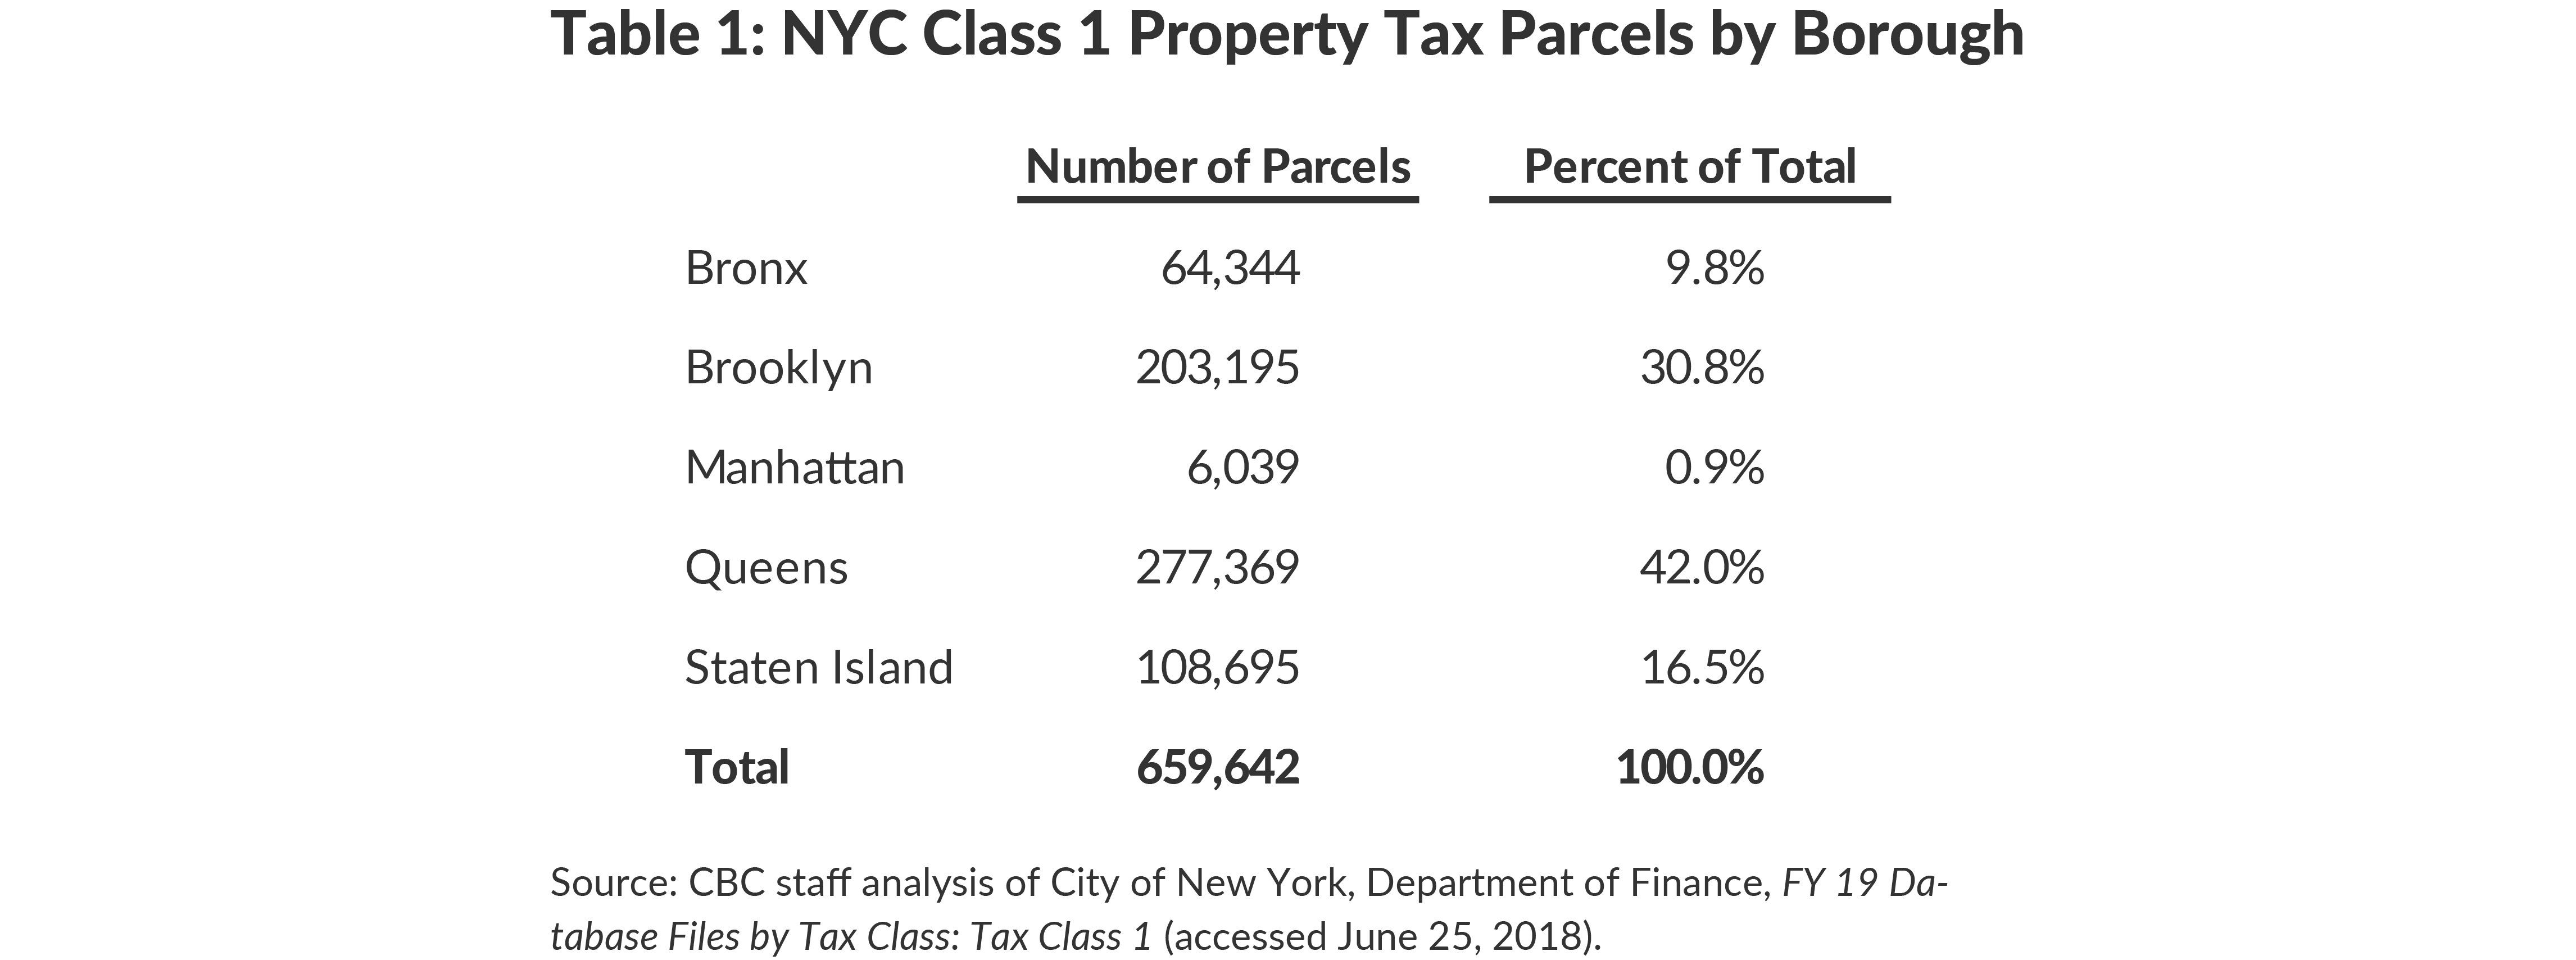
There are approximately 660,000 one-, two-, and three-family homes, with the largest shares located in Queens and Brooklyn (42 percent and 31 percent, respectively), followed by Staten Island (17 percent). Fewer than 10 percent of Class 1 properties are in the Bronx, and the remaining 1 percent of properties, just more than 6,000, is in Manhattan.
Tax Calculation Methodology
How are property tax bills determined? The first step is to determine a property’s market value. The New York City Department of Finance (DOF) methodology varies based on the property’s tax class and requirements in State law. Class 1 market values are statistically modeled using sales prices of comparable properties based on size, location, number of units, and age.
Once the market value of a property is determined, DOF calculates the property’s assessed value by applying a 6 percent assessment ratio for Class 1 properties; however, this ratio may be reduced by statutorily required limits on the increase in a property’s assessed value. To protect taxpayers from spikes in their bills, State law limits the annual increase in assessed values for Class 1 properties to no more than 6 percent and no more than 20 percent over five years.3 As a result many properties, particularly those experiencing rapid appreciation in market value, end up with assessment ratios below 6 percent.
After calculating the property’s assessed value, DOF subtracts any appropriate exemptions to determine the taxable assessed value. DOF calculates a property’s tax bill by multiplying the taxable assessed value by the tax rate for the tax class (21.861 percent in fiscal year 2019 for Class 1 properties). If a property is eligible for an abatement, the value of the abatement is subtracted as the last step.
Each year DOF publishes a property tax roll which reports the City’s valuation of all properties. Citizens Budget Commission (CBC) examined fiscal year 2019 data on Class 1 properties individually and on a neighborhood basis using the Department of City Planning Neighborhood Tabulation Areas (NTAs), which are aggregated census tracts, to calculate and compare effective tax rates.4 The effective tax rate (ETR) (which measures a property tax bill as a percentage of the property’s market value) is the most commonly used metric for comparing tax burdens.5
Borough-Level Trends
Median market values of Class 1 properties are higher than the citywide median in Brooklyn, Manhattan, and Queens, and lower in Staten Island and the Bronx.
Citywide, the median market value of a Class 1 home is $683,000. (See Table 2.) In Brooklyn and Queens, where the majority of Class 1 properties are located, the median market values are above the citywide median ($930,000 and $719,000, respectively). In Manhattan, where just 1 percent of Class 1 properties are located, the median market value of a home climbs to nearly $5.5 million. The median market values of homes in Staten Island and the Bronx are lower than the citywide median at $515,000 and $520,000, respectively.

As Table 2 shows, the greatest spread in market values exists in Manhattan, while market values are least variable in Staten Island and the Bronx. In Manhattan 75 percent of properties have values greater than $2.5 million, with the top 25 percent more than $9.3 million. Brooklyn and Queens market values also vary considerably. In Brooklyn 75 percent of homes are worth more than $643,000, and the top 25 percent are valued at more than $1.3 million. In Queens 75 percent of homes are worth more than $531,000, and the top 25 percent are valued at more than $930,000. The distribution of market values is more compressed in Staten Island and the Bronx; 75 percent of homes are higher than $420,000 and $445,000, respectively, and the top 25 percent of homes are valued more than $638,000 in Staten Island and $608,000 in the Bronx.
Assessment ratios are highest in Staten Island and the Bronx, but just 5 percent of Class 1 properties citywide are assessed at the 6 percent target ratio.
Table 3 presents the distribution of assessment ratios—the assessed value of a property before exemptions as a share of the DOF market value—by borough. The assessment ratios capture the extent to which properties are seeing market value growth in excess of the cap on assessed value growth (6 percent per year, or 20 percent over 5 years). The rate of appreciation and the assessment ratio are negatively related: assessment ratios are higher when property appreciation is slower and lower when appreciation is faster.

Citywide, the median assessment ratio is 4.3 percent (compared to a target ratio of 6 percent). The median assessment ratio is higher than the citywide median in Staten Island (5.2 percent) and the Bronx (5.0 percent), and lower than the citywide median in Brooklyn (3.4 percent) and Manhattan (2.1 percent). The median assessment ratio in Queens (4.3 percent) is equal to the citywide figure. Table 3 shows that the median assessment ratio is higher in boroughs with lower median market values because those areas have generally seen lower annual rates of appreciation.
Table 3 also shows more variation in assessment ratios within Brooklyn than within the other boroughs. In Brooklyn, 75 percent of Class 1 homes have assessment ratios greater than 2.3 percent, while the top 25 percent of homes are assessed at more than 4.3 percent, a difference of 2 percentage points, reflecting high rates of appreciation in some Brooklyn neighborhoods while market values in others grow more slowly.
Caps on assessed value growth benefit properties seeing rapid appreciation and lead to disparate effective tax rates, with the highest burdens in Staten Island and the Bronx.
Table 4 presents borough-level data on Class 1 property tax bills. Citywide, the median Class 1 homeowner will pay roughly $5,822 in property taxes this year. In Brooklyn and Queens, the median homeowner will pay more than the citywide median ($130 more in Brooklyn and $316 more in Queens) while the median homeowner in the Bronx and Staten Island pay less in property taxes than the citywide median ($590 less in the Bronx and $469 less in Staten Island). In Manhattan, where the median market value is 8 times the citywide median, the median tax bill is nearly $26,000—four times the citywide median.

However, the disparities in assessment ratios resulting from caps on assessed value growth benefit properties seeing rapid appreciation and lead to disparities in ETRs. (See Table 5.) Citywide, the median ETR is 0.89 percent.6 Median ETRs in the Bronx and Staten Island are both higher than the citywide median, surpassing 1 percent. In Queens the median ETR is 0.90 percent, roughly the same as the citywide median. In comparison, the median ETRs in Manhattan and Brooklyn are roughly one-half and three-quarters of the citywide median respectively.

Neighborhood-Level Trends
The median market value of Class 1 properties is greater than the citywide median in 56 percent of New York City neighborhoods.
In 106 neighborhoods, or 56 percent of all city neighborhoods included in this analysis, the median market value of a home was higher than the citywide median of $683,000.7 Nearly all of these neighborhoods, 98 percent, were located in Brooklyn, Manhattan, or Queens. By comparison, neighborhoods in the Bronx accounted for less than 2 percent of neighborhoods that ranked greater than the citywide median, and no neighborhoods in Staten Island reported median market values higher than the citywide median.
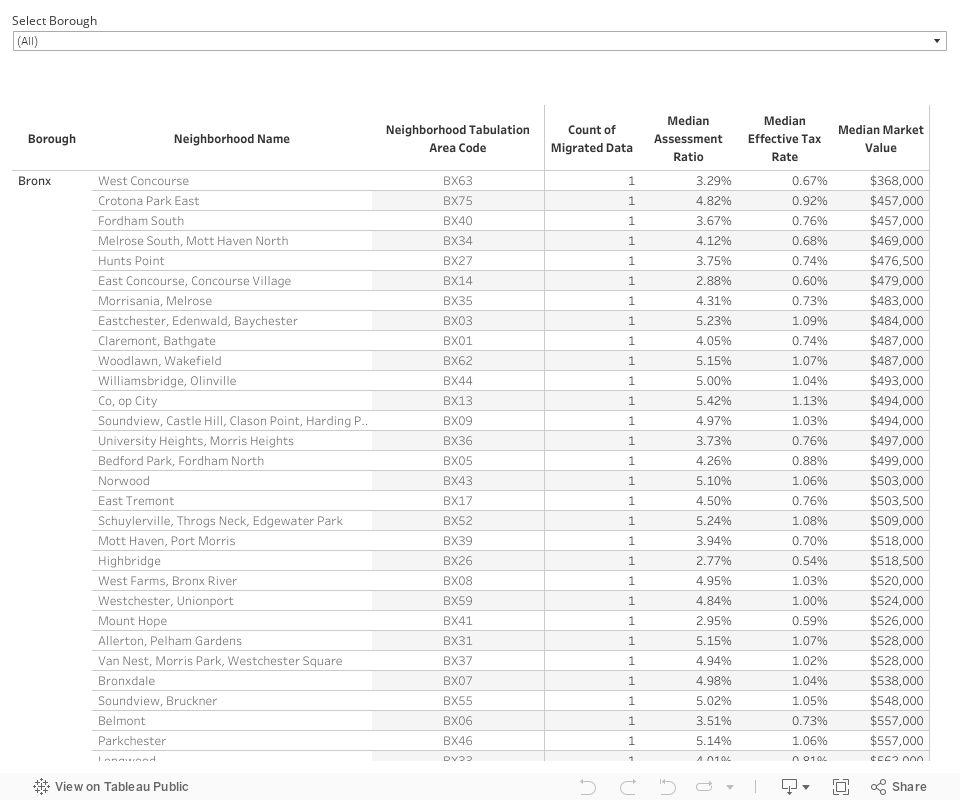
The Appendix provides an interactive list of New York City neighborhoods along with data on median market value, assessment ratio, and ETR.
Neighborhoods where market values surpassed $1.3 million are primarily in northern Brooklyn and Manhattan.
Figure 2 presents the median market value of Class 1 properties by quintile, with each color on the map representing 20 percent of the city’s neighborhoods. The majority of neighborhoods in the top quintile, shown in red, are located in northern Brooklyn and Manhattan; all but one neighborhood in Manhattan (Marble Hill/Inwood (MN01)) ranks in the top quintile for median market value. The second and third top quintiles (orange and dark blue, respectively) mostly cover neighborhoods in southwestern Brooklyn and northern Queens. The two lowest quintiles, shown in gray and white, are concentrated in the Bronx, Staten Island, and southeastern Queens.
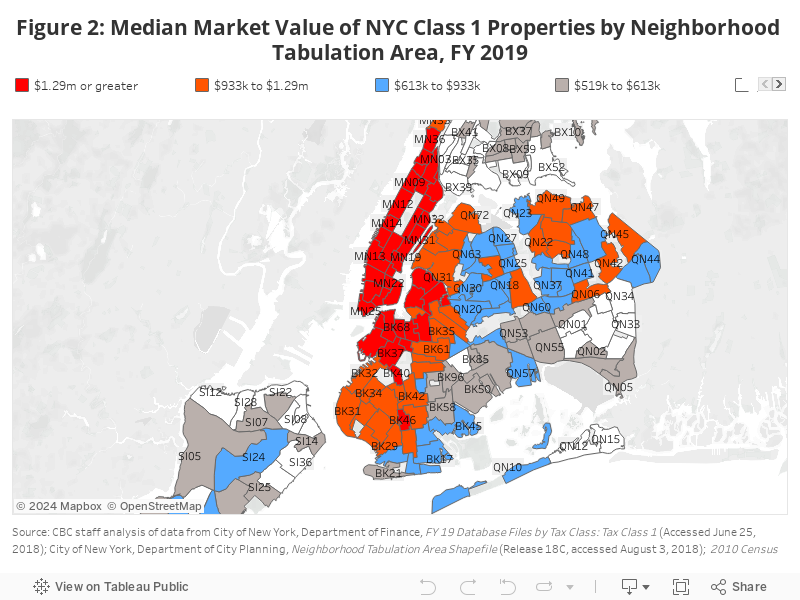
Neighborhoods with median values below $519,000 are mostly in the Bronx.
The majority—53 percent—of neighborhoods in the lowest quintile, or neighborhoods with median market values ranging from $363,000 to $519,100, are located in the Bronx. Roughly one-quarter of neighborhoods in the lowest quintile are located in Queens and another quarter in Staten Island. Brownsville (BK81) is the only Brooklyn neighborhood that ranks in the lowest quintile.
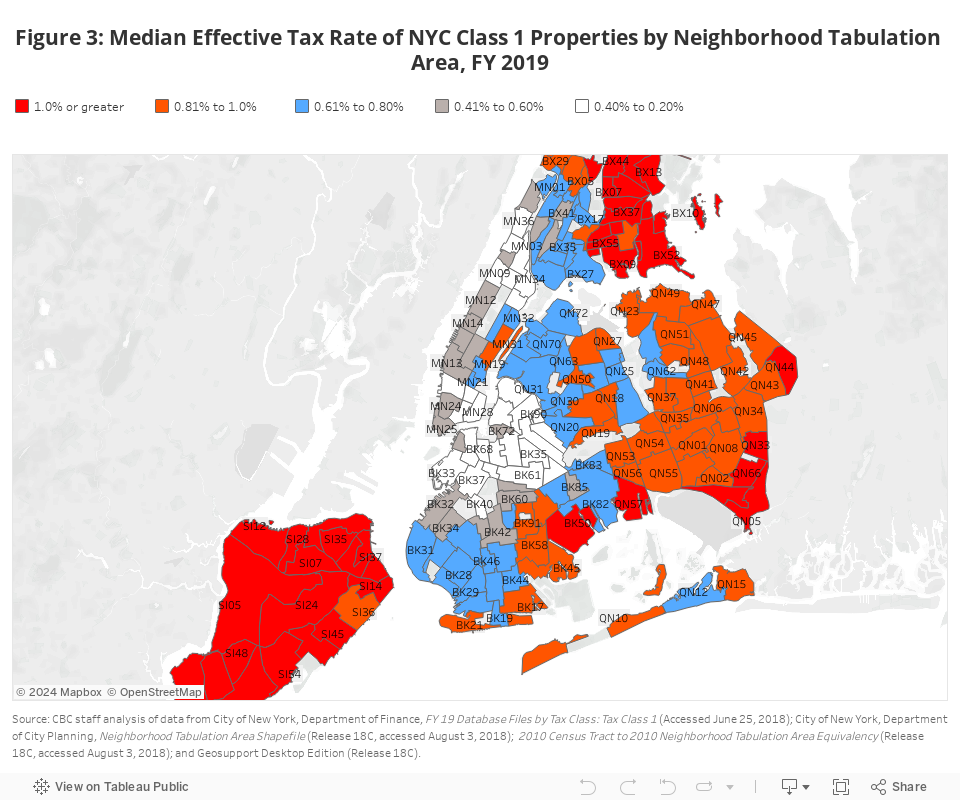
ETRs are lowest in high-value Manhattan and downtown Brooklyn, and highest in lower-value Staten Island and the Bronx.
Figure 3 shows the median Class 1 ETR by neighborhood. Neighborhoods that report the highest ETRs (red and orange shading) are clustered in the northern Bronx, Staten Island, and parts of eastern Queens—areas of the city with lower property market values and higher assessment ratios. Conversely, the lowest ETRs are in northern Brooklyn and Manhattan (white and gray shading).
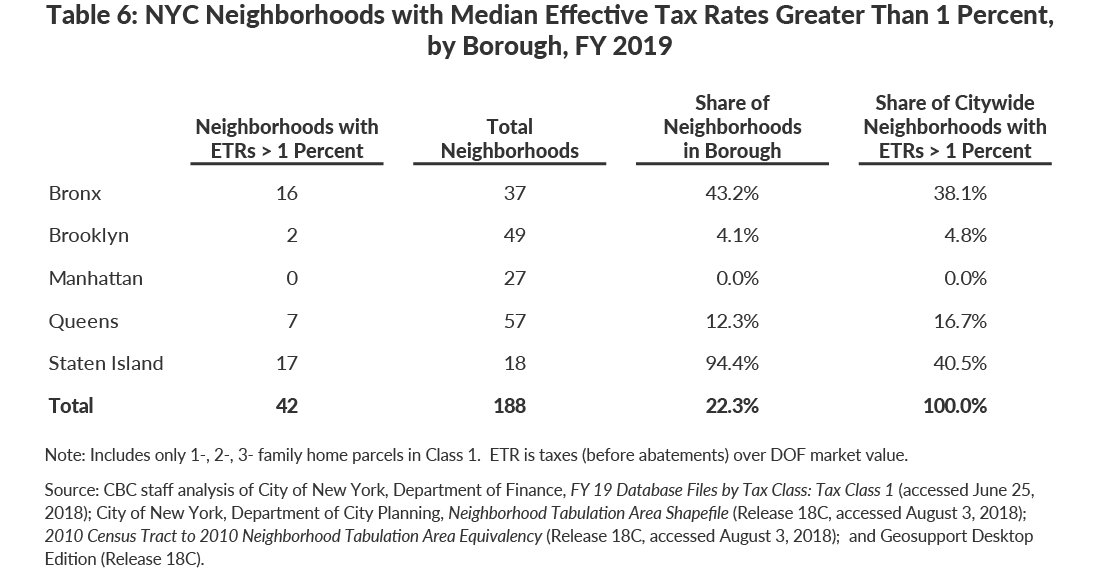
ETRs vary widely at the neighborhood level.
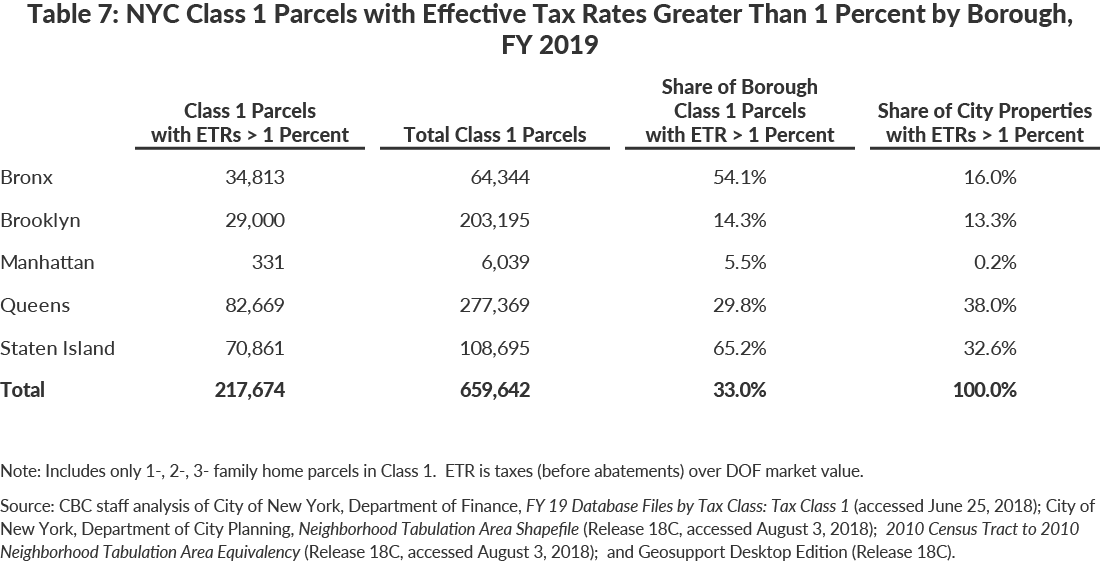
Table 6 presents the distribution by borough of the 42 neighborhoods where the median ETR is more than 1 percent (“high ETR”). Most of these neighborhoods are located in the Bronx (17) and Staten Island (16). More than 94 percent of the neighborhoods on Staten Island have high median ETRs, a far greater concentration than any other borough.
High ETR properties are concentrated in Staten Island and Queens.
The median citywide ETR is 0.89 percent and about 25 percent of properties have ETRs greater than 1 percent.
More than two-thirds of the properties in Staten Island have high ETRs, and they represent nearly one-third of all citywide high ETR properties. In Queens, 30 percent of Class 1 properties have high ETRs; however, this represents 38 percent of all high ETR properties as Queens has the most Class 1 properties in the city. More than half of the Class 1 properties in the Bronx have high ETRs, and they represent 16 percent of those properties citywide.
Conclusion
As CBC has previously explained, statutory caps on growth in assessed values create disparities in ETRs and inequities in tax burden. They insulate homeowners in neighborhoods experiencing dramatic market value growth from rapid increases in their property tax bills, shifting the burden of higher effective tax rates to neighborhoods in Staten Island and the northern Bronx that are experiencing relatively stable, rather than rapidly appreciating, property market values.
A government-appointed property tax commission has not conducted a comprehensive review of New York City’s property tax code in more than two decades.8 In May 2018 Mayor Bill de Blasio and Council Speaker Corey Johnson appointed the New York City Advisory Commission on Property Tax Reform to undertake a review.9 The Commission has been tasked with recommending reforms to make the property tax simpler, fairer, and more transparent, while maintaining the level of tax revenue. One of the items at the top of the Commission’s agenda should be addressing the inequities in the Class 1 property tax by restructuring or eliminating caps on assessment growth.
Appendix
Footnotes
- The market value is as calculated by the New York City Department of Finance for tax purposes and not necessarily reflective of the sale price that a property would command in an arms-length transaction. As amply documented, market values for cooperative and condominium units are substantially lower than sales prices. See: Citizens Budget Commission, Options for Property Tax Reform: Equitable Revenue Raising Reforms for New York City’s Property Tax (prepared by Andrew Hayashi, December 2013), https://cbcny.org/sites/default/files/media/files/Options%20for%20Property%20Tax%20Reform_1.pdf ; New York University Furman Center for Real Estate and Urban Policy, Shifting the Burden: Examining the Undertaxation of Some of the Most Valuable Properties in New York City (July 2013), http://furmancenter.org/files/FurmanCenter_ShiftingtheBurden.pdf; and New York City Independent Budget Office, Twenty-Five Years after S7000A: How Property Tax Burdens Have Shifted in New York City (December 5, 2006), http://www.ibo.nyc.ny.us/iboreports/propertytax120506.pdf.
- Less than 1 percent of the city’s Class 1 parcels could not be geocoded with the Geosupport Desktop Edition software provided by the Department of City Planning and were therefore excluded from this analysis. Parcels included in Class 1 that were not small homes (primarily small condominiums and vacant land) were also excluded.
- These caps apply to increases resulting from market appreciation. Increases in assessed value resulting from physical improvements, such as additions, are not capped.
- City of New York, Department of Finance, FY 19 Database Files by Tax Class: Tax Class 1 (accessed June 25, 2018), https://www1.nyc.gov/assets/finance/downloads/tar/tc1_19.zip; City of New York, Department of City Planning, Neighborhood Tabulation Area Shapefile (Release 18C, accessed August 3, 2018), https://www1.nyc.gov/assets/planning/download/zip/data-maps/open-data/nynta_18c.zip; 2010 Census Tract to 2010 Neighborhood Tabulation Area Equivalency (Release 18C, accessed August 3, 2018), https://www1.nyc.gov/assets/planning/download/office/data-maps/nyc-population/census2010/nyc2010census_tabulation_equiv.xlsx; and Geosupport Desktop Edition (Release 18C), https://www1.nyc.gov/site/planning/data-maps/open-data/dwn-gde-home.page.
- The tax levied reflects the value of exemptions, such as the School Tax Relief Program (STAR), but not abatements, which are minimal in Class 1.
- The maximum ETR for Class 1 in fiscal year 2019 is 1.31 percent, which is the target assessment ratio of 6 percent at the current tax rate of 21.891 percent.
- While there are 195 total Neighborhood Tabulation Areas (or “neighborhoods”) across New York City, this analysis only examined neighborhoods for which property value data was available (188 neighborhoods). The 7 excluded neighborhoods corresponded to areas with few or no residential properties such as airports, parks, and cemeteries.
- The Council of the City of New York, “The New York City Council Votes to Adopt the FY 2019 Budget” (press release, June 15, 2018), https://council.nyc.gov/press/2018/06/15/1618.
- City of New York, Office of the Mayor, “Mayor de Blasio And Speaker Johnson Announce Advisory Commission To Recommend Reforms To New York City’s Property Tax System” (press release, May 31, 2018), https://www1.nyc.gov/office-of-the-mayor/news/280-18/mayor-de-blasio-speaker-johnson-advisory-commission-recommend-reforms-new-york.