New York Tops the List in State Public School Spending
The Census Bureau recently released fiscal year 2011 data on public school spending. From fiscal year 2010 to 2011 average spending per pupil for the 50 states and the District of Columbia fell 0.4%, from $10,600 to $10,540. This is the first decrease since the Bureau began collecting data in 1977.
However, the decrease was not evident in New York, one of 30 states with an increase. Per pupil spending in New York increased 2.5% from $18,618 to $19,076. Spending in New York was the highest in the nation, fully 81% above the U.S. average. New York had the highest per pupil spending among the 50 states in each of the previous five years. Neighboring states were also among the top ten, but spent much lower sums – New Jersey averaged $15,968 per student (16% less) and Connecticut $15,600 (18% less). (See Figure 1.)

Two key components drive New York’s spending to the top – the salaries and the fringe benefits for instructional employees. Instructional salaries in New York averaged $8,196 per pupil, nearly double the U.S. average of $4,326. New Jersey and Connecticut spent $6,315 and $6,495 per pupil, respectively, on instructional salaries. New York’s per pupil spending on fringe benefits for instructional employees in New York is even more out of line, fully 2 ½ times greater than the U.S. average - $3,962 versus $1,505.
This large spending on instructional salaries and benefits contributes to New York’s relatively high standing among states in directing resources to instructional rather than support functions. New York’s per pupil spending on instructional salaries and fringe benefits totaled $12,158 and comprised 64% of total spending. That proportion is the highest among the top ten spending states. Rhode Island comes closest, allocating 59% to instructional salaries and fringe benefits, but because total spending in Rhode Island was significantly less, the dollar figure is a much lower $8,163 per pupil.
New York spent $5,401 per pupil on support services, 28% of total spending. This includes a variety of functions such as guidance counselors, pupil transportation, and building operations. The U.S. average is 35%, and among the other top 10 spending states the average is 37%.
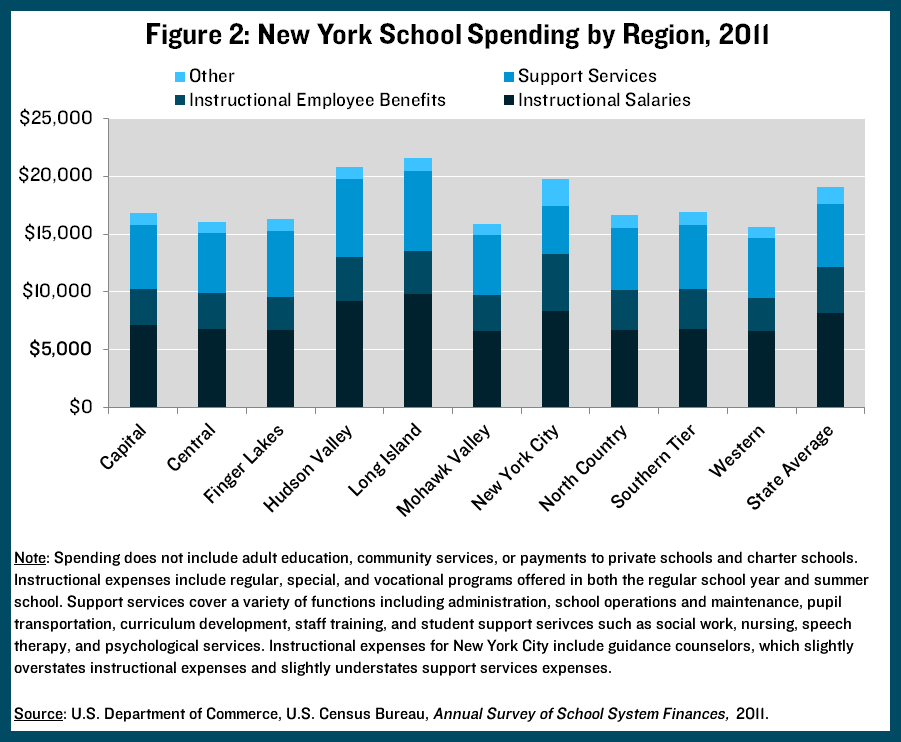
Although New York’s statewide average per pupil spending is unusually high, and almost all of New York’s 684 school districts spent more than the national average, significant variation can be seen among districts and regionally. Among regions Long Island is the biggest spender with an average per pupil total of $21,593, including $9,830 for instructional salaries and $3,699 for instructional employee fringe benefits. (See Figure 2.) In the Hudson Valley spending per pupil averaged $20,839. Spending $19,770 per student and comprising 37% of the state’s enrollment, New York City also drives the state average upward. Notably, New York City spent $4,919 per student on fringe benefits for instructional staff, a figure among the highest in the state in part because the vast majority of City employees do not contribute toward the cost of their health insurance. Regions upstate spent less per pupil, ranging from $15,639 in Western New York, the lowest average, to $16,876 in the Southern Tier.
Although New York spends generously in the aggregate on its public schools, some districts in the state spend significantly less than others. Differences exist in total per pupil spending and in the allocation of those dollars among categories of spending including instructional salaries and benefits and support services.