Reviving EMS
Restructuring Emergency Medical Services in New York City
A well-functioning emergency medical service (EMS) is a matter of life or death for New Yorkers. On the fateful day when one takes a bad fall on a stairway, is hit by a negligent motorist, or suffers a heart attack, the availability of medical assistance in a timely and effective manner can make a difference in one’s chance of survival and full recovery. The City of New York spends more than $1.1 billion annually in an effort to provide its residents and visitors this vital service, but the money is not used wisely. The system suffers from serious inefficiencies, and major reforms are needed to make it work better.
The major inefficiencies are:
- Many of the incidents to which the EMS responds are not medical emergencies, but rather avoidable or unnecessary requests for assistance that could be handled better in ways other than sending an ambulance.
- An excessive share of resources is allocated to responding to incidents for which medical staff and equipment are an appropriate response, but the timeliness of arrival is not a major factor in the outcome for the patient; too few resources are allocated to responding to the rarer medical incidents for which timeliness is a critical factor in determining the individual’s outcome.
- The use of fire engines in addition to ambulances as a response to medical incidents is wasteful; the heavily staffed fire engines are far more expensive than ambulances as a response, and in many of the incidents to which they respond, fire engine personnel are not able to deal effectively with the medical condition.
Three reforms could enhance the performance of New York City’s EMS.
- Build on the experience of other cities to develop programs to reduce residents’ unnecessary or inappropriate requests for an ambulance. A 10 percent reduction in requests would save an estimated $58.5 million annually.
- Increase the number of and more efficiently staff the ambulances which are best able to respond to the life threatening incidents (known as Advanced Life Support or ALS ambulances) so they can arrive at relevant incidents more promptly. The shift to a more efficient staffing model for ALS ambulances would provide enough savings to increase their number significantly.
- Dramatically reduce the role of fire engines in responding to medical incidents; they should be dispatched to these incidents only when it is likely the engine will arrive before an ambulance and the fire engine’s staff’s presence will result in quicker, appropriate medical treatment. The reduced reliance on fire engine response to medical incidents can yield savings by reducing the number of fire engines to reflect their reduced workload; staffing each fire engine costs about $7.2 million annually, and these resources could be reallocated to higher priority services.
The Growing Demand for EMS
In New York City the Fire Department of the City of New York (FDNY) is responsible for responding to reported medical incidents, with the requests coming through the 9-1-1 phone system. In 2017 the FDNY responded to nearly 1.5 million incidents, an average of more than 4,000 incidents per day. This number has been growing steadily and was nearly 389,000 incidents, or 36 percent, greater in 2017 than in 2000. (See Figure 1.)

These incidents vary significantly in seriousness, but all receive some form of response from FDNY directly or in coordination with private ambulance providers. In order to link the nature of the response to the severity of the incident, FDNY dispatchers categorize calls into one of eight “segments” indicating severity and assign an “incident type.” Segments 1 to 3 are considered life threatening; segments 4 to 8 are non-life threatening.1 In 2017 more than 60 percent of medical incidents were non-life threatening.
Table 1 lists the most common incident types within each segment. The incident types recorded, particularly for Segments 4 to 8, are generic groupings that give only a general sense of the underlying circumstance. The majority of Segment 4 incidents are for drug and alcohol abuse (not including overdose) or “unknown” causes.2 Segment 5 is most commonly nonmajor injuries, such as broken bones and abdominal pain. Almost all (93.0 percent) of Segment 6 incidents are described as a person feeling sick, and Segment 7 is dominated by patients exhibiting psychiatric symptoms. The last segment is standby, such as when stationed alongside the New York City Marathon, and included few incidents in 2017.

Among the 38.7 percent of incidents that were potentially life threatening, the most serious and time sensitive were Segment 1 incidents of cardiac arrest and choking–together these account for only 2.1 percent of all medical incidents. Segments 2 and 3 were primarily incidents that could potentially be fatal, such as an unconscious person (potential overdose) or someone having difficulty breathing (severe allergic reaction or asthma attack). Similarly, chest pain could be a sign of heart attack and, therefore, falls into Segment 3.
Response priorities are linked to the severity of the incident in order to speed responses to the more severe incidents. Response time, defined as the time between the incident being logged in the dispatch system and the first responding ambulance arriving at the scene, ranged from an average of 4 minutes and 52 seconds for Segment 1 incidents to 12 minutes and 42 seconds for Segment 7 incidents.3
The growing number of medical incidents has multiple causes. Population growth plays a role but does not explain fully the increase; the number of incidents per 1,000 residents rose from 134 in 2000 to 170 in 2017.4 Additional factors may be an increased share of elderly among the population and an increased share of New Yorkers who are insured.5 A recent study found that access to health insurance in New York City was associated with increased ambulance use.6 Given the multiple factors at work it is not possible to gauge the extent to which New Yorkers are becoming more prone to use EMS for any given incident, but this too may be driving the growth in demand.
Between 2000 and 2017 the number of life threatening incidents grew 46.2 percent, and non-life threatening incidents grew 30.6 percent. Life threatening incidents now account for a greater share of total incidents than in the past, growing from 36.0 percent in 2000 to 38.7 percent in 2017. This is largely due to a 17.0 percent increase in life threatening incidents in 2015 that has been sustained through 2017 and may be related to changes in protocols for how calls were segmented by EMS dispatchers; the opioid epidemic and increased synthetic marijuana use likely also played a role as associated incident types grew significantly.7
How the FDNY Responds to Medical Incidents
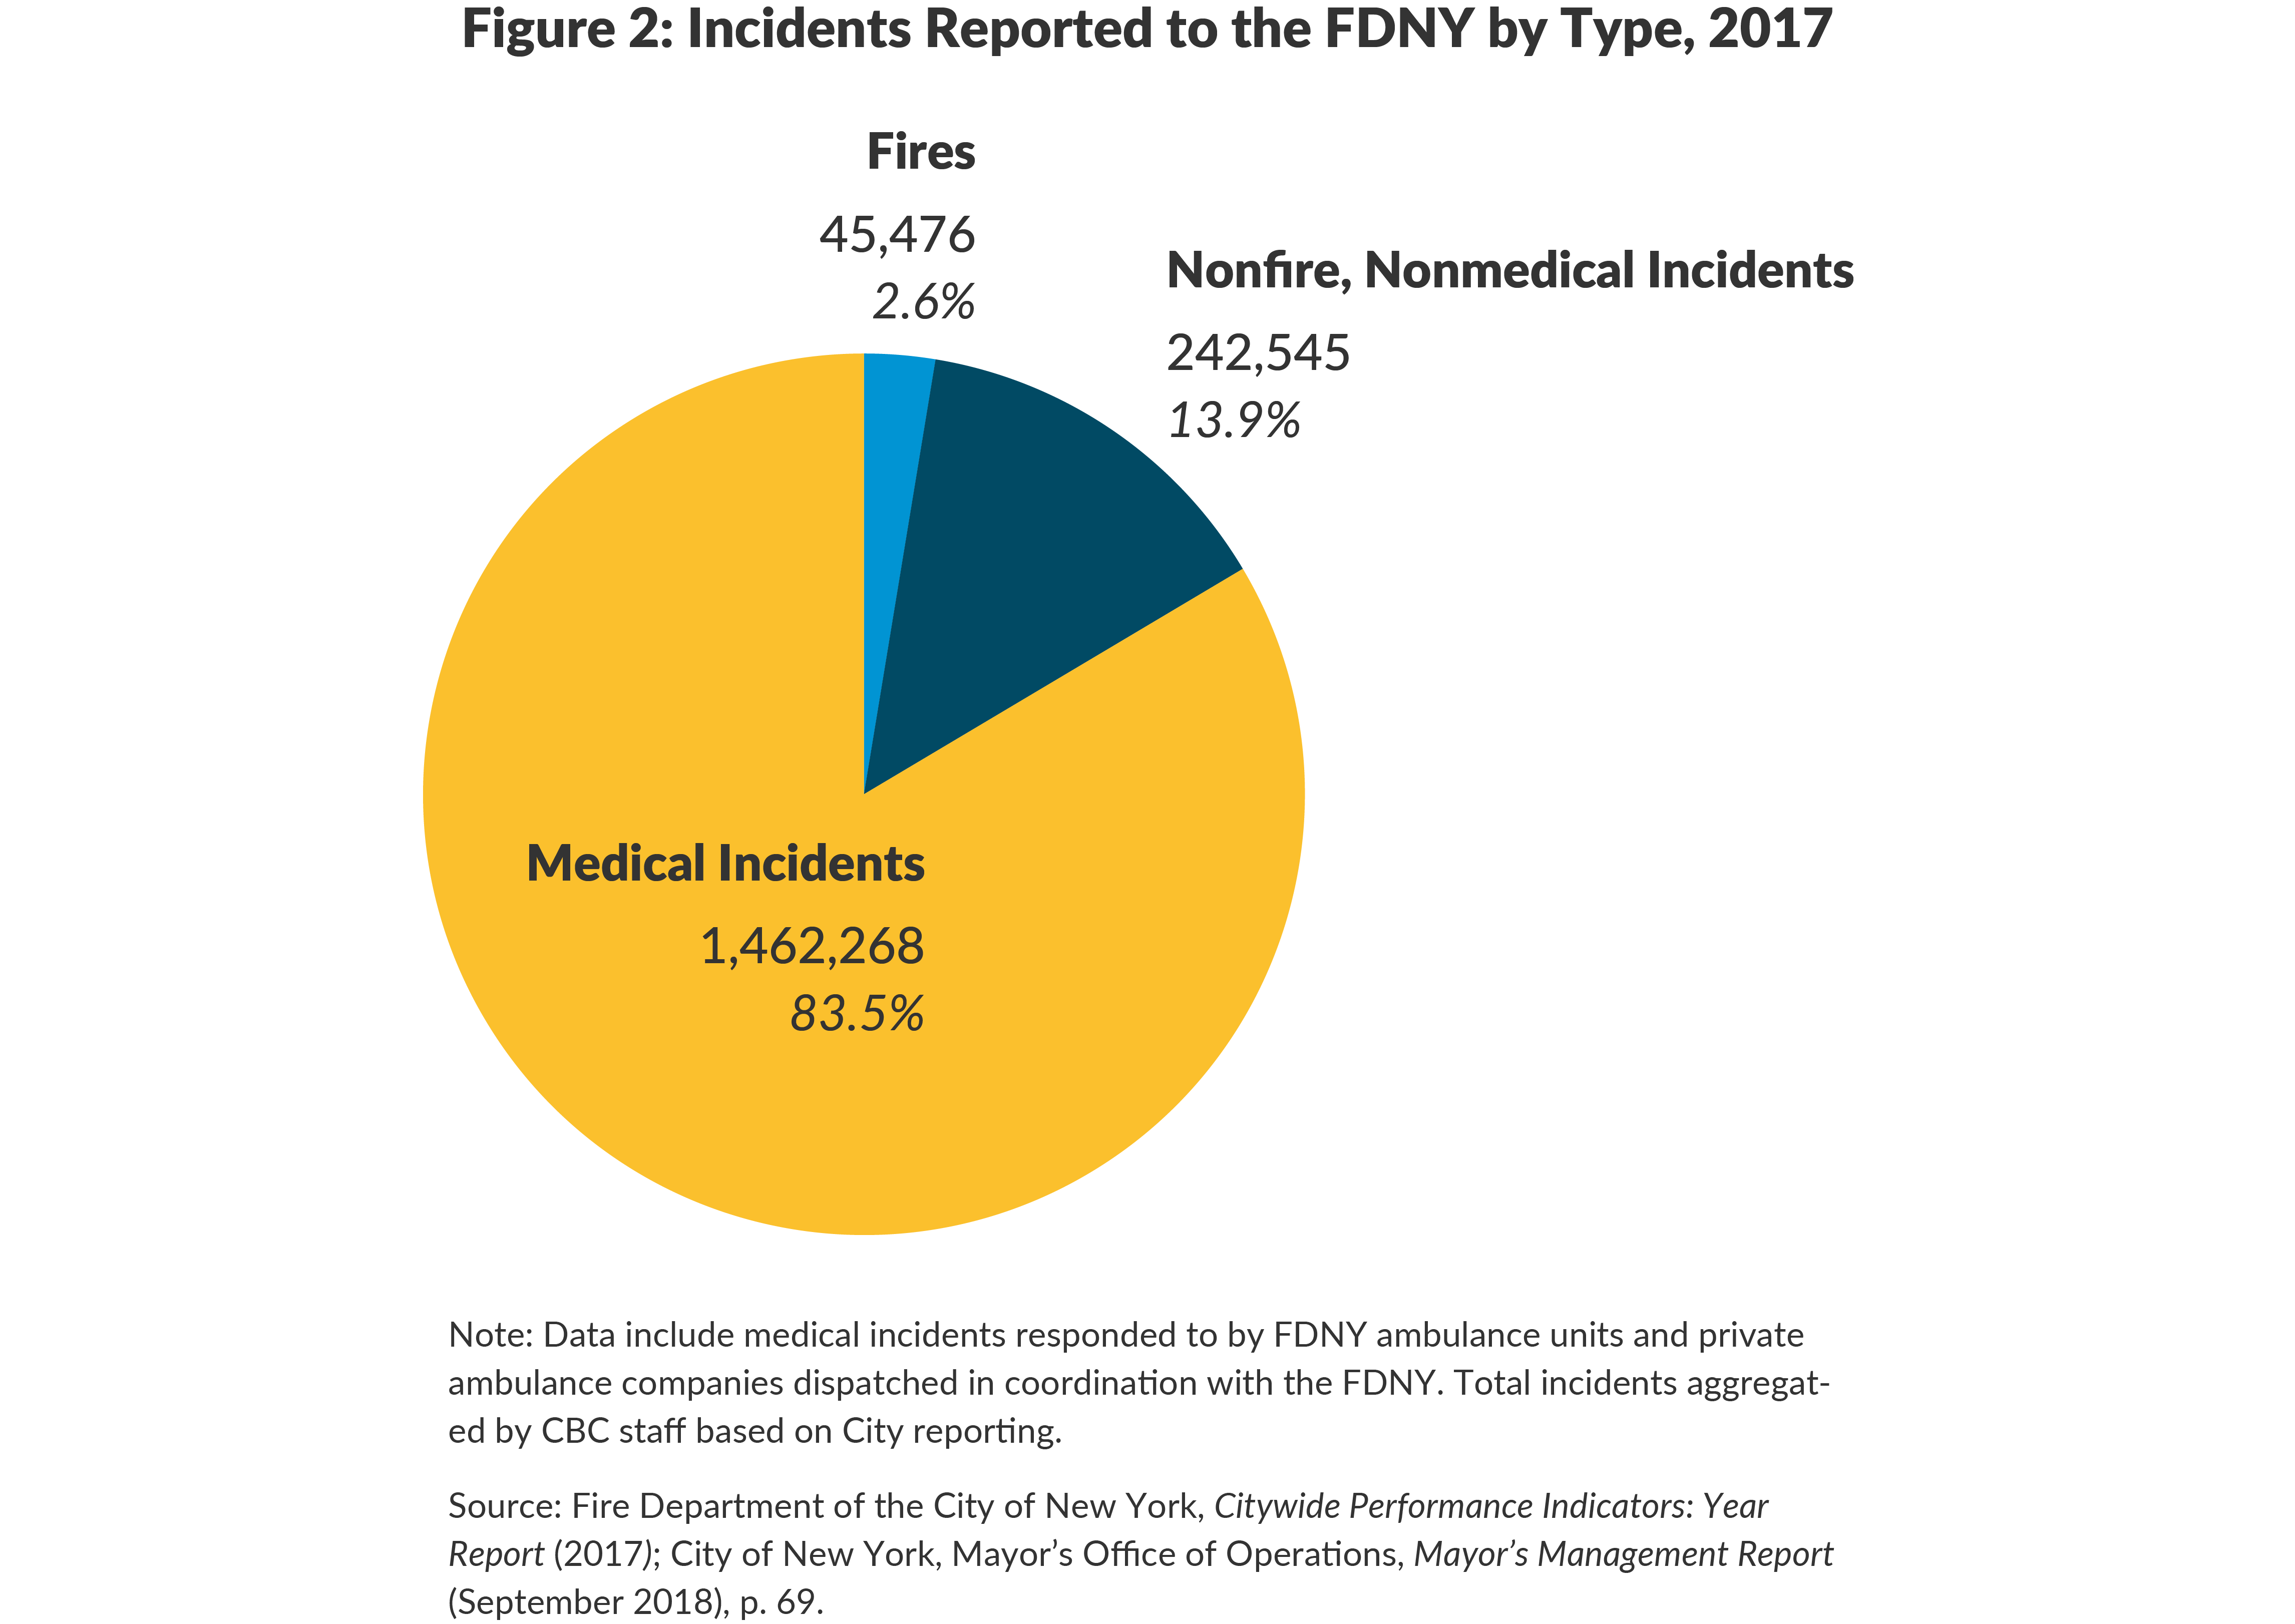
Medical incidents comprise more than four of every five (83.5 percent) of the incidents to which the FDNY responds; fires are only about one of every 40 (2.6 percent). In 2017 FDNY fire companies and ambulances (including responses by privately operated ambulances in coordination with the FDNY) responded to 1.5 million medical incidents; 242,545 nonfire, nonmedical incidents such as gas leaks; and 45,476 fires.8 (See Figure 2.)
The FDNY operates a tiered response system, meaning a dispatcher sends one vehicle or two or more in combination depending on the assigned segment and incident type. Each time a vehicle is dispatched from its station to respond to an incident, it is logged as a “run.” In 2017 there were 2.0 million medical runs made by four kinds of response units:9
1. Basic Life Support (BLS) ambulances. BLS ambulances are staffed with two Emergency Medical Technicians (EMT); these individuals have 200 hours of training and can provide CPR, give oxygen, and administer glucose to diabetics, but generally are not allowed to provide medicines or conduct procedures that pierce the skin.10 BLS ambulances respond to all non-life threatening incidents and certain Segment 3 incidents such as seizures.11 They also respond in coordination with ALS ambulances and fire engines for the most serious incidents. In 2017 BLS “tours” averaged 806 per day: 574 tours staffed by 2,982 municipal EMTs were provided by the FDNY and 232 tours were provided by private ambulance companies.12 Each tour is an eight-hour shift.
2. Advanced Life Support (ALS) ambulances. ALS ambulances are staffed with two paramedics. Paramedics have 1,280 hours of training and can provide BLS level care as well as more advanced care such as intubation and the administration of narcotics and intravenous medication. ALS ambulances are outfitted with EKG machines, IVs, and an intubation kit.13 In 2017 ALS tours averaged 360 per day, with 224 tours staffed by 888 municipal paramedics, and private companies providing an additional 136 tours. The Regional Emergency Medical Services Council (REMSCO), a council set up by the New York State Department of Health to regulate emergency response systems statewide, requires that New York City ALS ambulances be staffed with two paramedics; elsewhere in New York State ALS ambulances are staffed with one paramedic and one EMT.14
FDNY establishes its own guidelines as to which type of ambulance responds to which types of incidents. In 2017 of the 566,000 life threatening incidents, 325,777 (57.6 percent) were judged to require an ALS response.15 (See Figure 3.) For some of these incidents, ALS response was accompanied by dispatch of a BLS ambulance and/or fire engine.
At a minimum all medical incidents are responded to by a BLS or an ALS ambulance; in total ambulances made 1.8 million runs in 2017. Ambulances provide prehospital care and transport the patient to an emergency room (ER) if required; transport occurs in 70.0 percent of responses.16

At a minimum all medical incidents are responded to by a BLS or an ALS ambulance; in total ambulances made 1.8 million runs in 2017. Ambulances provide prehospital care and transport the patient to an emergency room (ER) if required; transport occurs in 70.0 percent of responses.16
3. Fire Engines. Many serious medical incidents are responded to by a fire engine company (as opposed to a fire ladder company) in addition to an ambulance.17 The fire engine is sent to the incident because it typically can arrive more quickly than an ALS ambulance, and its staff of firefighters is trained to provide assistance for some medical conditions. Firefighters on engine companies receive 80 hours of training as Certified First Responders, certified to perform defibrillation (CFR-D).18
In 2017 fire engines responded to medical incidents almost one minute faster on average than did ambulances.19 Speedier response times are facilitated by smaller workloads: Citizens Budget Commission (CBC) estimates fire engines went on an average of 3.3 runs (medical and other) in an eight-hour period in 2017, while ambulances went on an average of 4.1 runs. Further, fire engines spend less time on an average run (23 minutes and 23 seconds) than do ambulances: the average ambulance run is more than an hour long since most include transport to a hospital as well as on the scene attention.20 A consequence of the larger workload is that when a call comes in, the closest ambulance may be busy with another incident, requiring a further away ambulance to travel to the incident. The FDNY has recently made efforts to reduce the time it takes to for EMS workers to hand a patient over for care to staff at a hospital emergency department in order to increase their availability for subsequent runs. It also may be that while more ambulances than fire engines are staffed and active at any given time, fire engines are better dispersed throughout the City.
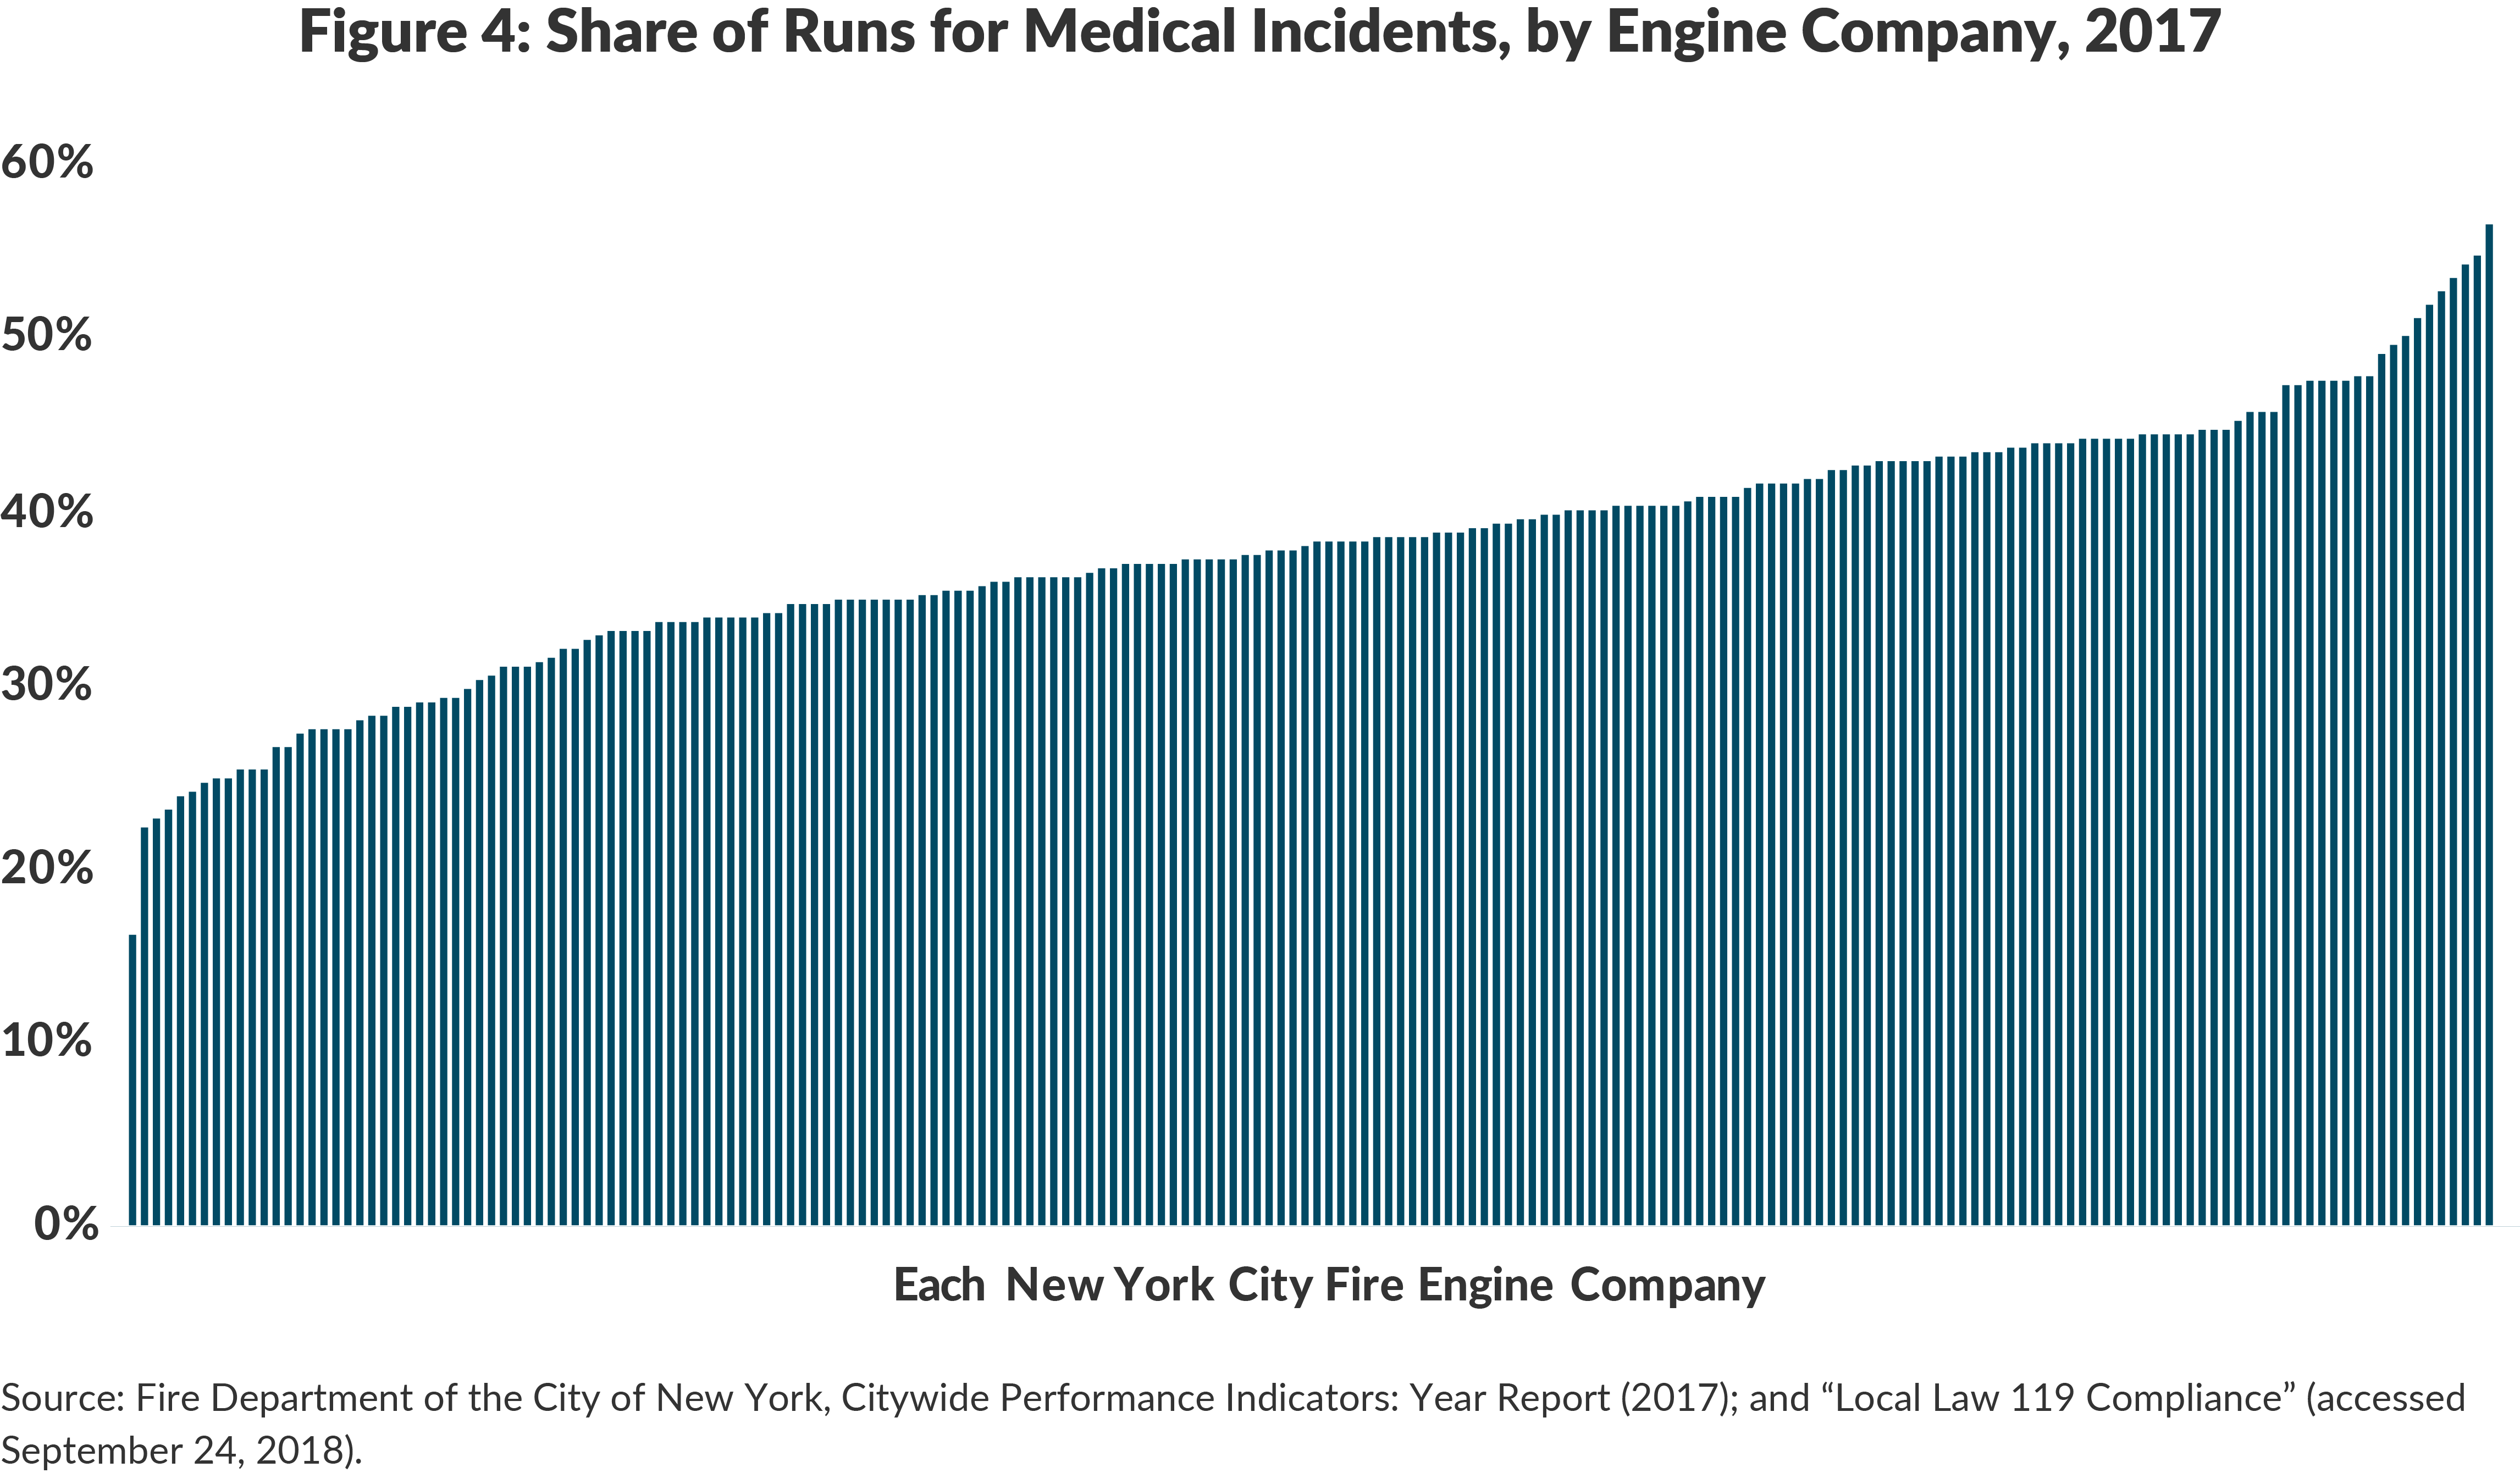
Medical runs by fire engine companies are a significant and growing share of their workloads. From 2000 to 2017 the number of medical incident runs by fire engine companies increased 83.2 percent from about 151,000 to 281,000; in 2000 medical incident runs were about one of every four (27.1 percent) engine company runs, and in 2017 they were nearly two of every five (38.8 percent) engine company runs.21 Of the City’s 198 fire engine companies, medical runs are more than 50 percent of the workload for 9 companies, 40 percent to 50 percent of the workload for 75 companies, 30 percent to 40 percent for 88 companies, and less than 30 percent of runs for the remaining 26 companies. (See Figure 4.)
4. Paramedic Response Unit (PRU or “Fly Car”). In 2016 the FDNY rolled out a pilot program in the Bronx to address the longer than average response times in that borough. Paramedic Response Units, also called Fly Cars, are SUVs staffed by an EMS supervisor (Captains and Lieutenants who are also certified paramedics) and another paramedic. Traditionally, EMS supervisors staff an SUV individually and provide coordination and assessment at scenes, but rarely provide direct medical care. In the pilot program, Fly Cars are dispatched to life threatening incidents in the Bronx, along with a BLS ambulance. The paramedics in the Fly Car assess whether a patient requires ALS level care; when that is the case, they provide care and accompany the patient to the hospital using the BLS ambulance for transport. Approximately 70 percent of the time, however, only BLS level care is needed; when this is the case, the BLS ambulance provides care and transports the patient, leaving the Fly Car free to respond to the next emergency. A fire engine is not dispatched to these incidents.22
Currently 10 Fly Cars operate in the Bronx. To implement the pilot the FDNY reduced the number of ALS tours by five, freeing 10 paramedics to staff the Fly Cars. At the same time, resources were provided to increase the number of daily BLS tours in the Bronx by 10. The pilot reduced response times to life threatening incidents in the area by more than one minute.23
To accommodate the growth in medical incidents, in 2014 the FDNY began investing in additional BLS ambulance tours in areas with the longest response times. As Table 2 shows, the average number of daily BLS ambulance tours increased from 437 to 574 between 2014 and 2017; publicly provided ALS tours remained relatively flat. The FDNY has also had to counter the long-term trend of private ambulance providers pulling out of the market as hospitals have closed or consolidated, or companies have found the economics of the industry untenable. One of the larger private ambulance providers, Transcare, filed for bankruptcy in 2016, taking 81 ambulance tours with it.24
The total number of tours has grown in recent years, with ALS tours declining by 4.0 percent, due to the implementation of the Fly Car program, and BLS tours increasing by 20.8 percent between 2014 and 2017. As a result of the decline in ALS ambulances and increase in ALS level incidents, ALS workloads have increased, growing from 1.7 ALS incidents per ALS tour in 2014 to 2.5 per tour in 2017.25

The Cost of Responding to Medical Incidents
The FDNY’s budget, excluding centrally budgeted costs, was $2.0 billion in fiscal year 2017. Of this total, an estimated $599.7 million was dedicated to emergency medical response: the personnel and equipment cost of ambulances and Fly Cars ($309.8 million) plus the apportioned cost of using fire engines to respond to medical incidents ($290 million).26
Reimbursements
When an ambulance transports a patient to the hospital, the patient’s health insurance will reimburse for the trip if it is determined to be medically necessary. Reimbursements, however, do not cover the full cost of providing emergency medical services, and because fire engines do not have transportation capacity, the associated costs are not eligible for reimbursement. In fiscal year 2017 the FDNY received $182.6 million in payments, 30.5 percent of the agency costs. Medicaid typically reimburses $210.44 per ambulance transport in New York State, and Medicare pays varying amounts depending on severity of emergency, distance, and other factors.
Source: Centers for Medicare & Medicaid Services, “Medicare Claims Processing Manual: Chapter 15 – Ambulance” (accessed September 25, 2018), www.cms.gov/Regulations-and-Guidance/Guidance/Manuals/downloads/clm104c15.pdf; and eMedNY, “Transportation Fee Schedule” (June 15, 2018), www.emedny.org/ProviderManuals/transportation/index.aspx.
The medical response budget has grown in recent years to support increased personnel costs and the costs of additional ambulance tours. (See Figure 5.) In fiscal year 2014 the estimated budget was $484.5 million, and it is projected to reach $635.9 million in fiscal year 2019–growth of 31.4 percent over five years.
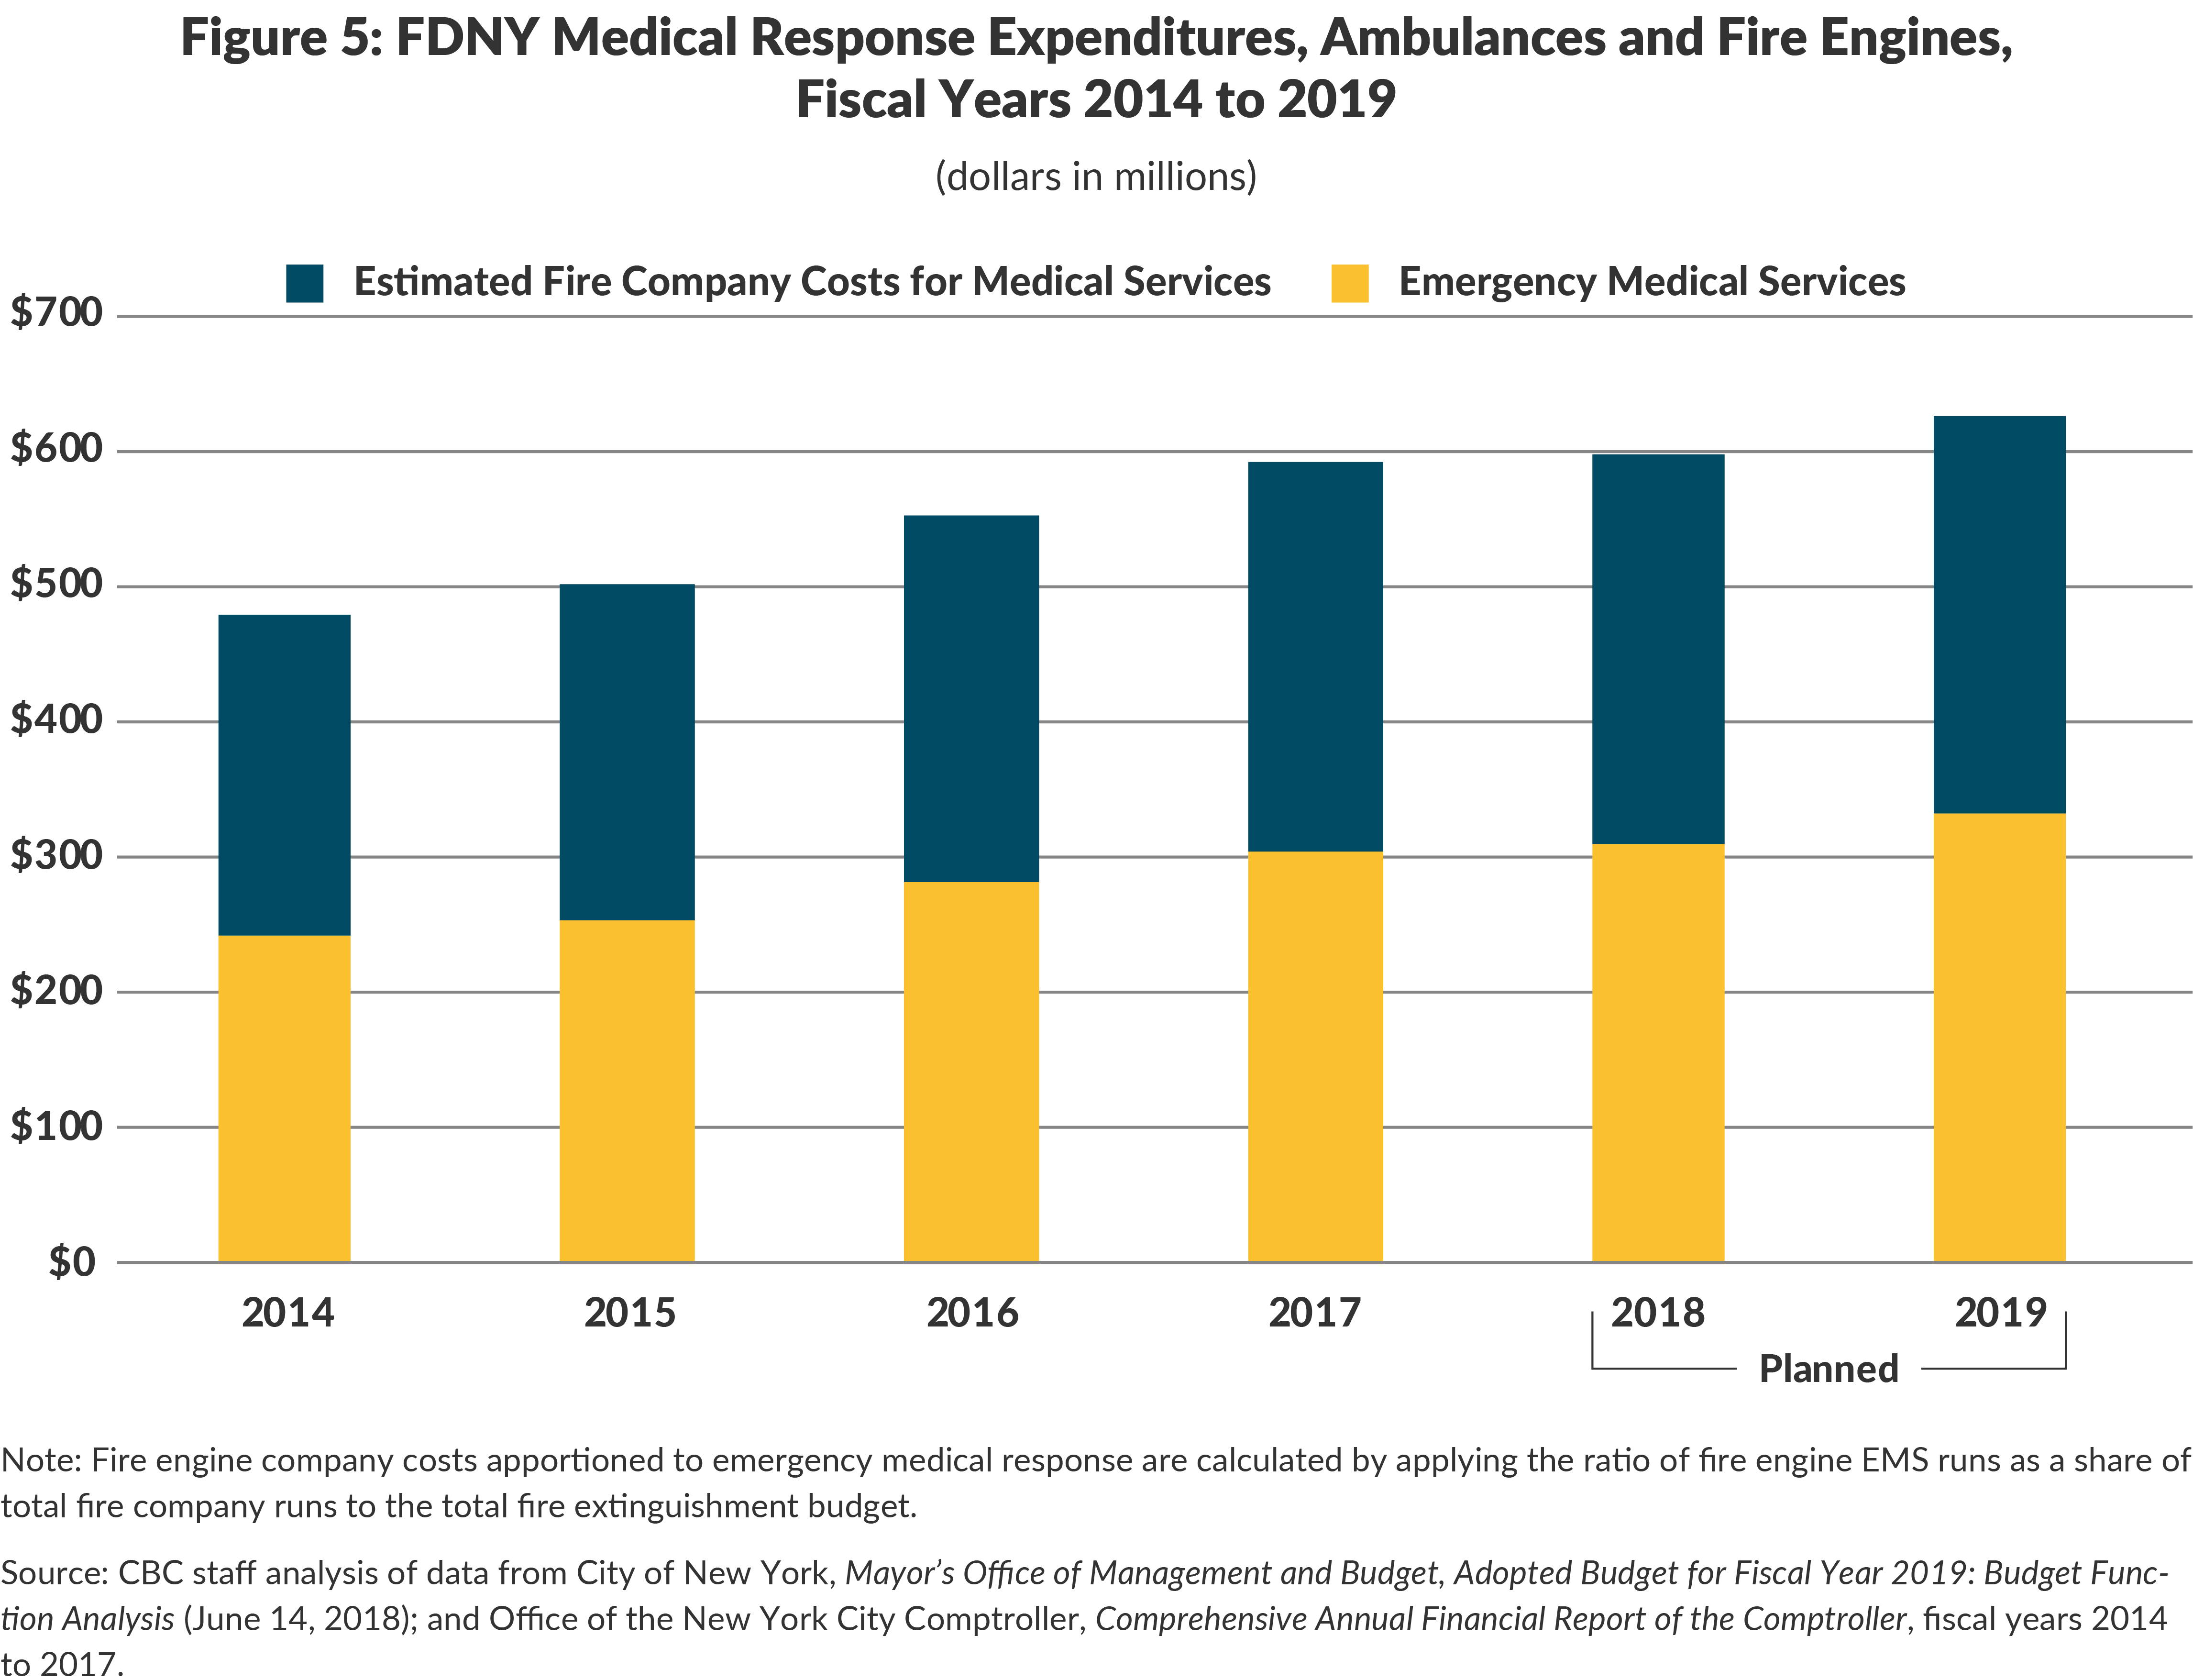
These figures do not include centrally budgeted expenses including health insurance premiums for current and retired staff, pension fund contributions for current staff, and debt service for capital investments in equipment and facilities. These additional expenses almost double the estimated medical response budget, adding $538.9 million to bring the “fully loaded” total to $1.1 billion in fiscal year 2017. This estimated medical response cost equals 27.9 percent of the Fire Department’s $4.1 billion fully loaded budget in fiscal year 2017.27
Taking Too Long and Spending Too Much
The FDNY’s protocols for responding to medical incidents are inefficient, meaning costs are higher than necessary, and ineffective, meaning response times to the most critical incidents are longer than desired and jeopardize the chances of positive outcomes for the individuals involved. The three primary reasons are:
- Efforts to reduce excessive, potentially unnecessary, utilization of the EMS system are lacking;
- Too many resources are devoted to less critical incidents; and
- Frequent use of fire engines to respond to medical incidents is expensive and ineffective.
The EMS is bogged down by calls that are not emergencies
The FDNY EMS is designed to deliver a similar intervention regardless of how appropriate it is for the “emergency:” 9-1-1 is called and at a minimum a BLS ambulance is sent. EMTs and paramedics are not allowed to deny someone transport to a hospital if it is requested, and in only 133 out of 1.0 million incidents in which care was provided did an EMS provider treat or triage without providing transport.28 The department is ill-equipped to counter the misuse of the EMS that manifests in three ways:
- when professional medical care is not actually needed;
- when the sick person could have gotten to the hospital or to another medical care provider safely on his or her own; or
- when the situation could have been avoided with earlier care or behavior change.29
The EMS dispatch data do not contain sufficient detail to assess what share of New York City ambulance runs qualify as misuse, but academic research gives a sense of its prevalence. Prior estimates of inappropriate use, defined as calls when professional medical care is not needed, range between 11 percent and 16 percent of incidents.30 Research also suggests that inappropriate use is more prevalent among Medicare and Medicaid patients, possibly because those patients are less likely to have regular medical care or alternative means of transport, and because Medicaid patients do not bear the cost of the ambulance ride because there are no copays.31 A national study looked at Medicare ambulance transports to ERs and found that 15 percent of those cases could have been cared for in another care setting.32
Avoidable use—ambulance use for chronic conditions like diabetes, asthma, or addiction—is particularly pervasive and costly, and for many of these patients, the ER is not the ideal treatment site.33 In addition there is evidence that a subset of patients with chronic conditions, called “frequent fliers,” are prone to recurrent EMS use, relying on ambulances and ERs for routine care.34 One study of urban EMS systems examined repeat utilization for three chronic conditions: acute alcohol intoxication, seizure disorder, and respiratory illness. Among these diagnoses researchers found 4.3 percent of patients accounted for 28.4 percent of transports.35 The publicly available EMS data do not allow for tracking of frequent fliers; while the hospital intake and ambulance billing data would allow for such an analysis, the FDNY does not track the data in that manner.
Additional resources inappropriately prioritize less critical incidents
The time it takes for an ambulance or fire engine to respond to a medical incident is the indicator by which service quality is judged generally. In the Mayor’s Management Report there are eight indicators that assess the quality of emergency medical care, six of which relate to response times.36 In the majority of cases, however, response time does not have an impact on morbidity or mortality; response time matters only for a small portion of incidents such as cardiac arrest, choking, anaphylactic shock, serious acute trauma, and stroke.37 For these types of incidents, response times have increased.
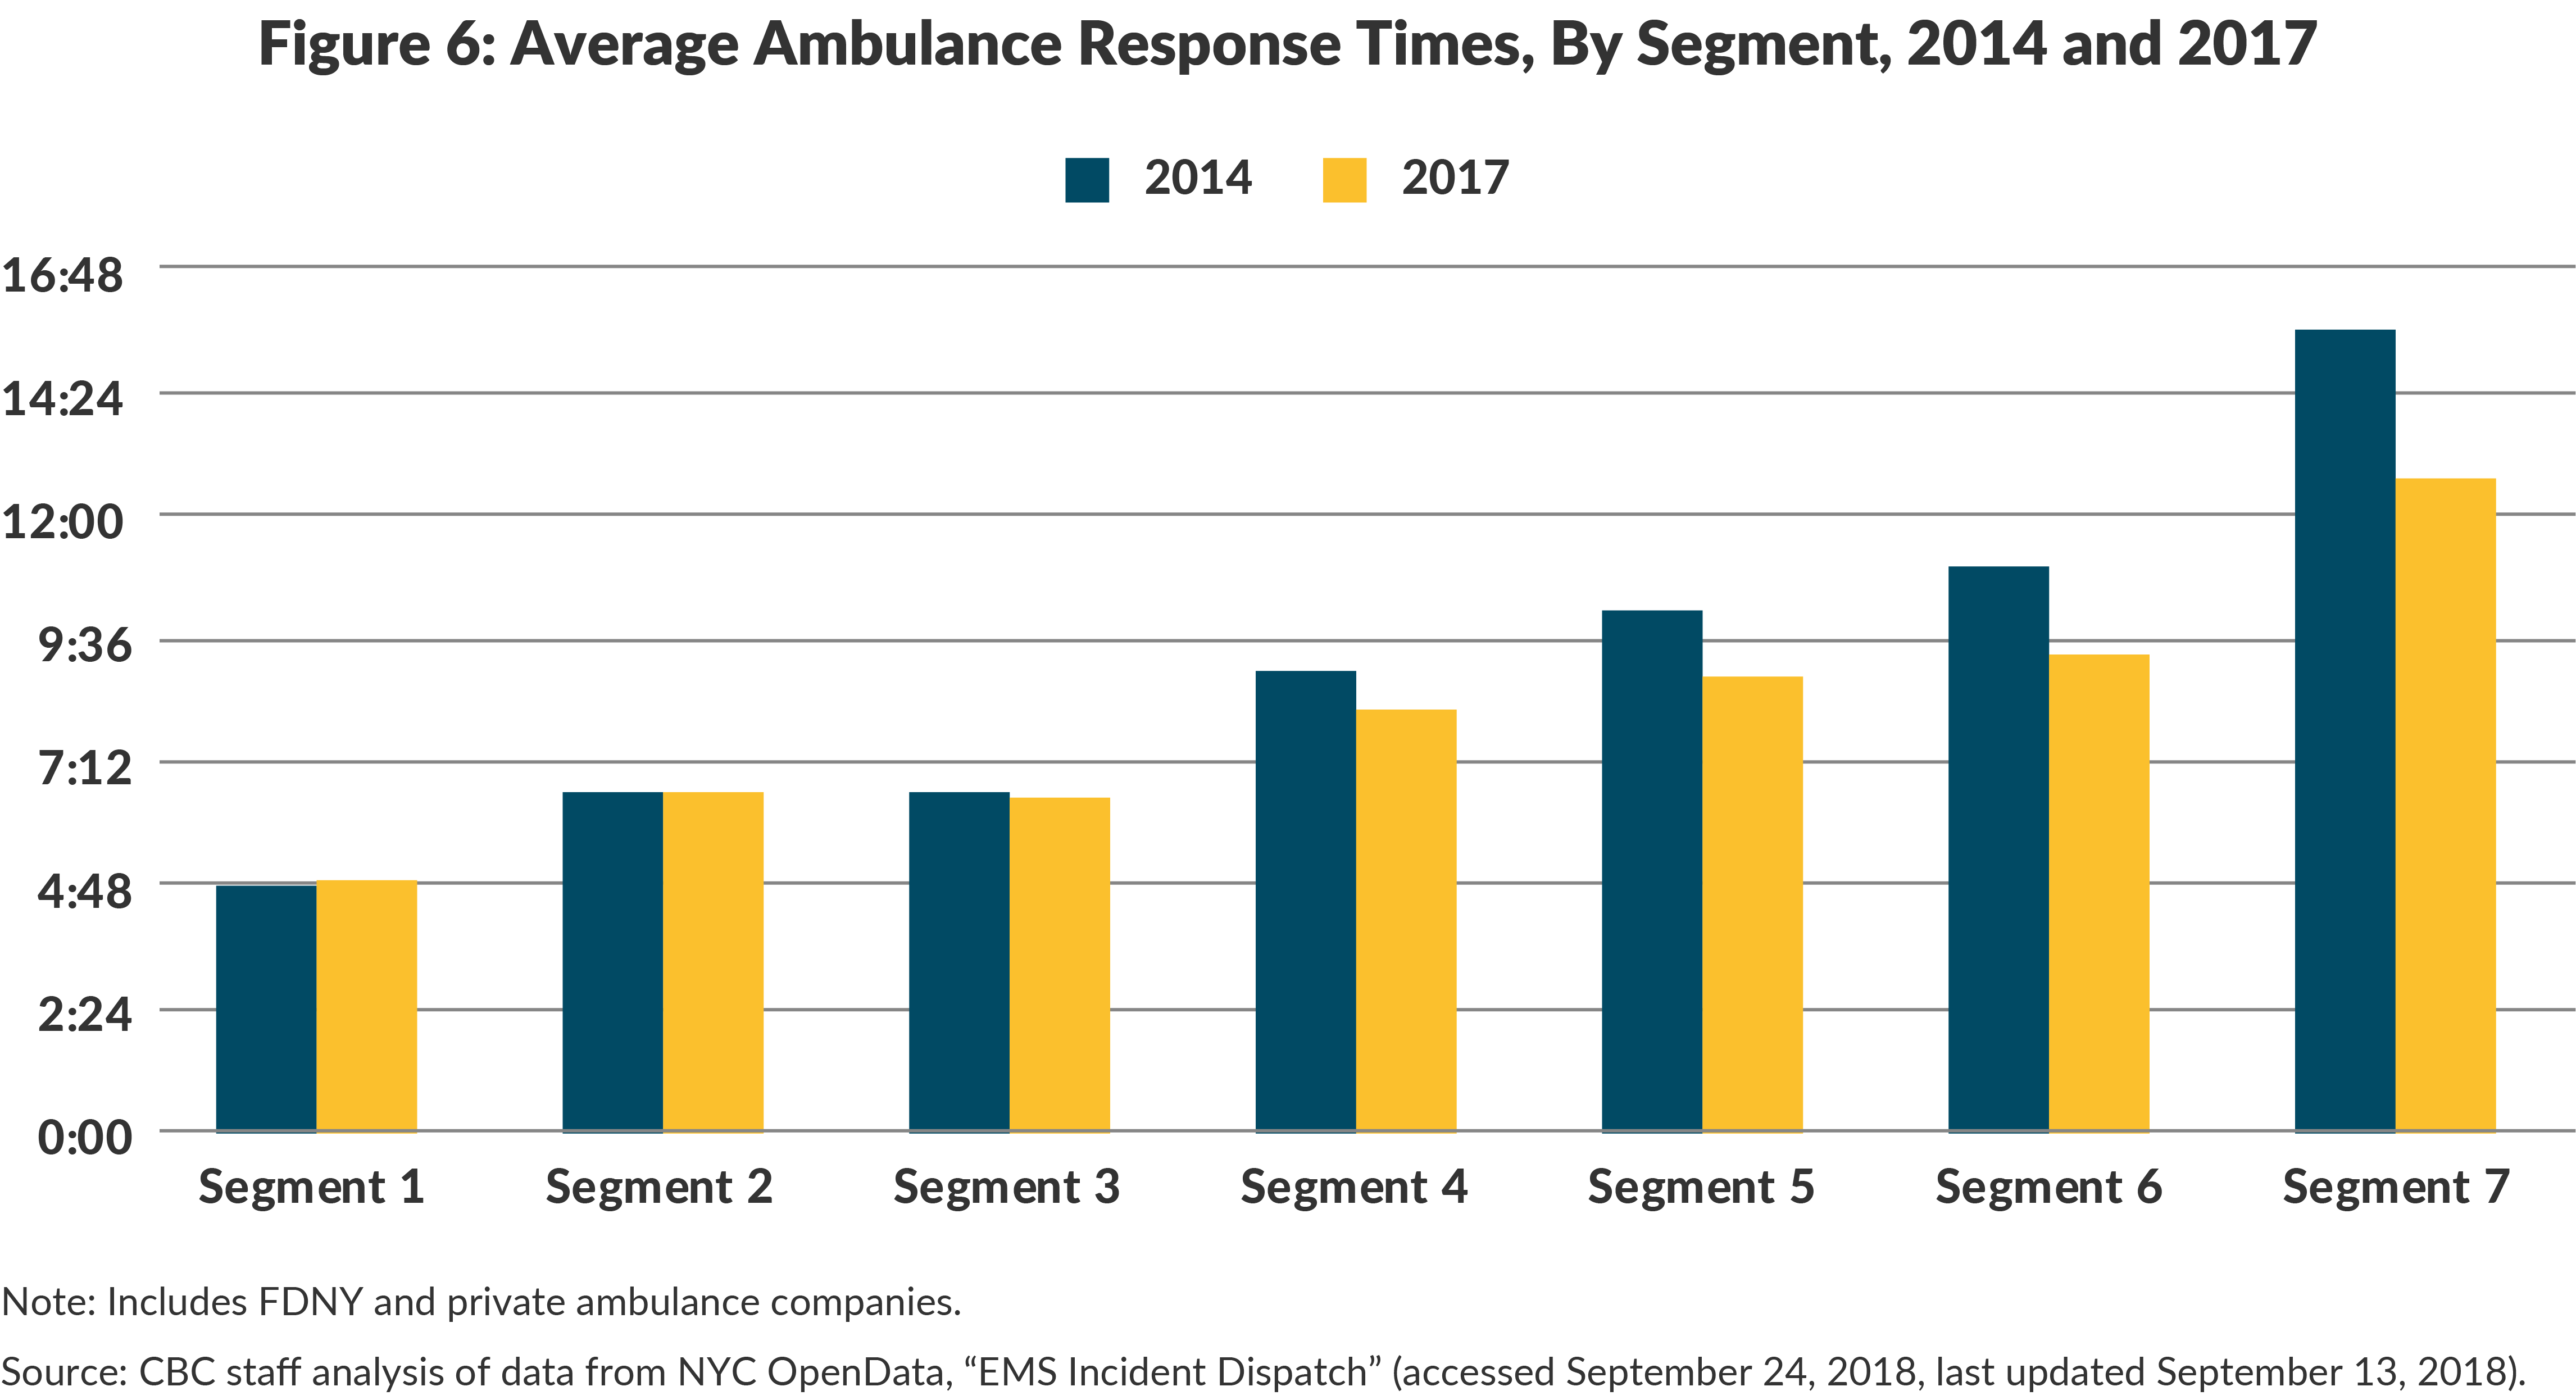
In 2014 when the City increased resources for EMS, the resource allocation was not guided by this important evidence. Instead the City invested in additional BLS ambulance tours with the explicit purpose of reducing response times to all incidents, instead of increasing ALS capacity for the most time-sensitive ones.38 As shown in Figure 6 between 2014 and 2017, the average ambulance response to non-life threatening incidents improved substantially by one minute and 13 seconds, with changes in average response times varying from Segment 4 incidents (43 seconds faster on average) to Segment 7 incidents (2 minutes and 58 seconds faster). Meanwhile, average response times to life threatening incidents stayed the same, and the average response time to the most critical Segment 1 incidents increased by 5 seconds.39 Further, the successful resuscitation rate for cardiac arrest victims declined from 25 percent in fiscal year 2014 to 22 percent in fiscal year 2017.40 The chances of resuscitation are linked directly to how quickly a cardiac arrest victim is treated.41
Using fire engines to respond to medical incidents is expensive and ineffective
Fire engine runs are expensive. In 2017 the estimated average cost of a fire engine response to a medical incident was $1,970, while the average cost of an ambulance run was $486.42 When ambulance reimbursements are factored in, the unit cost of an ambulance run is reduced to $335. The City spends about six times as much for CFR-D level care offered by a fire engine company than for paramedic or EMT level care and transport offered by an ambulance.
Fire engine runs are expensive because fire engines are staffed with four or five firefighters and an officer, compared to two EMTs or paramedics in an ambulance, and firefighters have higher average salaries and more generous pension and retiree health insurance benefits. The average salary of a firefighter, excluding overtime, was $73,913 in fiscal year 2017, 1.7 times that of an EMT and 1.2 times that of a paramedic.43 While firefighters have similar starting salaries to EMTs and paramedics, their base salary almost doubles after five years of employment to reach $85,292. Top pay for an EMT is approximately 60 percent of that of a firefighter, and top pay for a paramedic is 75 percent of that of a firefighter. (See Table 3.)

The use of fire engines is also problematic because it does not reduce ambulance workloads. An ambulance always accompanies a fire engine in case patient transport is required—as is usually the case. This has increased service redundancy: the number of vehicle runs for medical incidents increased 15.9 percent between 2014 and 2017, while the number of incidents grew 8.1 percent.44
Another important concern is the limited nature of assistance that firefighters are able to provide at the scene of a medical incident. In 2017 when a fire engine responded to a medical incident, patient care was provided in only 2.0 percent of incidents, while assistance is labeled as “action taken, other” for 97.0 percent. Astonishingly, out of the 281,000 fire engine company runs, in only 72 instances (0.04 percent) was a defibrillator used.45 The reliance on first responders who cannot transport also ignores research suggesting that for many critical incidents, particularly acute trauma, what matters most is not how quickly staff arrives at the scene, but how quickly the patient is transported to an ER.46
Despite their high cost and limited effectiveness, the use of engine companies as responders to medical incidents has been continued by FDNY as a pretext for sustaining the staffing of otherwise unnecessary fire engine companies. In 2010 the Bloomberg Administration unsuccessfully proposed closing 15 fire engine companies primarily due to the declining workload related to fires and other emergencies, but the president of the Uniformed Firefighters Association argued at a New York City Council hearing that closing the companies would endanger lives because response times to medical incidents would increase.47
The City is falling short of a National Fire Protection Association benchmark that response to an incident requiring ALS care should be by an ALS ambulance within 9 minutes at least 90 percent of the time.48 The FDNY historically has held itself to a lower standard of ALS response of 10 minutes 90 percent of the time; according to the FDNY, in 2017 only 57.6 percent of ALS responses to ALS incidents met that benchmark.49 In fiscal year 2011 this figure was significantly better at 80.5 percent.50
A Major Revitalization Initiative Should Replace Piecemeal Reforms
The FDNY has taken steps to improve EMS by introducing Fly Cars, funding additional tours, and reducing turnaround times at hospitals.51 These reforms are worthwhile, but more dramatic changes are needed to realign the FDNY’s substantial resources to its workload. Doing so would improve service quality without additional cost and potentially also yield taxpayer savings. An effective revitalization strategy requires three elements.
1. Follow the lead of other cities to design and implement a program to reduce unnecessary use of EMS.
Many cities have begun to implement programs to reduce unnecessary EMS use. Some programs, such as one in Reno, Nevada, use nurses to take 9-1-1 calls to assess whether the patient requires emergency care, and to link callers with non-ER resources when appropriate.52 The City of Houston has implemented a telehealth program in which arriving EMS staff assesses whether a situation is a genuine emergency and can consult an emergency physician via video. If the physician confirms there is no emergency, EMS staff works with the patient to connect to appropriate sources of care.53 In Dallas, the EMS department makes proactive community health visits to frequent fliers and has seen an 82 percent reduction in enrolled patients’ use of EMS.54
These efforts would build on New York State’s Delivery System Reform Incentive Payment Program through which the State incentivizes hospitals to reduce unnecessary care by penalizing providers for potentially preventable readmissions and could be pursued in coordination with New York City Health + Hospitals, which is currently pivoting to community-based outpatient care.55 The FDNY could also take advantage of the New York State Health Home program that already provides community health care visits for Medicaid enrollees with chronic conditions.56 Reducing unnecessary use is actually something system users would appreciate–survey research in New York City found that 58 percent of EMS patients with low acuity conditions supported transport to a medical provider other than the ER, and 71 percent of respondents agreed that EMS should do an evaluation and then advise on whether transport to a hospital is necessary.57 A program could also make use of the proliferation of urgent care centers in New York City by directing callers for whom it is appropriate to these facilities rather than dispatching an ambulance for transport.58
The FDNY should better understand the EMS patient population. The size and diversity of New York City always adds to the complexity of policy innovation, but it also magnifies the benefits of change. Every 10 percent reduction in incidents would allow for a downsizing in BLS capacity that could generate an estimated $58.5 million in savings.59
2. Enable one paramedic to staff ALS ambulances so that more are available to respond to the most time sensitive, life threatening incidents.
Reversing REMSCO’s policy that New York City ALS ambulances must have two paramedics would allow the City to assign one paramedic and one EMT, as is the practice in the rest of the state.60 The City could then transform some BLS ambulances into ALS ambulances at little additional cost. Because the most critical incidents typically are responded to by more than one ambulance there would still be more than one paramedic on the scene in those cases. The resulting increase in ALS ambulances would shorten response times to the most critical incidents, and ultimately may obviate the need for fire engine response to medical incidents in its entirety.
This staffing change would also address the City’s current shortage of paramedics. In 2017 there were 5.2 EMTs for every BLS tour, and only 4.0 paramedics for every ALS tour, contributing to a substantial uptick in paramedic overtime.61 Moreover, if the Fly Car pilot proves to be a successful model, moving to a one paramedic/one EMT ALS configuration would free up more paramedics to join the Fly Car program.
3. Significantly reduce the role of fire engines in responding to medical incidents and shift resources to Emergency Medical Service.
The role of fire companies in responding to medical incidents should be scaled back to focus solely on the most critical incidents where their CFR-D skills are most relevant and where their presence will make a difference. The most expansive estimate of an appropriate workload is incidents of anaphylactic shock, cardiac arrest, choking, stroke, difficulty breathing, respiratory distress, and status epilepticus; these are conditions for which response time has a significant impact on morbidity and mortality.62 There were 199,000 such emergencies in 2017, while fire engines responded to 281,000 incidents. Confining fire engine responses to the most critical incidents would have reduced the number of medical runs by fire engines 29.2 percent and reduced total engine runs by 11.3 percent. If ALS resources were increased, the use of fire engines could be further scaled back with the goal of eventually eliminating all redundant responses.
Reducing the role of fire engines in medical incidents will not create savings without scaling back the number of engine companies. The City should conduct a thorough assessment of the location, coverage, and workload of fire companies; while nonmedical, nonfire emergencies have been on the rise, the precipitous decline in fires and dramatic changes in building density and demographics since many fire houses were built have reduced workloads of several fire companies. Such an assessment should identify where companies could safely close without jeopardizing response times to any type of emergency.63 For every fire engine company closed, the city would save $7.2 million annually, enough to fund 10 additional ambulance tours each day.64
Conclusion
The FDNY’s work is critical, but its resources are not deployed optimally to handle the department’s workload. Workload trends—fewer fires and more medical incidents—are likely to continue. By reorienting itself to better address medical incidents and by taking advantage of excess resources still devoted to fire extinguishment, the FDNY has the opportunity to both reassure New Yorkers that appropriate care will be available when they face a medical emergency and that their tax dollars are not misdirected to sustain unnecessary fire engine companies.
Footnotes
- A Segment 9 for transporting deceased individuals is not included in the analysis. See: Fire Department of the City of New York, Citywide Performance Indicators: Year Report (2017), www1.nyc.gov/site/fdny/about/resources/data-and-analytics/citywide-statistics.page.
- EMS data defines these incidents as “history of drug/alcohol abuse.”
- Segment 8 not included as it includes events where ambulances are on “standby.
- The number of life threatening incidents grew from 48 per 1,000 residents in 2000 to 66 per 1,000 residents in 2017; non-life threatening incidents grew from 86 to 104 per 1,000 residents over the same period. CBC staff analysis of data from American Fact Finder, Community Facts, “Annual Population Estimates” (accessed September 25, 2018), https://factfinder.census.gov/faces/nav/jsf/pages/community_facts.xhtml; and NYC OpenData, “EMS Incident Dispatch” (accessed September 24, 2018, last updated September 13, 2018), https://data.cityofnewyork.us/Public-Safety/EMS-Incident-Dispatch-Data/76xm-jjuj/data.
- New York City’s over-65 population grew 19.5 percent between 2000 and 2017, while the under-65 population grew only 6.1 percent. CBC staff analysis of data from American Fact Finder, Community Facts, “Annual Population Estimates” (accessed September 25, 2018), https://factfinder.census.gov/faces/nav/jsf/pages/community_facts.xhtml; and National Highway Traffic Safety Administration, Office of the Assistant Secretary for Preparedness and Response, Health Resources and Services Administration, Innovation Opportunities for Emergency Medical Services: A Draft White Paper (July 15, 2013), p. 6, www.ems.gov/pdf/2013/EMS_Innovation_White_Paper-draft.pdf.
- Charles Courtemanche, Andrew Friedson, and Daniel I. Rees, Ambulance Utilization in New York City after the Implementation of the Affordable Care Act (National Bureau of Economic Research, April 2018), p. 12, www.nber.org/papers/w24480.
- The number of drug abuse related “altered mental status” incidents grew 28.4 percent between 2014 and 2015; the number of “major injury” cases grew 158.9 percent in that same period, suggesting a change in segmentation protocol. See: NYC OpenData, “EMS Incident Dispatch” (accessed September 24, 2018, last updated September 13, 2018), https://data.cityofnewyork.us/Public-Safety/EMS-Incident-Dispatch-Data/76xm-jjuj/data.
- Ambulance response data includes incidents responded to by private ambulance companies in coordination with FDNY dispatch. Volunteer neighborhood-based ambulances are not dispatched in response to 9-1-1 calls. See: Fire Department of the City of New York, Citywide Performance Indicators: Year Report (2017)www1.nyc.gov/site/fdny/about/resources/data-and-analytics/citywide-statistics.page; and City of New York, Mayor’s Office of Operations, Mayor’s Management Report (September 2018), p. 69, www1.nyc.gov/assets/operations/downloads/pdf/mmr2018/2018_mmr.pdf.
- CBC staff analysis of data from FDNewYork, “Runs and Workers Sub-Menu” (accessed September 24, 2018), www.fdnewyork.com/rnwindex.asp; and Fire Department of the City of New York, Citywide Performance Indicators: Year Report (2017), www1.nyc.gov/site/fdny/about/resources/data-and-analytics/citywide-statistics.page.
- District Council 37, AFSCME, AFL-CIO, and its affiliated Locals 3621 and 2507 v. The City of New York and the Fire Department of the City of New York, 11 OCB2d 10 (Board of Collective Bargaining, 2018), www.ocb-nyc.org/uploads/files/11-OCB2d-10-BCB-2018-L7Q.pdf.
- Mina Addo, Twenty Years Later: Integrating Services In The New York City Fire Department (Citizens Budget Commission, December 2015), https://cbcny.org/research/twenty-years-later.
- Council of the City of New York, Report of the Finance Division on the Fiscal 2018 Preliminary Budget and the Fiscal 2017 Preliminary Mayor’s Management Report for the Fire Department of New York (March 9, 2017), pp. 7-16, http://council.nyc.gov/budget/wp-content/uploads/sites/54/2017/03/057-FDNY.pdf.
- District Council 37, AFSCME, AFL-CIO, and its affiliated Locals 3621 and 2507 v. The City of New York and the Fire Department of the City of New York, 11 OCB2d 10 (Board of Collective Bargaining, 2018), www.ocb-nyc.org/uploads/files/11-OCB2d-10-BCB-2018-L7Q.pdf.
- Sec. 3003 of the New York State Public Health Law, P.L.; and City of New York, Independent Budget Office, Budget Options for New York City (November 2015), p. 15, www.ibo.nyc.ny.us/iboreports/options2014.pdf.
- Fire Department of the City of New York, “Local Law 119 Compliance” (accessed September 24, 2018), www1.nyc.gov/site/911reporting/reports/local-law-119-compliance.page.
- In 12.0 percent of circumstances patients refused medical aid, in 9.0 percent the incident was determined to be unfounded, in 3.6 percent of cases the patient was not found on arrival, and in about 5.0 percent of incidents transport was not required for other reasons. See: NYC OpenData, “EMS Incident Dispatch” (accessed September 24, 2018, last updated September 13, 2018), https://data.cityofnewyork.us/Public-Safety/EMS-Incident-Dispatch-Data/76xm-jjuj/data.
- Fire engine and ladder companies have different responsibilities. At the scene of a fire, engines are responsible for pumping water while fire ladders engage in fire ventilation and search and rescue.
- Not all firefighters are required to be certified as CRF-D; only those assigned to engine companies. Many firefighters are former paramedics and EMTs, and therefore have those skills; however, most do not keep their EMT/paramedic certificates up to date and are otherwise prohibited from performing more advanced care than CFR-D level; nor do they have the equipment to do so.
- Response times are measured from the moment the incident is logged into the FDNY Dispatch system to when the first unit arrives on scene. Response time data includes only instances when the fire engines arrived before the ambulances, but average response times for all runs by fire engines are lower than for ambulances. The main difference in response time between fire engines and ambulances appears to be due to shorter travel times once the unit is assigned to an incident, rather than differences in how quickly units are assigned. Fire Department of the City of New York, “Local Law 119 Compliance” (accessed September 24, 2018), www1.nyc.gov/site/911reporting/reports/local-law-119-compliance.page.
- NYC OpenData, “Fire Incident Dispatch Data” (accessed September 24, 2018, last updated September 13, 2018), https://data.cityofnewyork.us/Public-Safety/Fire-Incident-Dispatch-Data/8m42-w767, “EMS Incident Dispatch” (accessed September 24, 2018, last updated September 13, 2018), https://data.cityofnewyork.us/Public-Safety/EMS-Incident-Dispatch-Data/76xm-jjuj/data.
- FDNewYork, “Runs and Workers Sub-Menu” (accessed September 24, 2018), http://www.fdnewyork.com/rnwindex.asp.
- Fire Department of the City of New York, Citywide Performance Indicators: Year Report (2017) www1.nyc.gov/site/fdny/about/resources/data-and-analytics/citywide-statistics.page; Mina Addo, Twenty Years Later: Integrating Services In The New York City Fire Department (Citizens Budget Commission, December 2015), https://cbcny.org/research/twenty-years-later; and District Council 37, AFSCME, AFL-CIO, and its affiliated Locals 3621 and 2507 v. The City of New York and the Fire Department of the City of New York, 11 OCB2d 10 (Board of Collective Bargaining, 2018), www.ocb-nyc.org/uploads/files/11-OCB2d-10-BCB-2018-L7Q.pdf.
- Bob Hennelly, “BCB: FDNY Must Talk Before Using ‘Fly Cars’”, The Chief Leader (June 11, 2018), http://thechiefleader.com/news/news_of_the_week/bcb-fdny-must-talk-before-using-fly-cars/article_90b12318-6b32-11e8-b19d-5371ca757759.html.
- Bernard O’Brien, With More Ambulances on the Streets, Response Times to Serious Medical Emergencies Improve (City of New York, Independent Budget Office, June 2013), www.ibo.nyc.ny.us/iboreports/ems2013.html.
- CBC staff analysis of data from Fire Department of the City of New York, Citywide Performance Indicators: Year Report (2017), and 2014 to 2016 editions, and ; and “Local Law 119 Compliance” (accessed September 24, 2018), www1.nyc.gov/site/911reporting/reports/local-law-119-compliance.page; and Council of the City of New York, Report on the Fiscal 2017 Preliminary Budget and the Fiscal 2016 Preliminary Mayor’s Management Report: Fire Department (March 2016), p. 6, Report of the Finance Division on the Fiscal 2018 Preliminary Budget and the Fiscal 2017 Preliminary Mayor’s Management Report for the Fire Department of New York (March 2017), p. 7, and Report of the Finance Division on the Fiscal 2019 Preliminary Budget and the Fiscal 2018 Preliminary Mayor’s Management Report for the Fire Department of New York (March 2018), p. 12.
- Fire extinguishment costs were apportioned to emergency medical response by applying the ratio of fire engine medical runs as a share of total fire company runs (20.9 percent) to the total fire extinguishment budget of $1.4 billion.
- CBC staff analysis of Mayor’s Office of Management and Budget, Fiscal Year 2019 Executive Budget Message of the Mayor (April, 2018), p. 149, www1.nyc.gov/assets/omb/downloads/pdf/mm4-18.pdf.
- There were 1.5 million incidents, but for only 1 million were services provided. In other instances the patient was dead on arrival, the call was canceled, the patient refused medical aid, or the patient was no longer at the scene when the ambulance arrived. See: NYC OpenData, “EMS Incident Dispatch” (accessed September 24, 2018, last updated September 13, 2018), https://data.cityofnewyork.us/Public-Safety/EMS-Incident-Dispatch-Data/76xm-jjuj/data.
- Dustin W. Ballard and others, “Validation of an algorithm for categorizing the severity of hospital emergency department visits,” Medical Care, vol. 48, issue 1 (January 2010), pp. 58-63, www.ncbi.nlm.nih.gov/pmc/articles/PMC3881233/.
- FF Palazzo and others, “Misuse of the London ambulance service: How much and why?” Emergency Medicine Journal, vol. 15, issue 6 (November 1988), pp. 368-370, https://emj.bmj.com/content/15/6/368; and AJ Billittier and others, “A multisite survey of factors contributing to medically unnecessary ambulance transports,” Academy of Emergency Medicine, vol. 3, issue 11 (November 1996), pp. 1046-1052, www.ncbi.nlm.nih.gov/pubmed/8922014.
- Eric Brown and Jody Sindelar, “The emergent problem of ambulance misuse,” Annals of Emergency Medicine, vol. 22, issue 4 (April 1993), pp. 646-650, www.sciencedirect.com/science/article/pii/S0196064405818414; and Zachary F. Meisel and others, “Variations in Ambulance Use in the United States: the Role of Health Insurance,” Academic Emergency Medicine: Official Journal of the Society for Academic Emergency Medicine, vol. 18, issue 10 (October 2011), pp. 1036-1044, www.ncbi.nlm.nih.gov/pmc/articles/PMC3196627/#.
- National Highway Traffic Safety Administration, Office of the Assistant Secretary for Preparedness and Response, Health Resources and Services Administration, Innovation Opportunities for Emergency Medical Services: A Draft White Paper (July 15, 2013), p. 5, www.ems.gov/pdf/2013/EMS_Innovation_White_Paper-draft.pdf.
- Jennifer Bresnick, “How Many Emergency Department Visits are Really Avoidable?” Health Analytics (September 5, 2017), https://healthitanalytics.com/news/how-many-emergency-department-visits-are-really-avoidable.
- Colleen J. Buono and James V. Dunford, “Urban EMS Systems,”EMS Systems, www.emergencymedicine.pitt.edu/sites/default/files/Urban%20EMS%20Systems.pdf.
- Jennifer Brokaw and others, “Repeated ambulance use by patients with acute alcohol intoxication, seizure disorder, and respiratory illness,” The American Journal of Emergency Medicine, vol. 16, issue 2 (March 1998), pp. 141-144, www.ajemjournal.com/article/S0735-6757(98)90031-6/fulltext.
- City of New York, Mayor’s Office of Operations, Mayor’s Management Report (September 2018), www1.nyc.gov/assets/operations/downloads/pdf/mmr2018/2018_mmr.pdf.
- Xun Li and Cem Saydam, “Balance Ambulance Crew Workloads Via A Tiered Dispatch Policy,” Pesquisa Operacional, vol. 36, no. 3, (December 2016), www.scielo.br/scielo.php?script=sci_arttext&pid=S0101-74382016000300399.
- City of New York, Mayor’s Office of Operations, Mayor’s Management Report (September 2017), www1.nyc.gov/assets/operations/downloads/pdf/mmr2017/2017_mmr.pdf.
- NYC OpenData, “EMS Incident Dispatch” (accessed September 24, 2018, last updated September 13, 2018), https://data.cityofnewyork.us/Public-Safety/EMS-Incident-Dispatch-Data/76xm-jjuj/data.
- Resuscitation rates have since improved to 30 percent in fiscal year 2018. See: City of New York, Mayor’s Office of Operations, Mayor’s Management Report (September 2018), pp. 69-71, www1.nyc.gov/assets/operations/downloads/pdf/mmr2018/2018_mmr.pdf.
- Colleen J. Buono and James V. Dunford, “Urban EMS Systems,” EMS Systems, www.emergencymedicine.pitt.edu/sites/default/files/Urban%20EMS%20Systems.pdf.
- The unit cost is derived by dividing total expenditures by the total number of ambulance runs, including centrally funded expenditures. CBC staff analysis of data from City of New York, Mayor’s Office of Management and Budget, Fiscal Year 2019 Executive Budget Message of the Mayor (April 2018), p. 149, www1.nyc.gov/assets/omb/downloads/pdf/mm4-18.pdf; FDNewYork, “Runs and Workers Sub-Menu” (accessed September 24, 2018), http://www.fdnewyork.com/rnwindex.asp; and NYC OpenData, “EMS Incident Dispatch” (accessed September 24, 2018, last updated September 13, 2018), https://data.cityofnewyork.us/Public-Safety/EMS-Incident-Dispatch-Data/76xm-jjuj/data.
- NYC OpenData, “Citywide Payroll Data (Fiscal Year 2017)” (accessed September 24, 2018, last updated September 10, 2018), https://data.cityofnewyork.us/City-Government/Citywide-Payroll-Data-Fiscal-Year-/k397-673e/data.
- CBC staff analysis of data from FDNewYork, “Runs and Workers Sub-Menu” (accessed September 24, 2018), www.fdnewyork.com/rnwindex.asp; and Fire Department of the City of New York, Citywide Performance Indicators: Year Report (2017) www1.nyc.gov/site/fdny/about/resources/data-and-analytics/citywide-statistics.page.
- NYC OpenData, “Fire Incident Dispatch Data” (accessed September 24, 2018, last updated September 13, 2018), https://data.cityofnewyork.us/Public-Safety/Fire-Incident-Dispatch-Data/8m42-w767.
- Vincent D. Robbins, “Meaningful Metrics: How do We Measure Quality in EMS?” Journal of Emergency Medical Services, www.jems.com/articles/print/volume-43/issue-3/departments-columns/management-focus/meaningful-metrics.html.
- Testimony of Stephen Cassidy, President, United Firefighters Association, before the New York City Council Committee on Fire and Criminal Justice Services, (December 13, 2010), https://legistar.council.nyc.gov/LegislationDetail.aspx?ID=821765&GUID=BE7973FB-E074-4589-B581-6DE99C0317A5&Options=&Search=.
- David M. Williams, “200 City Survey. Is the Status Quo Acceptable?” Journal of Emergency Medical Services, vol. 33, issue 2 (February 2008), pp. 48-65, https://europepmc.org/abstract/med/18262076.
- Bernard O’Brien, With More Ambulances on the Streets, Response Times to Serious Medical Emergencies Improve (City of New York, Independent Budget Office, June 2013), www.ibo.nyc.ny.us/iboreports/ems2013.html.
- City of New York, Mayor’s Office of Operations, Mayor’s Management Report (September 2011), www1.nyc.gov/assets/operations/downloads/pdf/mmr/0911_mmr.pdf.
- Testimony of James Leonard, Chief of Department, Fire Department of the City of New York, before the New York City Council Fire and Criminal Justice Committee (February 23, 2016).
- Anna Gorman, “Paramedics Steer Non-Emergency Patients Away From ERs,” Kaiser Health News (May 18, 2015), https://khn.org/news/paramedics-steer-non-emergency-patients-away-from-ers-2/.
- Michael Gonzalez and others, “Houston EMS advances mobile integrated healthcare through the ETHAN program,” Journal of Emergency Medical Services, vol. 40, issue 11 (November 2015), www.jems.com/articles/print/volume-40/issue-11/features/houston-ems-advances-mobile-integrated-healthcare-through-the-ethan-program.html.
- Pepper Jeter, “Dallas MIH-CP Program Reduces Enrolled Patients’ Calls by 82%,” EMSWorld (May 12, 2016), www.emsworld.com/article/12207169/dallas-mih-cp-program-reduces-enrolled-patients-calls-by-82.
- Delivery System Reform Incentive Payment Program’s main purpose is to reduce avoidable hospital use by 25 percent between 2015 and 2020. New York State Department of Heath, “Delivery System Report Incentive Payment (DSRIP) Program,” (September 25, 2018), www.health.ny.gov/health_care/medicaid/redesign/dsrip/; and Testimony of Matthew Siegler, Senior Vice President, Managed Care, Patient Growth and Interim Lead for Government & Community Relations, NYC Health + Hospitals, before the New York City Council Committee on Hospitals, Changes in the Delivery of Health Care Services: Moving Towards a Community-Based Outpatient Model (October 3, 2018), www.nychealthandhospitals.org/new-york-city-council-hearing-changes-in-the-delivery-of-health-care-services-moving-towards-a-community-based-outpatient-model/.
- New York State Department of Heath, “Medicaid Health Homes – Comprehensive Health Management” (September 25, 2018), www.health.ny.gov/health_care/medicaid/program/medicaid_health_homes/.
- Any liability issues this raises for the City would have to be addressed, but the benefits would likely outweigh the risks. Kevin G. Munjal and others, “Patient Perspectives on EMS Alternate Destination Models” Prehospital Emergency Care, vol. 20, issue 6 (May 2016), www.tandfonline.com/doi/full/10.1080/10903127.2016.1182604.
- Ji Eun Chang and others, Convenient Care: Retail Clinics and Urgent Care Centers in New York (United Hospital Fund, February 2015), nyshealthfoundation.org/wp-content/uploads/2017/11/united-hospital-fund-convenient-care-report.pdf.
- The fully loaded cost of providing ambulance services totaled $585.2 million in fiscal year 2017; the savings estimate assumes that a reduction in incidents would allow for a similar reduction in ambulance expenditures. Savings estimate includes centrally budgeted pension, health insurance, and debt expenses.
- D. Ghilarducci, “Dual Paramedic vs. Single Paramedic Ambulances in Santa Cruz County,” (February 20, 2017), www.santacruzhealth.org/Portals/7/Pdfs/EMS/2017%20Paramedic%20Staffing%20FInal.pdf.
- NYC OpenData, “Citywide Payroll Data (Fiscal Year)” (accessed September 24, 2018, last updated September 10, 2018), https://data.cityofnewyork.us/City-Government/Citywide-Payroll-Data-Fiscal-Year-/k397-673e/data.
- Pomax, “A Service and Organizational Study of Toronto’s Emergency Medical Services and Fire Services: Final Report” (June 2013), p. 71, www.toronto.ca/legdocs/mmis/2013/ex/bgrd/backgroundfile-59903.pdf.
- In 2008 the Bloomberg Administration identified 15 fire engine companies that could close without jeopardizing public safety, but the closures were not implemented. See: Marcia Kramer, “Bloomberg Relents, Releases List Of Fire Houses Facing Ax: Speaker Quinn’s Threatened Lawsuit Proves Too Much To Bear,” CBS New York (May 18, 2011), https://newyork.cbslocal.com/2011/05/18/bloomberg-relents-releases-list-of-fire-houses-facing-the-ax/.
- Based on fully loaded annual cost to operate a fire engine and an ambulance. See: City of New York, Mayor’s Office of Operations, Mayor’s Management Report (September 2018), p. 69, www1.nyc.gov/assets/operations/downloads/pdf/mmr2018/2018_mmr.pdf.