Sustainably Supporting a Sound Basic Education
Proposals to Reform NYS School Aid
Contents


Summary
The State Constitution of New York guarantees every student in grades K-12 the right to a sound basic education (SBE). The State’s efforts to fulfill this obligation include providing substantial funding to school districts through Foundation Aid, expense-based aids (such as transportation and construction), and the School Tax Relief (STAR) program—which total $38.6 billion for the upcoming school year. These dollars should be allocated to help ensure all students have access to an SBE, while considering the importance of equity and the ability, willingness, and obligation of districts to fund education with their local resources.
Allocating resources effectively and fairly requires sound measurement of district needs, such as specialized need of students in each jurisdiction, each region’s relative costs of goods and services, student enrollment, and the local resources that can be and are used to support education. The State should make improvements in each of these areas to the current school aid formulas.
School aid reform is also important to the State’s fiscal future. With education funding comprising nearly 30 percent of State Operating Funds spending, ensuring education spending is fiscally sustainable is critical for the State’s fiscal health and its ability to provide the many of services and functions New Yorkers need and New York needs to thrive. The State’s structural budget gap will exceed $16 billion by fiscal year 2028, and spending restraint overall and in major expense areas is needed to avoid a fiscal reckoning.
While attention is primarily focused on Foundation Aid, which comprises nearly two-thirds of State school aid, effective resource allocation reform should address all funding streams, including the one-third allocated for various expense-based aids and the STAR program.
Within Foundation Aid, one major and often overlooked problem is that the formulas do not appropriately account for localities’ ability to pay—and perhaps even more importantly, their actual support of schools. This hampers the State’s ability to target school aid where resources are most needed. CBC has found that the State provides billions of dollars annually to many districts that can and do fully fund an SBE with local and federal revenue. In the 2023-24 school year, the State provided $2.8 billion to districts that fully fund an SBE before receiving a single dollar from the State.
Expense-based aids of $10.4 billion this year include funding for eligible school district expenditures on building construction and improvement, student transportation, vocational programs, and additional aid for districts with high cost-of-service delivery for students with disabilities. While many expense-based aid formulas incorporate a needs-based adjustment, some formulas distribute resources less progressively, and may even advantage wealthier districts that have the ability to spend more themselves.
Likewise, the structure of the STAR program, which uses State aid to backfill reduced school property taxes, generally allocates more resources per student to areas that have more local capacity to pay for education, since their property values are higher. This essentially directs State funds toward wealthier districts instead of maximizing funding to ensure an SBE for all districts.
Specifically, CBC has identified the following problems that should be rectified to improve the allocation of State school aid:
- The Foundation Aid formula falls short on directing aid to districts based on student needs and local capacity;
- The hold harmless provision provides funds even when the need goes down with enrollment declines;
- The expected local contribution does not fairly assess districts’ ability and willingness to pay;
- Outdated poverty and regional cost measures reduce the accuracy of each district’s estimated per-student cost; and
- Arbitrary floors and ceilings distort funding distributions;
- Expense-based aids similarly suffer from outdated indices, arbitrary caps, and inappropriate or inadequate measures of local wealth;
- Building aid and transportation aid disburse 15 percent of State education aid and warrant further study to ensure allocation is appropriately targeted based on need and local capacity;
- Minimum State funding shares limit effectiveness of distribution of Boards of Cooperative Educational Services (BOCES), vocational, and excess cost aids;
- Library, textbook and software aids do not adequately adjust for district wealth; and
- High tax aid directs funding mostly to higher wealth districts with no clear purpose; and
- The STAR program provides disproportionate benefits to wealthier districts.
CBC makes the following preliminary recommendations, which will be refined and presented in more detail at a later hearing. The State should:
- Quickly phase-out the hold harmless provision to align Foundation Aid with district enrollment;
- Revise the expected local contribution to be the higher of the district’s actual contribution, or the district’s fiscal capacity, which should be better measured;
- Update district poverty estimates and regional cost measures for a more accurate assessment of need;
- Remove arbitrary floors and ceilings that distort the funding distribution of Foundation Aid and expense-based aid categories;
- Adjust aid for library, textbooks, and software to account for district wealth either by modifying the formula or folding the funding into Foundation Aid;
- Eliminate High Tax aid; and
- Eliminate the School Tax Relief (STAR) program to better allocate State resources to where needed most.
We believe two other areas need improvement. However, CBC has not yet conducted sufficient research to provide specific recommendations, so these are not detailed in this report. One is that the factors used to provide extra resources for special student needs—such as for special education, English language learners, and possibly for unhoused students and others—should be carefully examined. They appropriately drive a lot of dollars, and getting this right is key to supporting districts to appropriately address all students’ needs. The other is the disconnect between State funding and district performance. CBC strongly believes that the State should take a more active role promoting performance, increasing transparency, and improving accountability, especially given the vast amount of resources provided and the criticality of education to New Yorkers’ and our state’s future.
Foundation Aid Formula Falls Short on Directing Aid to Districts Based on Student Needs and Local Capacity
CBC has identified four shortcomings that undermine the original intent to direct State education aid based on student need and local fiscal capacity. Holding districts harmless for enrollment declines provides higher than otherwise appropriate per-student funding to districts with declining enrollment and circumvents the intent of Foundation Aid. Foundation Aid’s construct of calculating districts’ ability to pay is poorly executed, demonstrated by the fact that many districts can and do pay more. Furthermore, outdated poverty and regional cost measures, as well as floors and ceilings within the formula, reduce the formula’s effectiveness in allocating Foundation Aid.
Hold Harmless Provision Decouples Funding from Enrollment in Certain Circumstances
By design, the hold harmless provision circumvents the Foundation Aid goal of allocating resources based on student need and local resources. It does so by ensuring that no district receives less Foundation Aid than they did in the year prior, even if enrollment declines or the district becomes wealthier.
Since the implementation of Foundation Aid, statewide enrollment has declined by more than 9 percent, with enrollment declining in 91 percent of districts. The hold harmless provision has led to some jarring outcomes. Most striking perhaps, in 17 districts whose enrollment has declined at least 40 percent since 2008, per-student Foundation Aid increased an average of 162 percent over that period, compared to an average of 115 percent in all other districts.
More broadly, per-student Foundation Aid has varied dramatically among districts in the same region with similar levels of relative local wealth but different enrollment trends. For example, enrollment in Shoreham-Wading River, a wealthy Long Island school district, declined by 30 percent from 2008 to the current school year, while enrollment in Manhasset, also a wealthy district on Long Island, increased by 1 percent. Per-student Foundation Aid increased by 168 percent for the former, but just 19 percent for the latter. Similarly, Albany City School District’s enrollment has increased by more than 20 percent since the introduction of Foundation Aid, while nearby Lansingburgh’s enrollment has fallen 16 percent. In its first year, Foundation Aid per student to the two districts, both relatively low income, differed by only $79. As enrollment trends diverged, so did per-student Foundation Aid funding; in the 2024-25 school year, Lansingburgh is set to receive over $3,000 more Foundation Aid per student than Albany.
CBC supported the Governor’s Fiscal Year 2025 Executive Budget proposal to eliminate the hold harmless provision, which ultimately was rejected. Given how clearly the hold harmless provision undermines the intent of formula-based allocation, it should be eliminated. Eliminating it now would significantly decrease funding to many districts that have been protected for years from adjusting to the impact of declining enrollment, but it is the right thing to do; a gradual phase-out, like the Governor proposed, could ease this transition.
Expected Local Contribution Does Not Fairly Assess Districts’ Ability and Willingness to Pay
The Foundation Aid formula’s expected local contribution is flawed. The expected minimum local contribution determines how much the district should be able to provide. The problem is two-fold.
- First, the calculation of minimum local contribution does not accurately measure each district’s capacity to raise local funds, as evidenced by the fact that many districts do pay more. The variety of different metrics for local contributions appears to be designed to maximize school aid for each district; and
- Second, it does not account for districts that willingly provide greater support than the formula calculates they can provide. Rather than effectively contributing to the calculation of what is needed from the State to support an SBE, thereby offsetting the State’s required aid, local funds provided to schools above the formula’s lowest local contribution estimate are added on top. If additional local funds offset State funding instead, those State resources could be used elsewhere or for another purpose and could target precious State dollars more effectively.
The current Foundation Aid formula calculates a district’s expected minimum local share several ways and ultimately uses the calculation that yields the lowest local contribution. One method is based on a ratio of district’s adjusted gross income per student compared to the statewide average, known as the Income Wealth Index (IWI). Using this method, a district with an IWI of 2 would be expected to contribute twice the local revenue per student of an average district. A second method uses one of four formulas to calculate a Foundation Aid State Sharing Ratio (FASSR), a combined ratio of a district’s local property wealth and adjusted gross income, adjusted by constant values set in the formulas. Currently, this second method is used by all districts.
In reality, the formula-derived local contribution is often significantly lower than a district’s actual local contribution. Of the two, the IWI method does a much better job approximating actual revenue generated by school districts, but neither is adequate. CBC estimates that statewide local revenue will total $46.2 billion in the coming school year. The IWI method would set the expected minimum local share at $35.1 billion, whereas using only the FASSRs method results in a statewide expected minimum local share of $21.0 billion.
The local contribution calculation should more closely approximate how much local revenue districts should be able to raise, and for those that districts that exceed the minimum local contribution, use their actual local contribution rather than a projected amount. This would better direct school aid to districts that need it most.
Clearly the current formula should be modified to better capture districts’ ability and willingness to pay, but additional research is needed to determine how to best calculate the local contribution. It is also important to note that, as with the elimination of the hold harmless provision, this change could cause dramatic reductions in Foundation Aid for some districts and a multi-year phase-in may be appropriate.
In addition, consideration also should be given to including not only a district’s ability and willingness to pay, but also its other local spending obligations. Localities often vary in their spending due to differing local preferences, which should not affect the State aid calculation. However, different exogenous demands on spending that may be driven by, for example, the health and social service needs due to having a higher portion of residents in poverty, may also be appropriate to consider.
Outdated Poverty and Regional Cost Measures Reduce the Accuracy of Each District’s Estimated Per-Student Cost
The Foundation Aid formula uses outdated indices to adjust for student needs and regional costs. This results in inaccurate estimates of the local cost of a quality education and a district’s student-weighted need. Districts receive higher or lower levels of per-student funding than they would if the formula were based on current conditions.1
The Foundation Aid formula has three main components: a State estimate of the district’s cost to provide students with a quality education, an estimate of the capacity of the school district to raise revenue locally, and a weighted measure of district enrollment that adjusts the cost based on the number of special education and summer students.2 The first of these, the cost of a quality education, is comprised of a basic statewide number that is adjusted by two important but outdated factors: a district-level index of extraordinary student needs, and a regional index to adjust for differences in the cost of delivering services.
The pupil needs index (PNI) is used to determine the relative needs of districts based on the proportion of students eligible for free and reduced-price lunch, the proportion of students who are English Language Learners (ELL), the poverty level in the local community, and a sparsity index. The share of students qualifying for free and reduced-price lunch and the share who are ELLs is updated annually and reflects current conditions in the district. However, the local poverty metric comes from the 2000 Census and does not reflect the demographic change of school districts over the past 24 years. As such, this dated metric now provides more funding to districts whose poverty rate has declined, while districts whose poverty rate has increased are underfunded. Furthermore, there is no obvious justification for adjusting the PNI for sparsity. The sparsity adjustment makes sense in cases such as student transportation costs but should not play a role in classroom student costs.
The Regional Cost Index (RCI), which adjusts Foundation Aid based on the cost of delivering service in the district’s region, has also been frozen since Foundation Aid was introduced. The RCI provides a unique multiplier for each of the state’s regions based on the cost of labor for jobs in fields other than education that require a similar level of credentials.3 Given the significant change in employment and wages across the state, this index is outdated and should be updated on a regular basis. Further analysis is needed to determine whether using nine regions is sufficiently localized, especially when New York City and Long Island are treated as one region.
These metrics should be updated and refined to best capture local needs and costs.
Arbitrary Floors and Ceilings Distort Funding Distributions
Floors and ceilings within the Foundation Aid formula circumvent the intent of the Foundation Aid formula and direct higher or lower per-student funding to a district than the formula would otherwise determine.
The formula itself has a minimum funding level of $500 per pupil unit, which means that districts capable of self-funding an SBE receive Foundation Aid regardless.4 In another example, the IWI, discussed above, is arbitrarily limited to a value between 0.65 and 2. This means that all school districts with adjusted gross income per student greater than twice the statewide average would only contribute twice the average revenue per student, even when some districts are significantly wealthier.
The caps should be limited to extreme circumstances and reassessed regularly to ensure they are not undermining the intent of the Foundation Aid formula.
Expense-Based Aids Suffer from Outdated Indices, Arbitrary Floors and Ceilings, and Inappropriate or Inadequate Measures of Local Wealth
The 21 formulas that allocate more than one-quarter of State education aid—nearly $11 billion in the upcoming school year—warrant scrutiny. (See Appendix Table.)
Some aid categories have minimum or maximum funding levels that can under- or over-fund a district based on its needs, or even provide funding at a fixed per-student level regardless of local capacity and need. Many of these formulas should be refined, and some of the funds may be better targeted if allocation by the Foundation Aid formula. Substantial funding streams for building aid and transportation aid are complex and CBC will further analyze these to identify whether and how they should be improved.
Minimum State Funding Shares Limit Effectiveness of Distribution of BOCES, Vocational, and Excess Cost Aids
Arbitrary floors on the State contribution for many expense-based aids result in higher funding to districts than would otherwise be necessary.
- BOCES aid has a minimum State contribution of 36 percent of expenses;
- For non-BOCES districts, the three alternative vocational aids have a minimum State contribution of either 30 percent or 36 percent; and
- Excess cost aids for special education expenses exceeding a minimum level also have minimum State contributions of 50 percent for Private School Excess Cost and 25 percent for Public School Excess Cost.
Together, these six expense-based aids allocate $2.7 billion in State aid. As a result, the State provides $20.6 million more for these expense-based aids than the formulas would otherwise determine, with around 81 percent of those funds currently flowing to districts among the wealthiest 40 percent of school districts.
These types of hard floors and ceilings can circumvent the intent of formula-based allocation; as with Foundation Aid, caps should be limited to extreme circumstances and reassessed regularly to ensure they are not leading to ineffective allocation of State resources.
Library, Textbook, and Software Aids Do Not Adequately Adjust for District Wealth
Providing funds on a per-student basis irrespective of local wealth undermines the ability to target State resources based on need and provides higher-than-needed funding to districts with greater local capacity.
While most formulas for expense-based aids include some district-wealth adjustment, the State provides aid for library services, textbooks, and software on a fixed dollar-per-student formula. Collectively, these three categories totaled $224 million in the 2024-25 school year.
Given the substantial local revenue inequality across districts, wealth should be accounted for when allocating this aid, either by adding an aid ratio adjustment to their existing formulas or by folding these funds into Foundation Aid.
High Tax Aid Directs Funding Mostly to Higher Wealth Districts and Lacks a Clear Purpose
Providing a fixed level of aid without a clear educational purpose can distribute funding inefficiently and provide aid to districts that have substantial local resources. High tax aid, which has totaled $223 million and been fixed since 2013-14, does not account for district wealth. In fact, this aid category allocates more funding to above average wealth districts ($179 per student) than to below average wealth districts ($114 per student). Furthermore, the original intent of this funding stream—to incentivize raising more local revenue—has likely been undermined as the allocation has been frozen since 2014.
This category of funding should be eliminated outright.
Building Aid and Transportation Aid Comprise 15 Percent of State Education Aid and Warrant Further Study to Ensure Allocation Is Appropriately Targeted Based on Need and Local Capacity
Building Aid and Transportation Aid are a substantial share of overall State education funding—$6 billion, over 15 percent of all aid—and they support critical school district expenses. Both funding categories are determined by districts’ aidable expenditures (defined by State Education Department rules), adjusted by a wealth ratio, and a third adjustment for each—a regional cost factor for Building Aid and the sparsity factor for Transportation Aid.
CBC is undertaking further research on these two funding streams to better understand how the formulas allocate aid, the extent to which the formulas successfully account for local need and capacity, and if any refinement should be recommended. This additional research will be shared at a later hearing.
The School Tax Relief (STAR) Program Provides Disproportionate Benefits to Wealthier Districts
The STAR program’s distribution of funds is regressive. It pays out or credits significantly more to homeowners in school districts with greater property values and excludes renters entirely. Additionally, it shifts more of the burden of education funding from school districts to the State, with the greatest shifts occurring in wealthier districts with greater capacity to raise revenue locally.
While initially a simple property tax exemption, STAR now comes in two forms: an exemption or a tax credit. The exemption reduces the assessed value of homeowner’s property for school district taxes. The tax credit–which has been phasing in to replace the exemption since 2016 –is paid out directly to homeowners from the State’s general fund at the same level as the value of the property tax exemption (a personal income tax rate reduction was also available in New York City until 2017). We estimate that next year, the program will cost $3.3 billion in total and pay around $2,000 per student in relatively wealthy counties like Putnam, Nassau, and Westchester, while paying out as little as $500 per student in Jefferson County.
Eliminating STAR would allow the State to allocate its precious resources where they are most needed, rather than toward wealthy school districts.
Recommendations
The Rockefeller Institute has been given a tremendous opportunity to identify solutions to improve the delivery of Foundation Aid to the districts that need it most, while eliminating State aid to districts that do not. However, Foundation Aid is not the only flawed piece of the school aid puzzle. We urge the Rockefeller Institute, as well as the State Legislature and Governor, to broaden consideration to expense-based aids and the STAR program. Our preliminary recommendations, which are being refined, are that the State should:
- Eliminate or phase-out the hold harmless provision to align Foundation Aid with district enrollment;
- Revise the expected local contribution calculation to better reflect districts' actual fiscal capacity and willingness to generate local resources, which should be better measured;
- Update district poverty estimates and regional cost measures for a more accurate assessment of need;
- Reassess arbitrary floors and ceilings to ensure they are limited to extreme situations and do not undermine the intent of allocating school aid based on need and local capacity;
- Adjust library, textbook, and software aids to account for district wealth either by modifying the formula or folding the funding into Foundation Aid;
- Eliminate High Tax aid, which is fixed and not tied to an educational expense; and
- Eliminate the School Tax Relief (STAR) program due to its regressive nature and significant cost.
These improvements to current formulas would better target precious State resources. Lawmakers should place a greater emphasis on ensuring that dollars are aligned to need and driving improvement in our schools.
Appendix
New York State Formula-Based School Aid per Student, by Wealth Decile and Aid Category
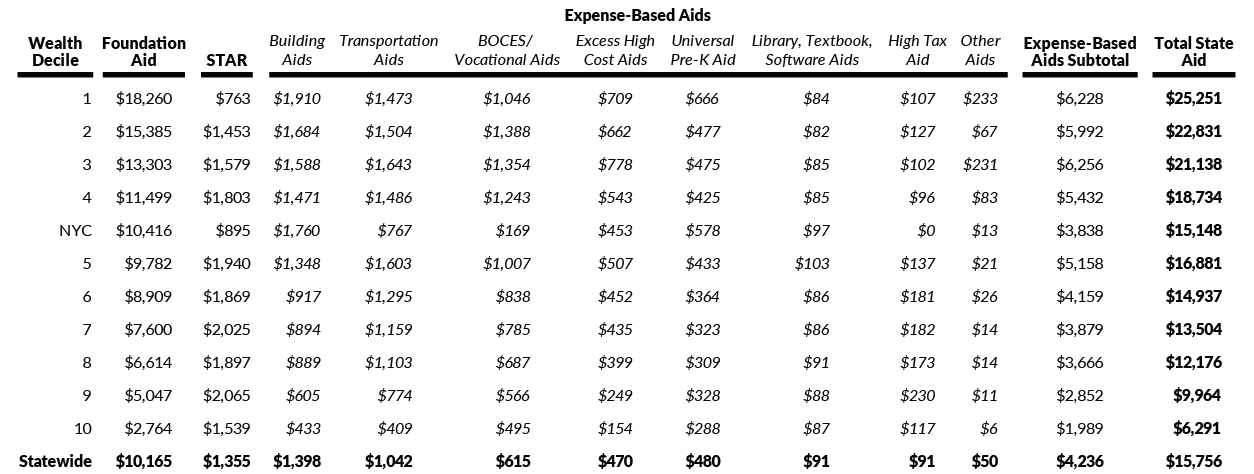
Building Aids includes regular Building Aid, and the $11.3 million Reorganization Incentive Building Aid. Transportation Aid includes regular Transportation Aid, and supplemental Summer Transportation Aid. BOCES/Vocational includes BOCES Aid allocated to districts that are components of a Board of Cooperative Educational Services (BOCES) for related costs, as well as three special service aid categories for the five large city school districts and other districts that are not components of a BOCES for services similar to those provided by a BOCES. Excess High Cost Aids includes both Public and Pivate Excess High Cost Aids, for special education costs for districts' students with disabilities. Universal Pre-K includes aids for Prekindergarten-related services. Library, Textbook, and Software Aids includes the three flat per-pupil aid categories for library, textbook, and software costs. High Tax Aid is a flat grant providing funding to districts with greater local tax-effort that has been frozen since 2014. Other Aids includes four formula-based aids not included in other categories: Charter School Transitional Aid, Operating Reorganization Aid, Building Aid for Computer Technology, and Academic Enhancement Aid.
New York State Education Department, Fiscal Analysis & Research Unit, "FY 2025 Enacted Budget School Aid Files" (received via email on April 22, 2024), and "Masterfile for 2021-22" (last updated October 30, 2023).
Technical Appendix
Spending Calculations and Estimates: Spending figures contain estimated funding for school year 2024-25 by district calculated as follows:
State: Includes all aid included in the 2024-25 school aid runs plus estimated School Tax Relief (STAR) gross program costs within the district (based on total planned STAR costs for school year 2024-25 proportional to actual STAR costs in school year 2021-22).
Local: Local funding is estimated based on actual local revenue from the 2021-22 Masterfiles increased by the allowable tax levy growth factor in each subsequent year and reduced by the personal income tax credit portion of STAR.
Sound Basic Education (SBE): Each district’s SBE amount is calculated by CBC by adding the “foundation amount” reported in school aid runs plus other expense-based aid for transportation, construction, and other costs for school year 2021-22 from Masterfiles inflated by CPI factors reported by the Office of the New York State Comptroller.
Wealth Decile Calculations: Wealth deciles are based on the average of a district’s free and reduced-price lunch share and census poverty share, divided by the district’s combined wealth ratio as determined by New York State Education Department (NYSED). The resulting figure is then indexed to the state average to determine a needs index.
Data Sources
School Aid Runs: New York State Education Department, Fiscal Analysis & Research Unit “FY 2025 Enacted Budget School Aid Files” (received via email on April 22, 2024).
School Aid Masterfiles: New York State Education Department, Fiscal Analysis & Research Unit “School District Fiscal Profiles” (last updated October 30, 2023), https://oms32.nysed.gov/faru/Profiles/2020-21_FiscalProfiles.html.
Historic Enrollment: New York State Education Department, “Enrollment Data Archive (1994-2011)” (last updated September 7, 2023), www.p12.nysed.gov/irs/statistics/enroll-n-staff/ArchiveEnrollmentData1994-2011.html.
Historic State School Aid: New York State Division of the Budget, “New York State School Aid: Beginning School Year 1996-97,” Open NY (last updated February 12, 2024), https://data.ny.gov/Government-Finance/New-York-State-School-Aid-Beginning-School-Year-19/9pb8-dg53/about_data.
Download Policy Brief
Sustainably Supporting a Sound Basic Education: Proposals to Reform NYS School AidFootnotes
- The cost of a quality education is based on the average per-pupil cost for a general education student in successful school districts; the first step in the formula adjusts this cost for student needs based on poverty and ELL, while the last step adjusts for special education and summer school students.
- TAFPU, the Total Aidable Foundation Aid Pupil Units, is calculated using current enrollment plus 0.12 per summer student, plus 1.41 per special education full-time enrollment (FTE) equivalent, plus 0.5 per general education student who was a special education student the prior year.
- Elsewhere, the regional cost index is described as an index of nine regions. This is because New York City and Long Island share a single regional cost index value.
- See note 2 for definition of TAFPU.