Reform at the Bargaining Table
Labor’s Participation Needed to Improve the MTA’s Financial Outlook
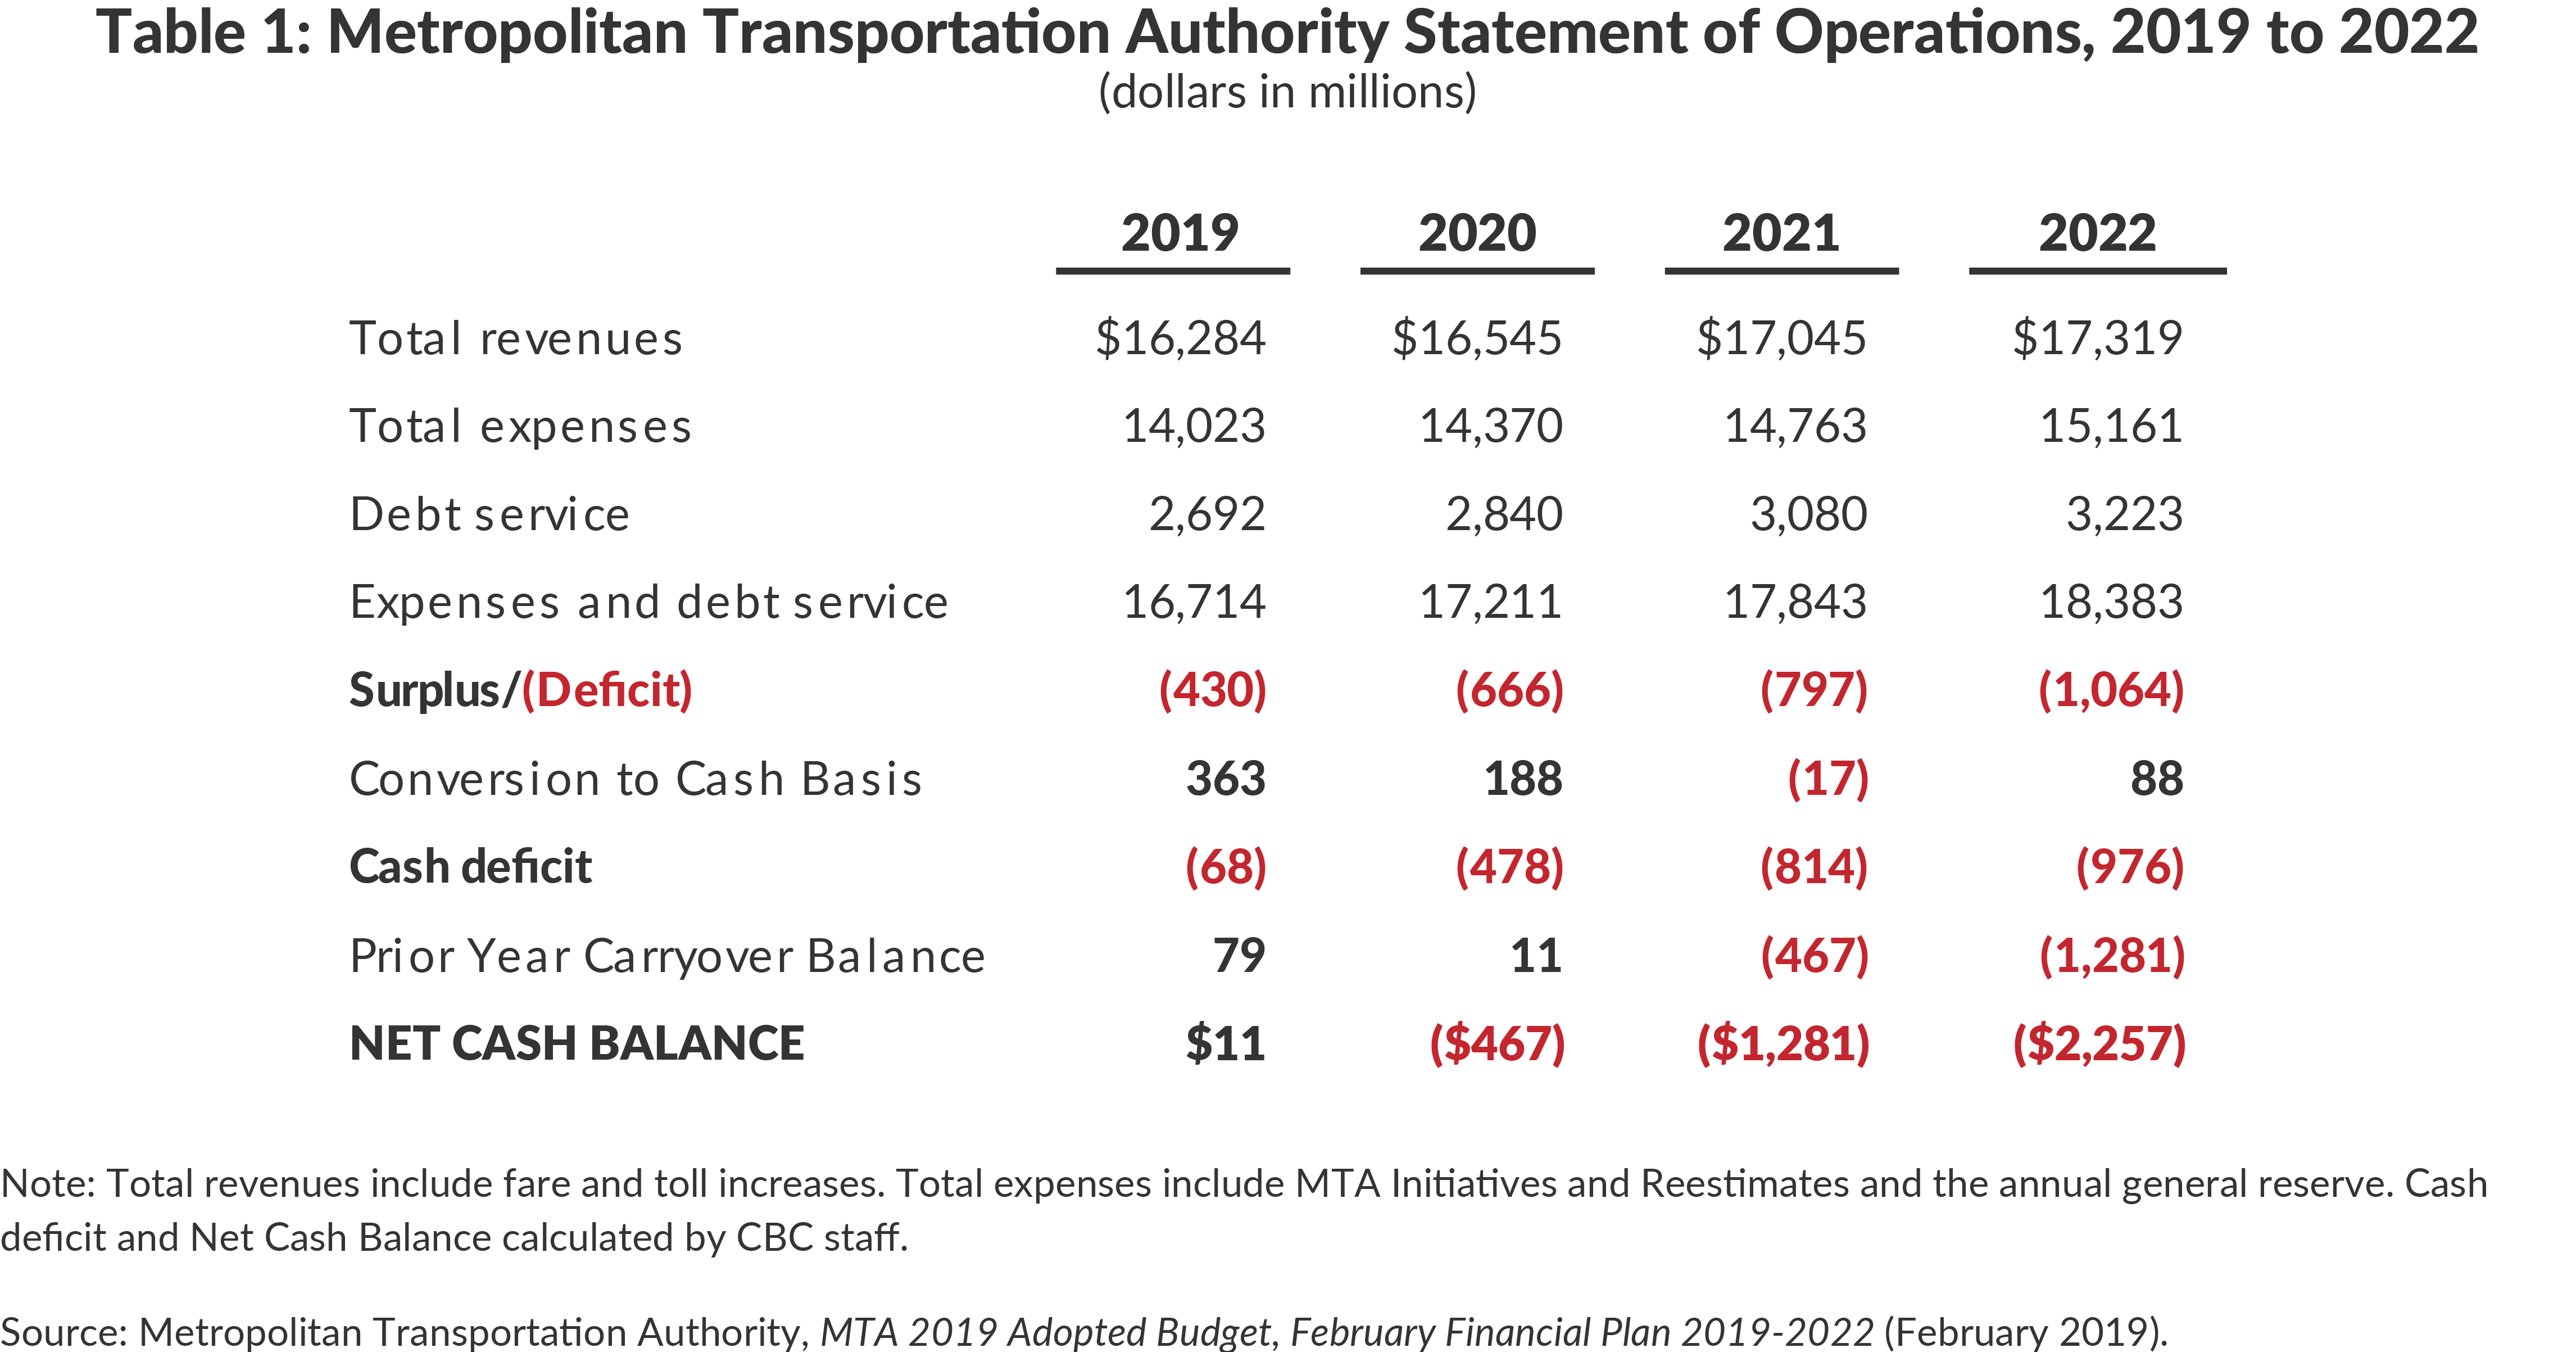
The Metropolitan Transportation Authority’s (MTA) fiscal outlook is dire. The latest update to the authority’s four-year financial plan projects annual cash deficits growing from $68 million this year to $976 million in 2022. End-of-year reported cash reserves will be exhausted next year, and in 2022 the authority will have a cumulative cash shortfall of nearly $2.3 billion. (See Table 1.)
Improving the MTA’s fiscal outlook requires a multipronged approach. With new revenue streams secured in the recent legislative session to support the capital program, the MTA should focus on controlling operating costs. Paramount in this effort is slowing the growth of labor costs, which in 2019 are expected to surpass $10 billion, or nearly three-fifths of the MTA’s operating budget.1
Contracts governing the vast majority of the authority’s unionized workforce are scheduled to expire this year. Notably the contract with the Transport Workers Union (TWU), which represents approximately 38,000 subway and bus workers, expires May 15; contracts with all Long Island Rail Road (LIRR) workers will expire in 2019, and contracts with approximately half of all unionized Metro-North Railroad (Metro-North) workers also will expire in 2019.2
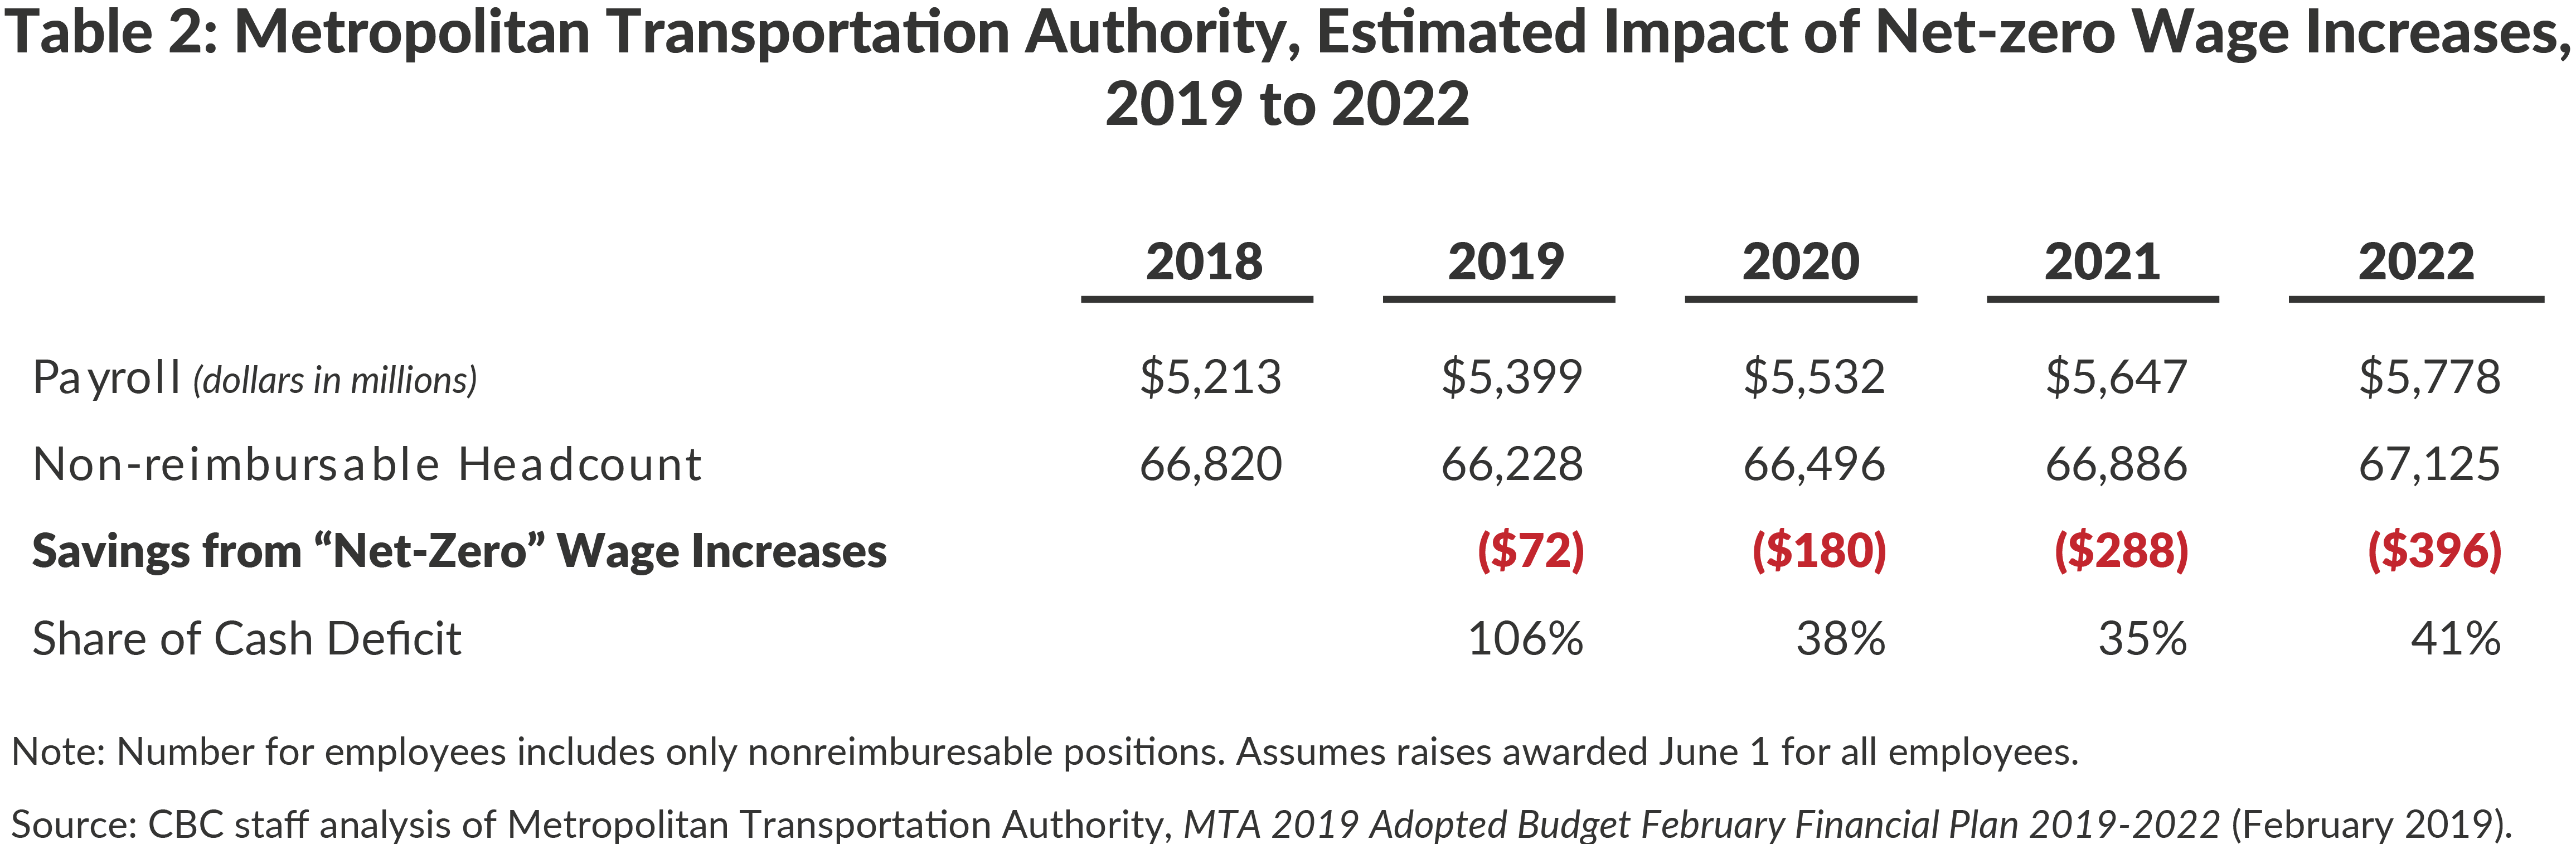
The MTA financial plan assumes all represented workers will receive 2 percent wage increases annually upon the expiration of the current contracts.3 In light of the troublesome fiscal outlook, this assumption should be revised; any pay increases should be conditioned on generating offsetting savings. Such agreements would save an estimated $72 million in 2019 growing to almost $400 million by 2022.(See Table 2.)
MTA Employee Pay in Context
As with other MTA stakeholders, workers have a vital interest in resolving this budget crisis. In difficult financial times it is not unusual for collective bargaining agreements to forgo raises. In the wake of the 2008 recession labor contracts with MTA, State, and City workers included years without wage increases as the public sector coped with substantial revenue shortfalls.4
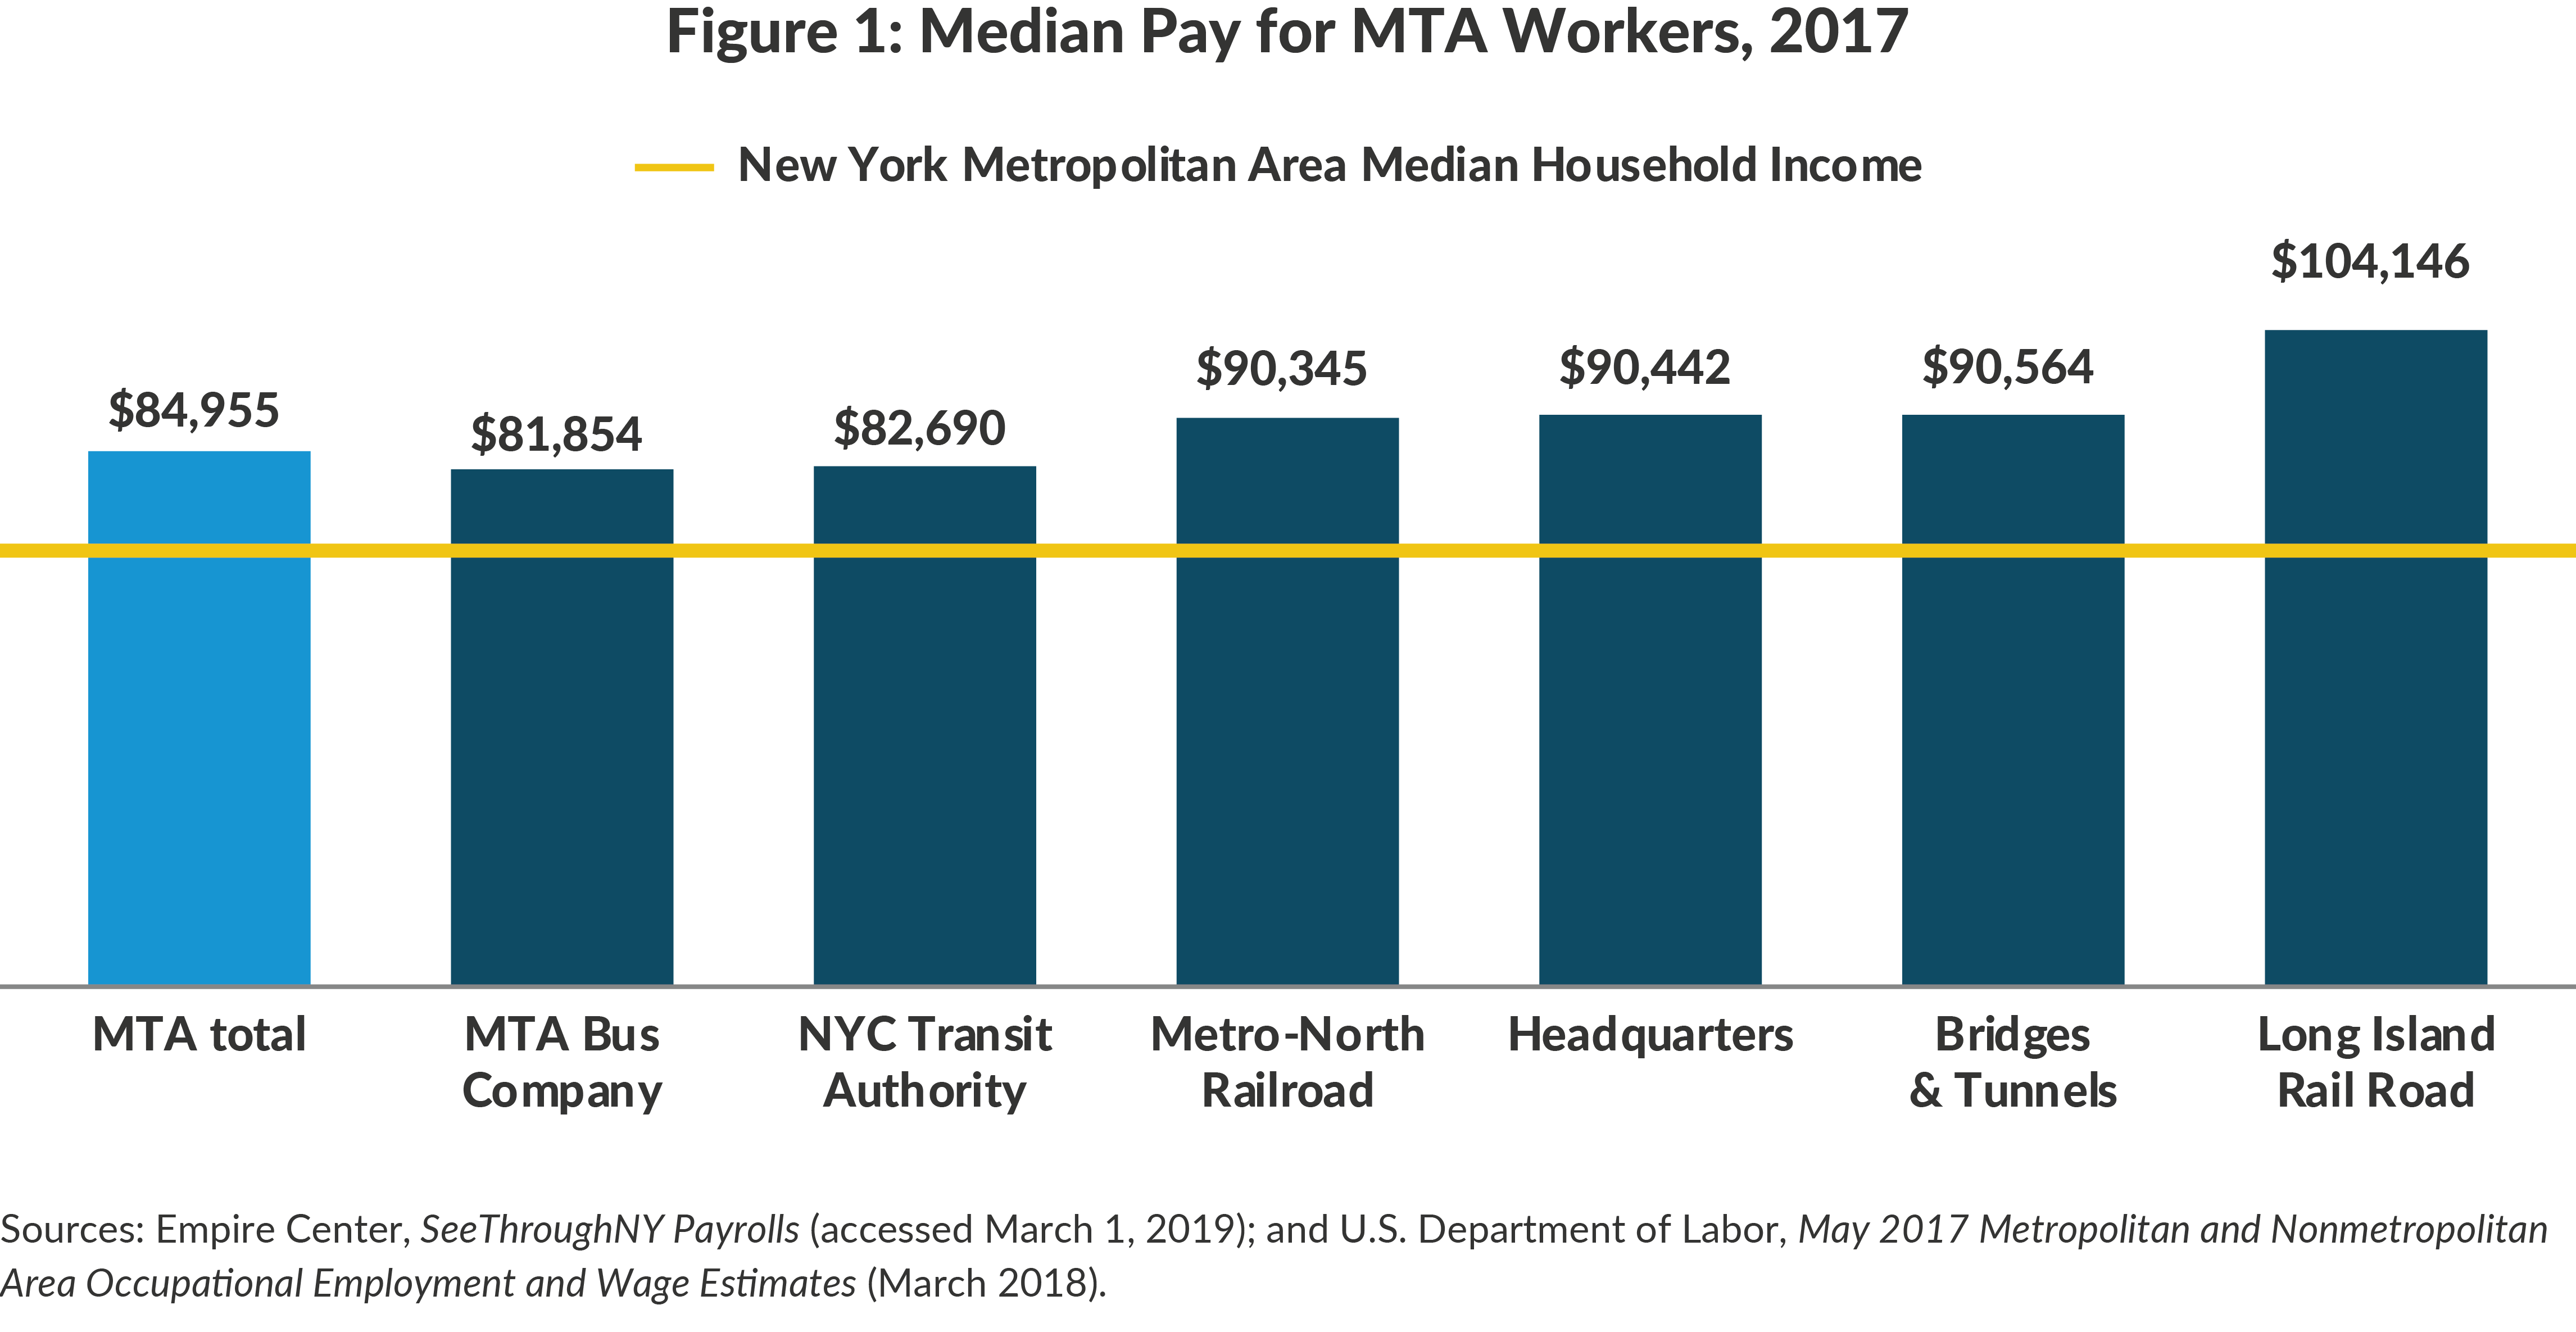
Average pay for MTA workers is already relatively high for the region. Median earnings for MTA workers in 2017 was $84,955.5 (See Figure 1.) This individual earnings amount is 18 percent greater than the median annual household income for the New York metropolitan area, $72,205.6
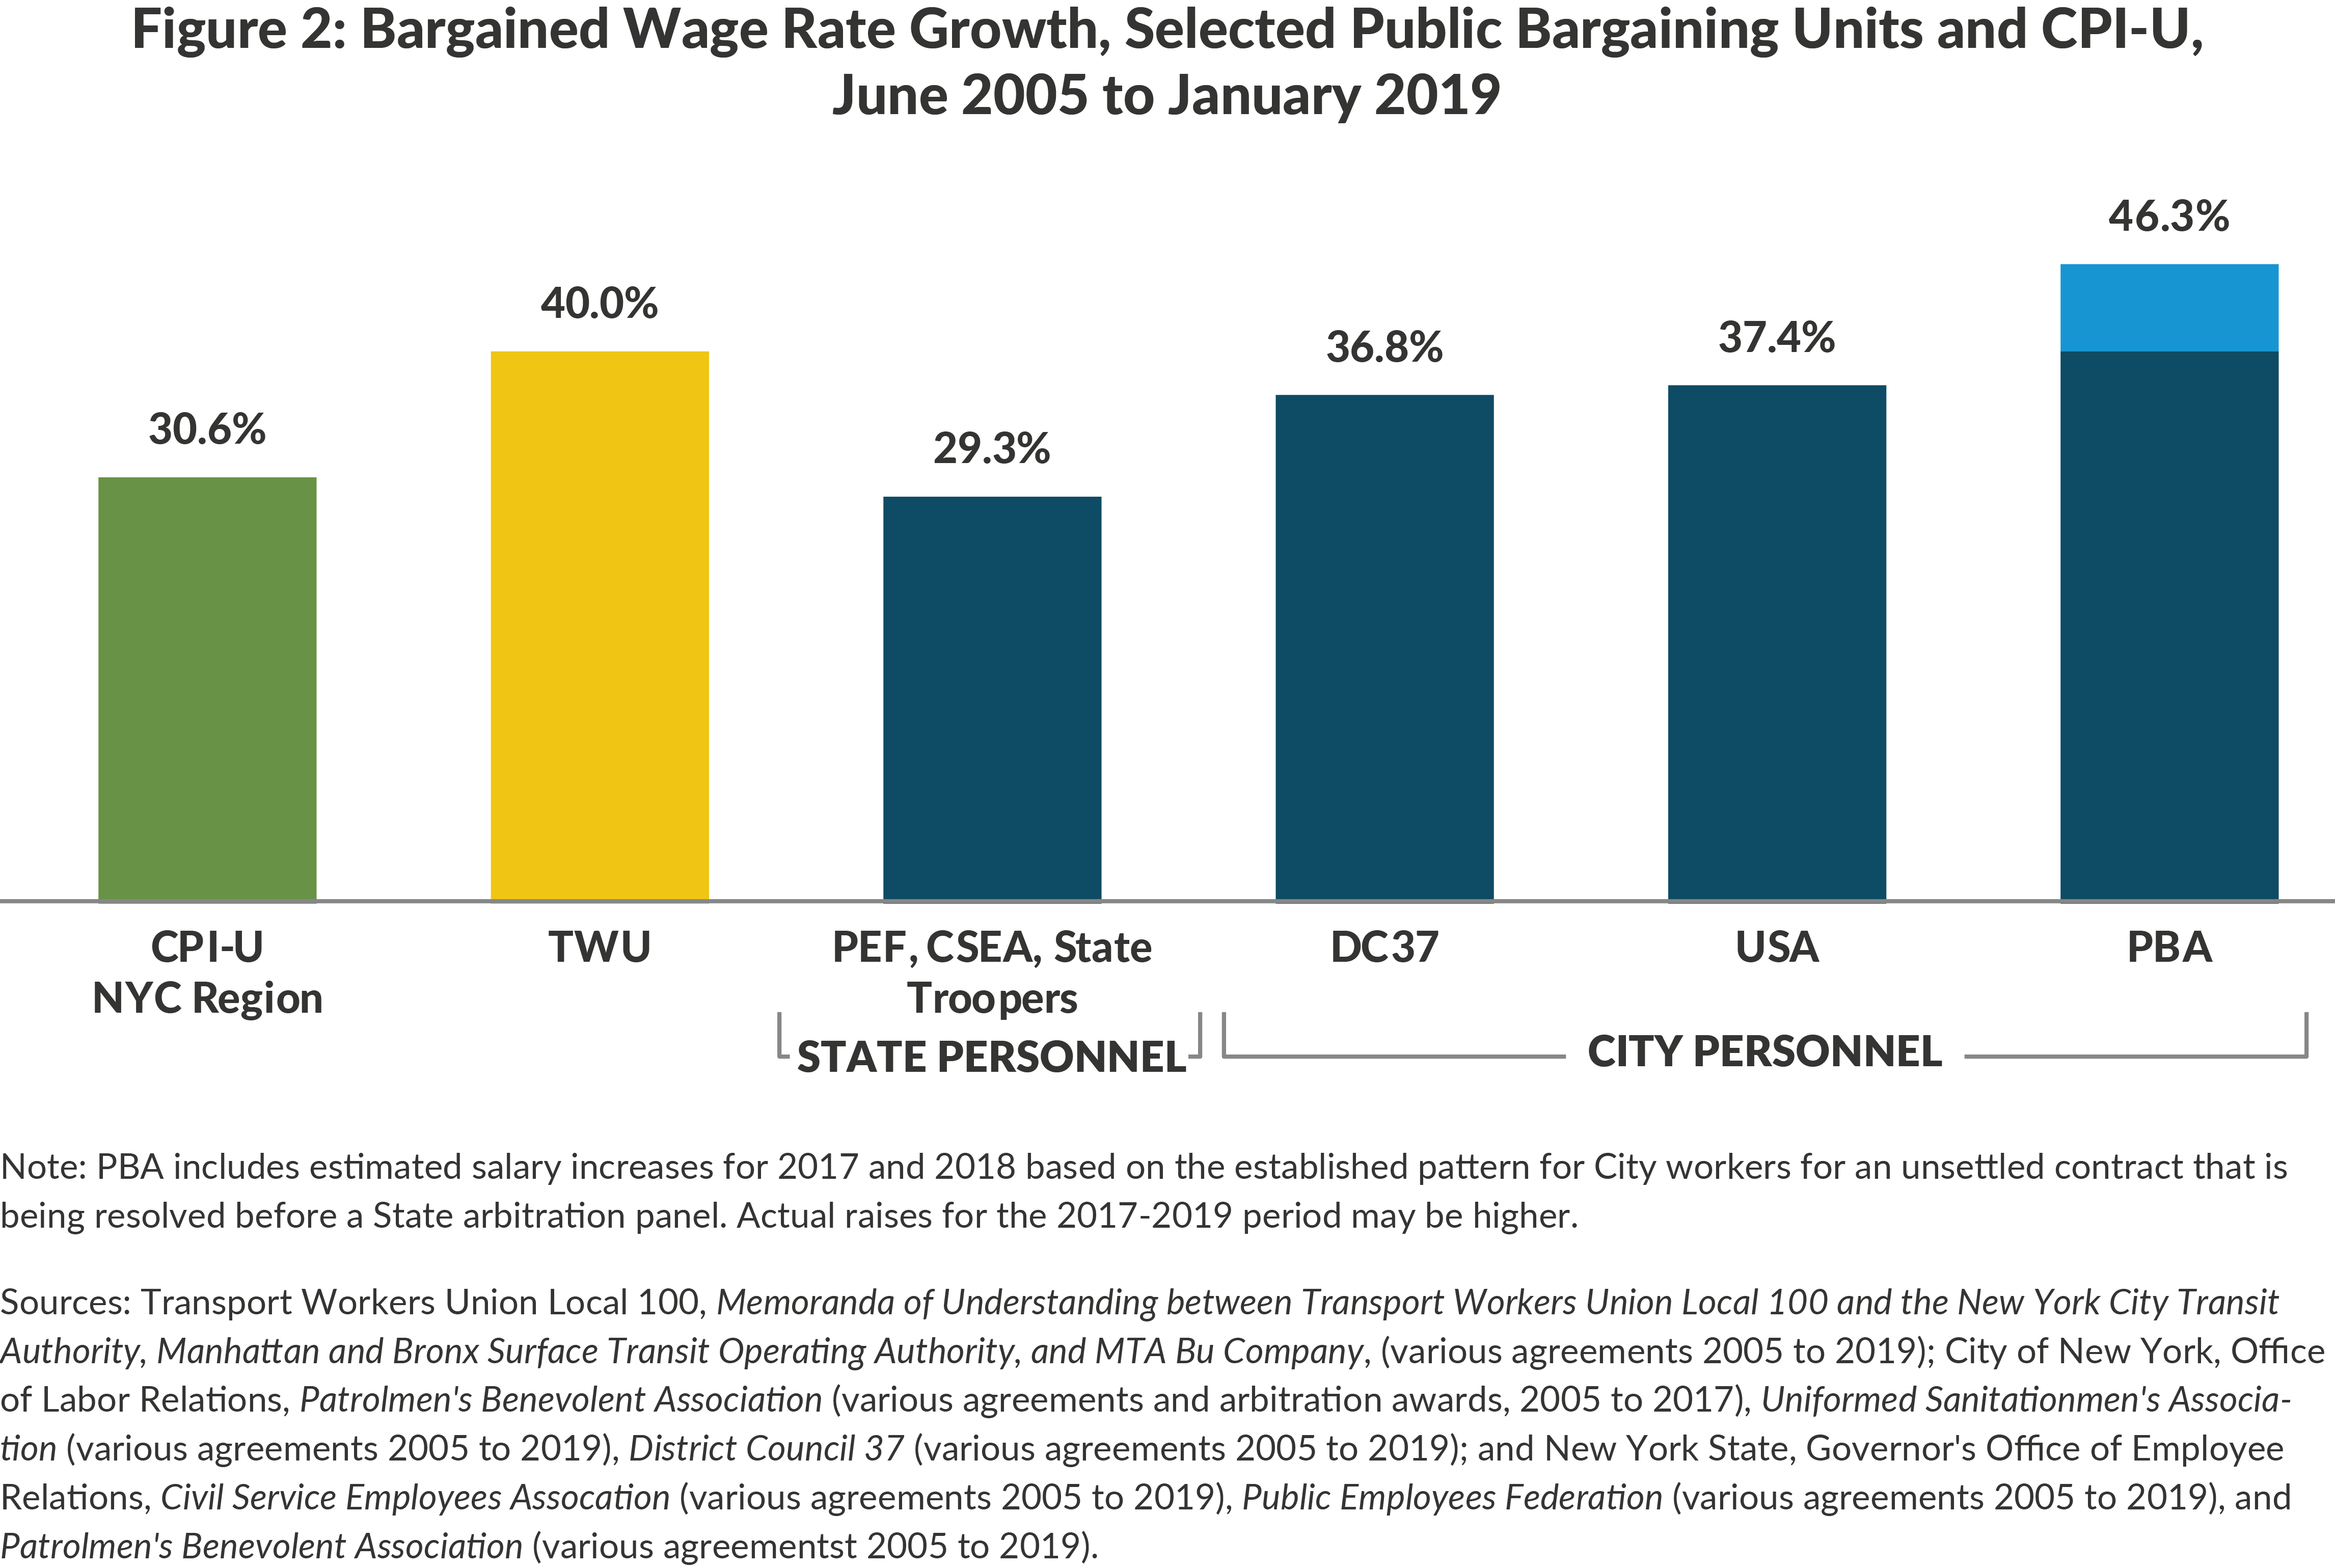
In addition, over the past 15 years wage growth of the MTA’s represented workforce has outpaced other public sector workers. Since June 2005 TWU wage rates have grown 40 percent, greater than the Uniformed Sanitationmen’s Association (USA) representing all New York City sanitation workers (37.4 percent), District Council 37 (DC 37) representing blue collar, clerical, and professional City workers (36.8 percent), and State workers including those represented by the Civil Service Employees Association (CSEA), the New York State Public Employees Federation (PEF), and the New York State Police Benevolent Association representing State Troopers (29.3 percent).7 (See Figure 1.) The only selected bargaining unit to match or surpass TWU wage rate growth over this period is the New York City Police Benevolent Association (PBA) representing New York City police officers, which had negotiated cumulative wage growth of 40 percent as of August 2016, and would have seen cumulative wage growth of 46 percent as of January 2019 if the currently expired contract followed the City’s collective bargaining pattern.8
Offsetting Potential Wage Increases
Forgoing raises can save nearly $950 million over the life of the financial plan, but new contracts could allow for wage increases without imposing additional financial burden by offsetting the cost of increases with two types of savings: increased employee contributions to fringe benefit costs and productivity increases.
Increased Employee Contributions to Health Insurance
In 2018 the MTA spent nearly $3.4 billion on fringe benefits for workers and retirees: $1,318 million for health insurance premium payments on behalf of employees and contributions to welfare benefit funds; $1,446 million for employer contributions on behalf of MTA workers enrolled in one of six defined benefit pension plans; and $614 million on other postemployment benefits (OPEB), primarily premiums on retiree health insurance.9 Benefits provided to the MTA’s represented workforce are comparable to—or in some cases more generous than—those received by other public sector workers, but their contribution towards the costs is less than that of other State workers and nonrepresented employees at the MTA.10
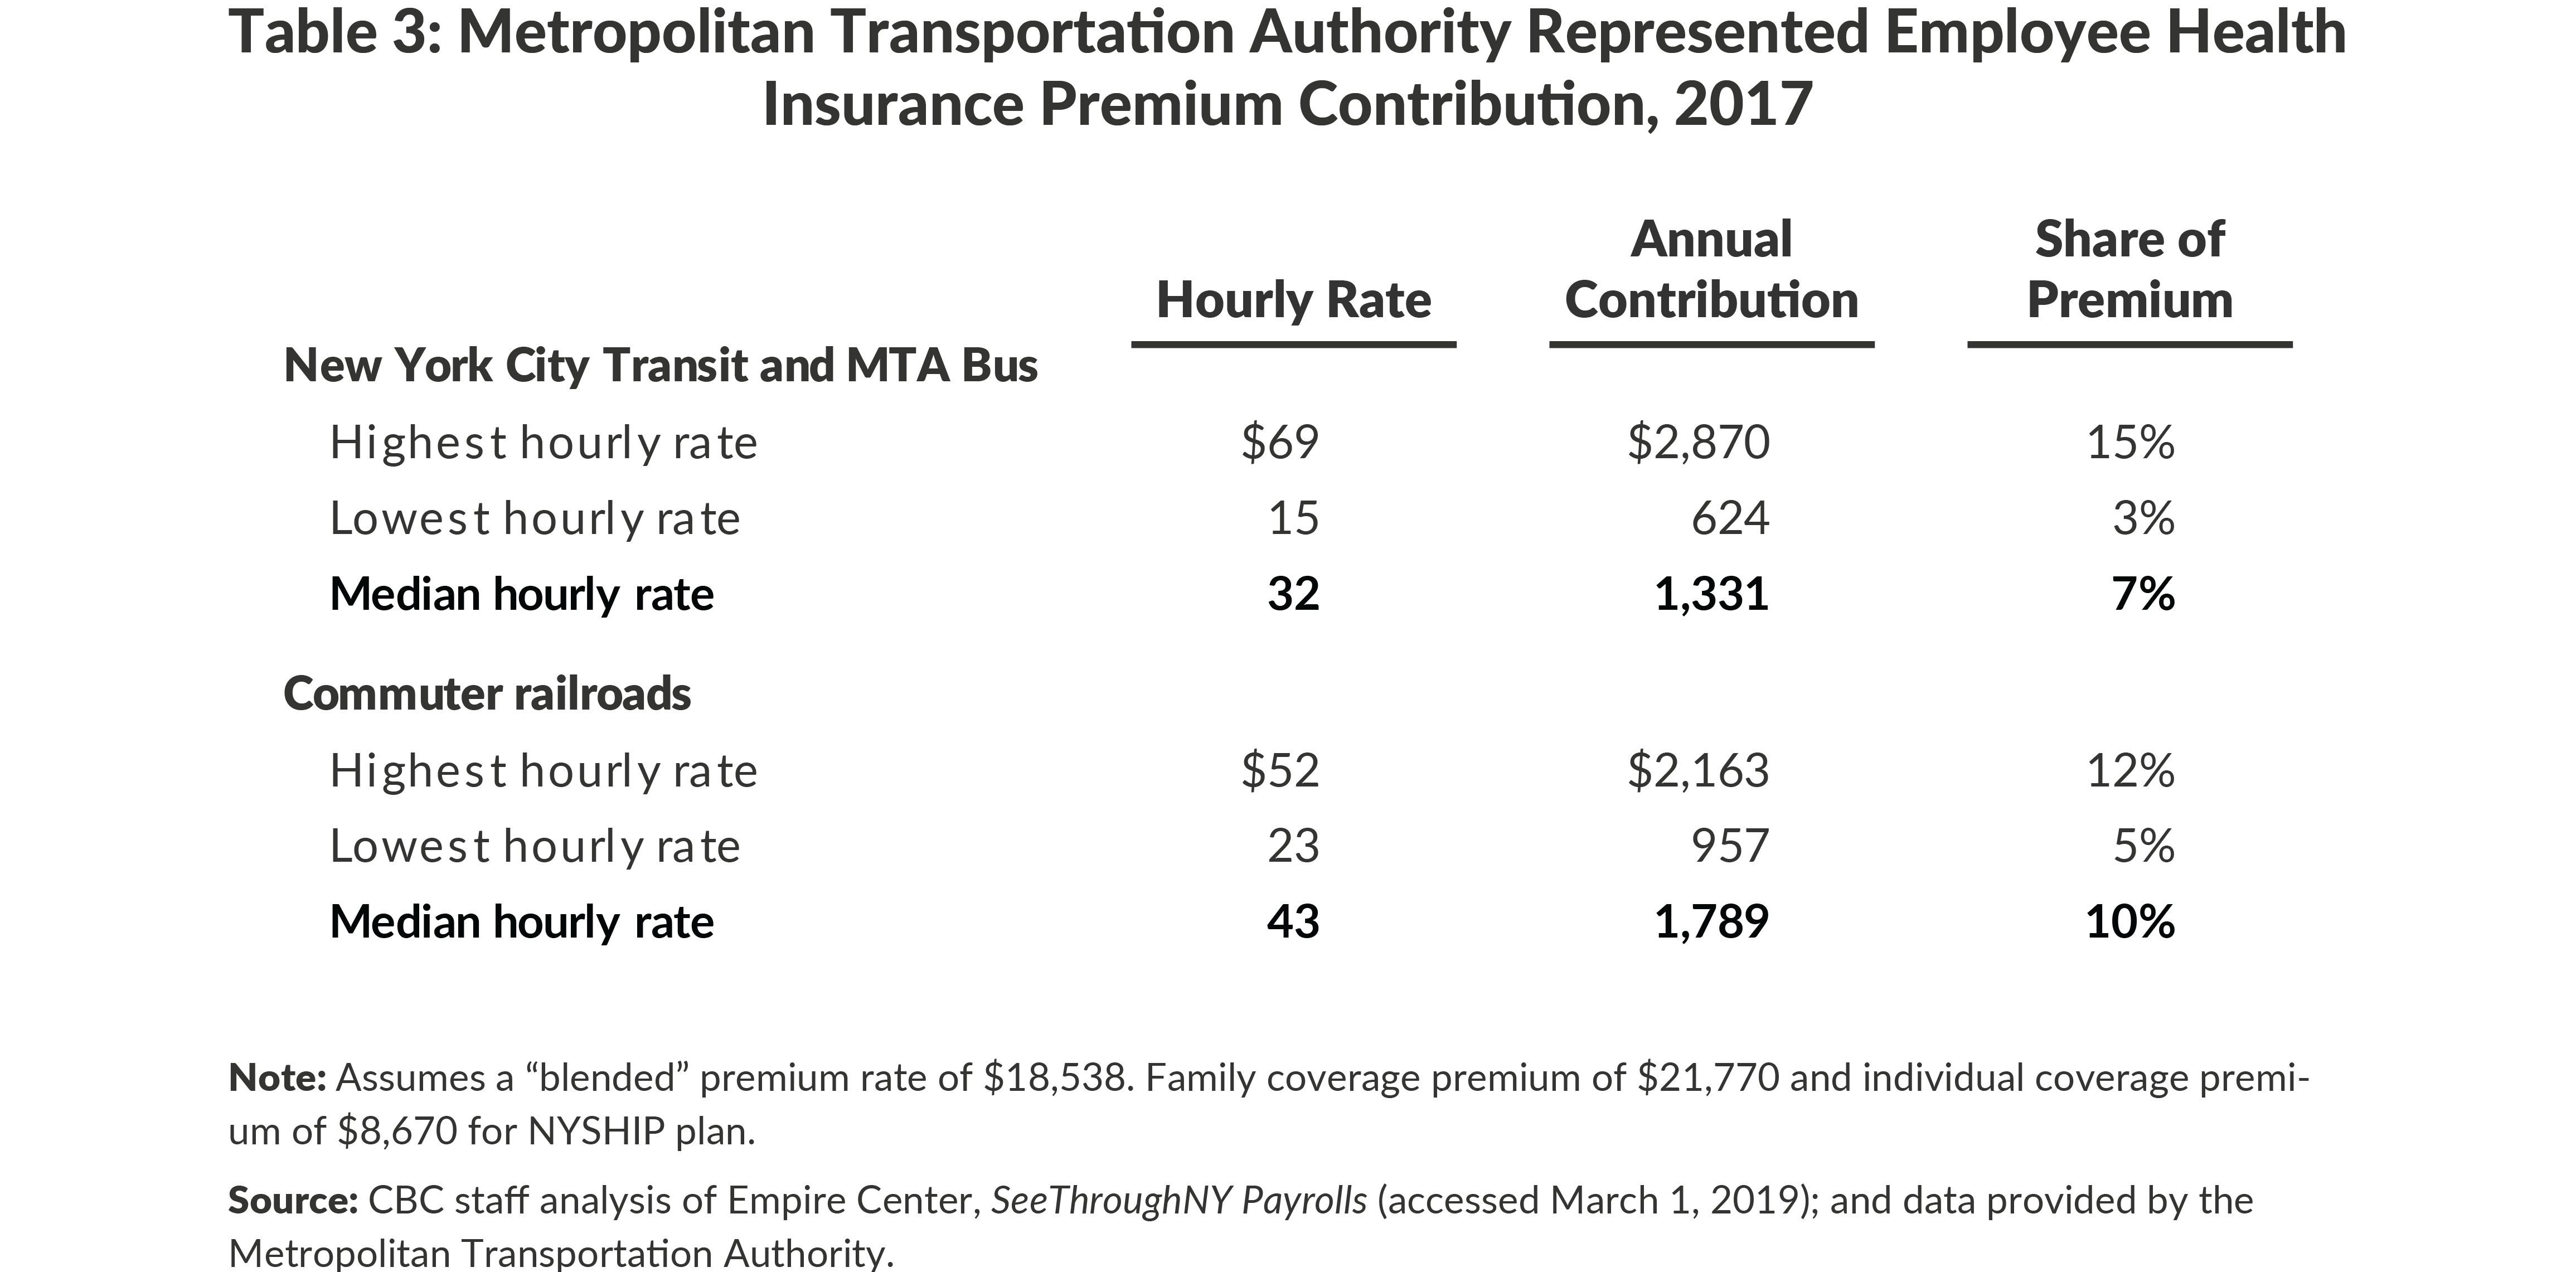
Represented workers contribute 2 percent of base wages on a 40-hour workweek toward health insurance premiums, and the MTA, as the employer, covers remaining premium costs. Employees are enrolled in a variety of health insurance plans. In 2017 premiums for employees in the New York State Health Insurance Plan (NYSHIP) were $21,770 for dependent coverage and $8,670 for individual coverage.11 Contributions vary by employee; according to 2017 data Citizens Budget Commission (CBC) estimates New York City Transit (NYCT) employees paid between an estimated 3 percent and 15 percent of premiums and commuter railroad employees contributed an estimated 5 percent and 12 percent of premiums.12 (See Table 3.)
Nonrepresented MTA workers, like other New York State employees, contribute a fixed share of the total health care premium. In 2017 employees with family coverage paid approximately 19 percent of the premium ($4,100), and those with individual coverage paid 10 percent of premium ($867). Based on greater participation in family coverage, the composite rate is 18 percent.13 As health insurance premiums increase, so too do these employees’ contributions.
Increasing employee health care contributions of represented workers to levels similar to the nonrepresented workforce would defray a significant share of the authority’s $1.4 billion health and welfare expense. In 2017 an estimated $4 billion in payroll was subject to the 2 percent gross wage contributions to health care, reducing MTA health and welfare expense by $80 million.14 This represented 8.1 percent of the estimated $986 million in health insurance premiums for these workers.15 Increasing this contribution rate to 18 percent of premium would have reduced the authority’s contribution an estimated $97 million.
Unlike MTA workers, employees of the City of New York do not pay health insurance premiums. However, in recent years the City and its labor partners have committed to savings targets through driving down rates from insurers and vendors, eligibility audits, lower per patient care through improved care delivery, and increased worker wellness.16 As of City fiscal year 2018 the agreement had yielded nearly $1.3 billion in annual savings against the financial plan or 12 percent of projected health costs at the time of the agreement. A subsequent health savings agreement coving fiscal years 2019 to 2021 builds on the first round of savings by generating another $600 million annually by fiscal year 2021.17 Reductions in MTA health costs of similar proportion to the savings from the City’s initial agreement would save the MTA $203 million annually by 2022.18
MTA retirees are eligible for medical benefits including premium payments for a Medicare supplemental plan. These benefits can be altered through collective bargaining agreements. Other State retirees contribute between 12 percent and 16 percent of individual coverage premiums and 27 percent and 31 percent of dependent coverage premiums based on the retiree’s final civil service grade. Applying these shares to the number of MTA retirees receiving retiree benefits would save the MTA an estimated $136 million to $165 million in 2019.19
Changes to Pension Benefits of Prospective Employees
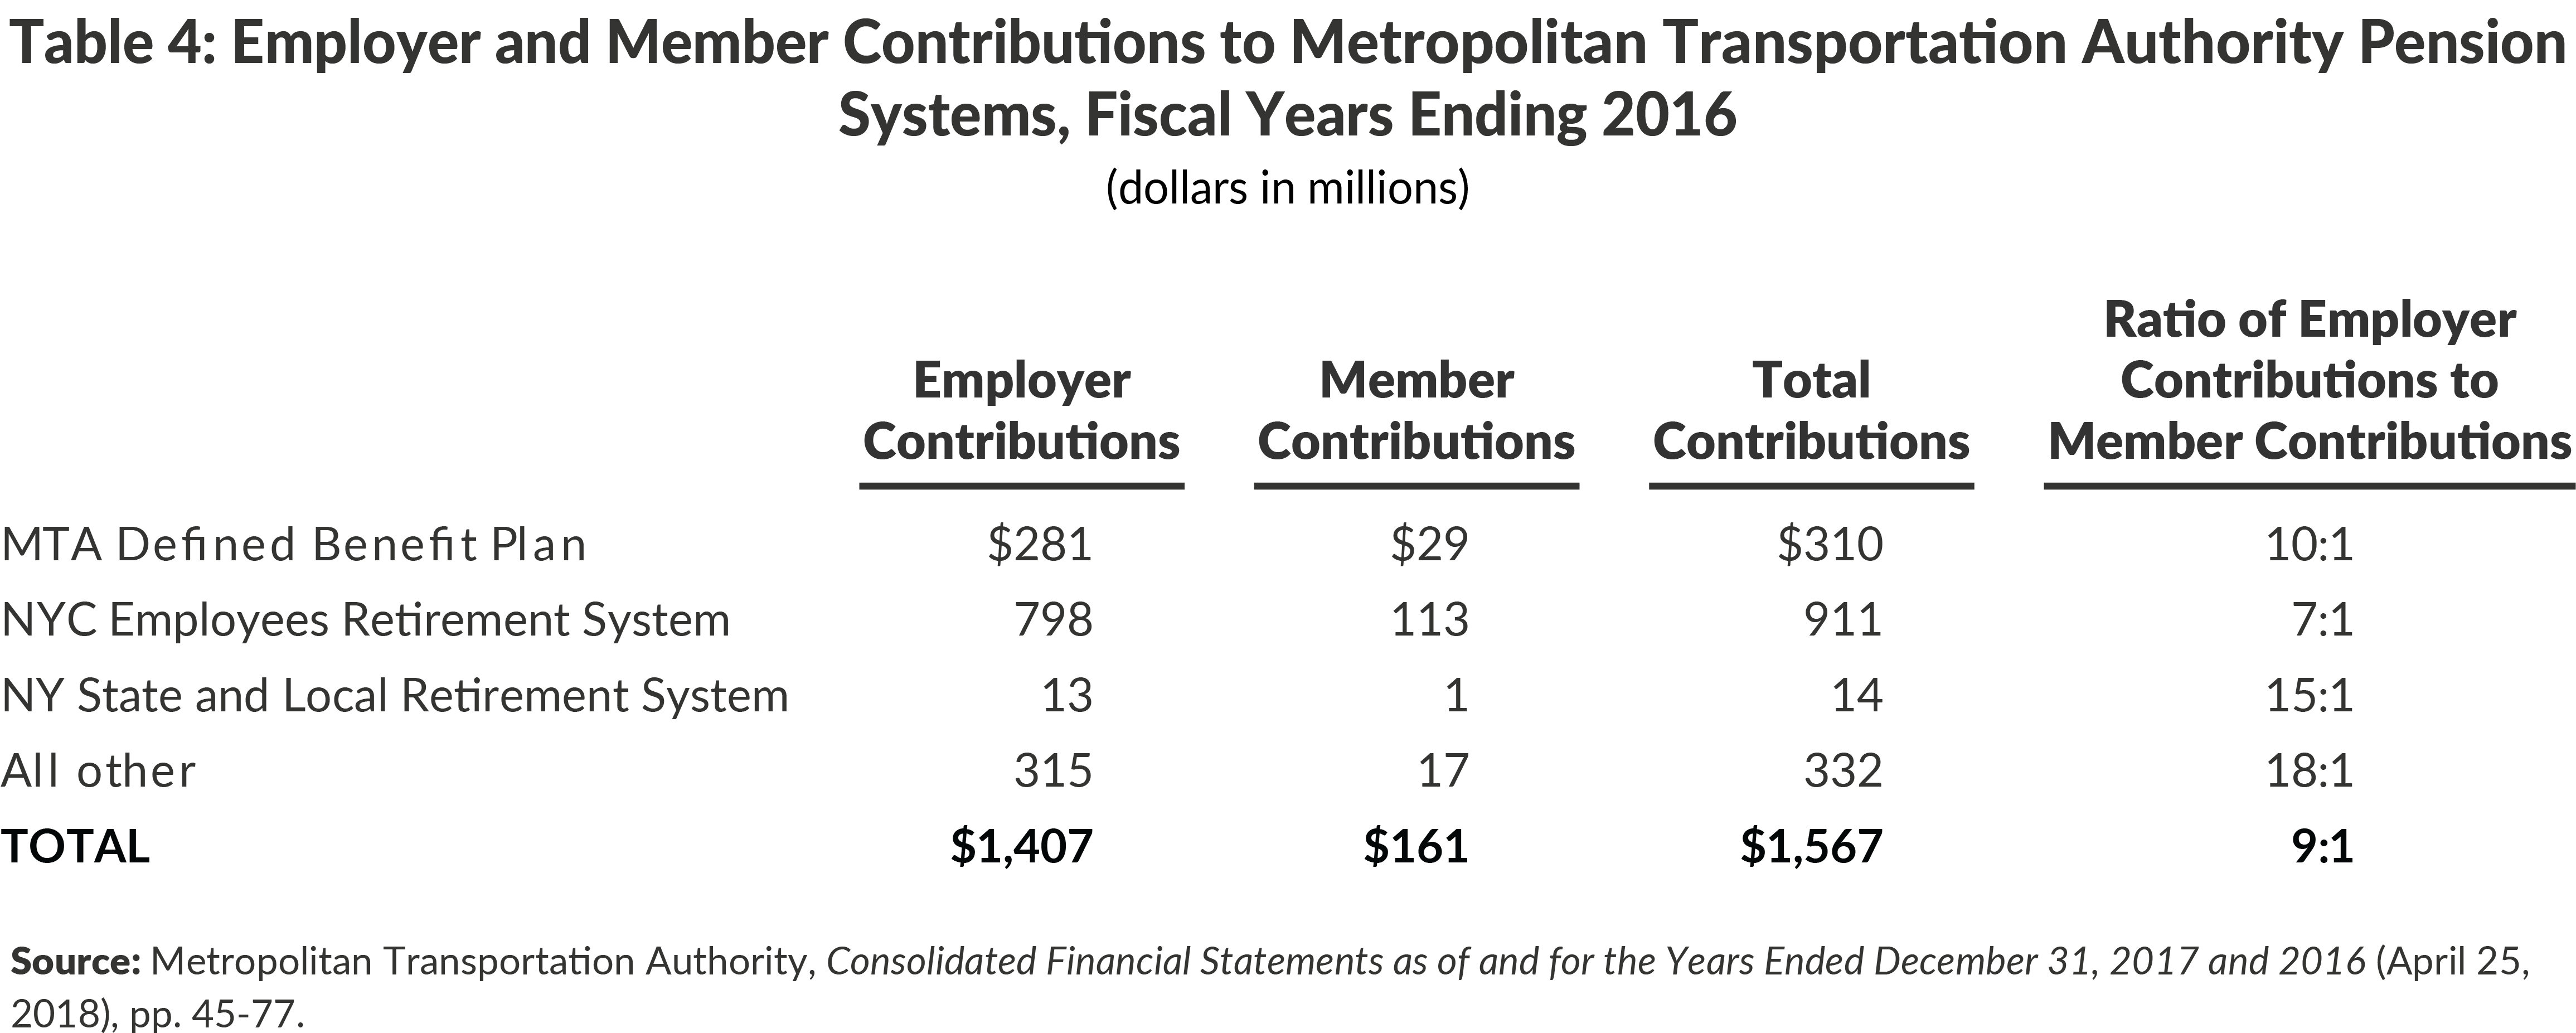
Pension benefits received by MTA workers vary by hire date and bargaining unit. Employees enroll in one of six defined benefit plans. Retirement age, vesting period, contributions, and payments vary by plan and tier. In aggregate the MTA contributed $1.4 billion to its six associated pension systems, approximately nine times the estimated aggregate contributions of members.20 (See Table 4.)
Changes to member contribution rates and benefits cannot be made through collective bargaining. Rather, modifications—which only affect future employees—must be passed as State legislation and signed into law. Although not providing immediate budget relief, increases to new member contribution rates or changes to benefit calculations can reduce MTA long-term costs. Such changes could be discussed as part of the collective bargaining process where both sides agree to support legislation to enact such changes. In 2005 the MTA sought increased employee pension contributions but the ultimate settlement yielded less substantial savings through the cost sharing on health insurance premiums.21
Productivity Improvements
Productivity measures the units of output per hour of work. In the case of mass transit output is measured in the number of hours or miles of service provided by the authority. Productivity is measured for all employees and separately for vehicle operators and maintenance employees.22
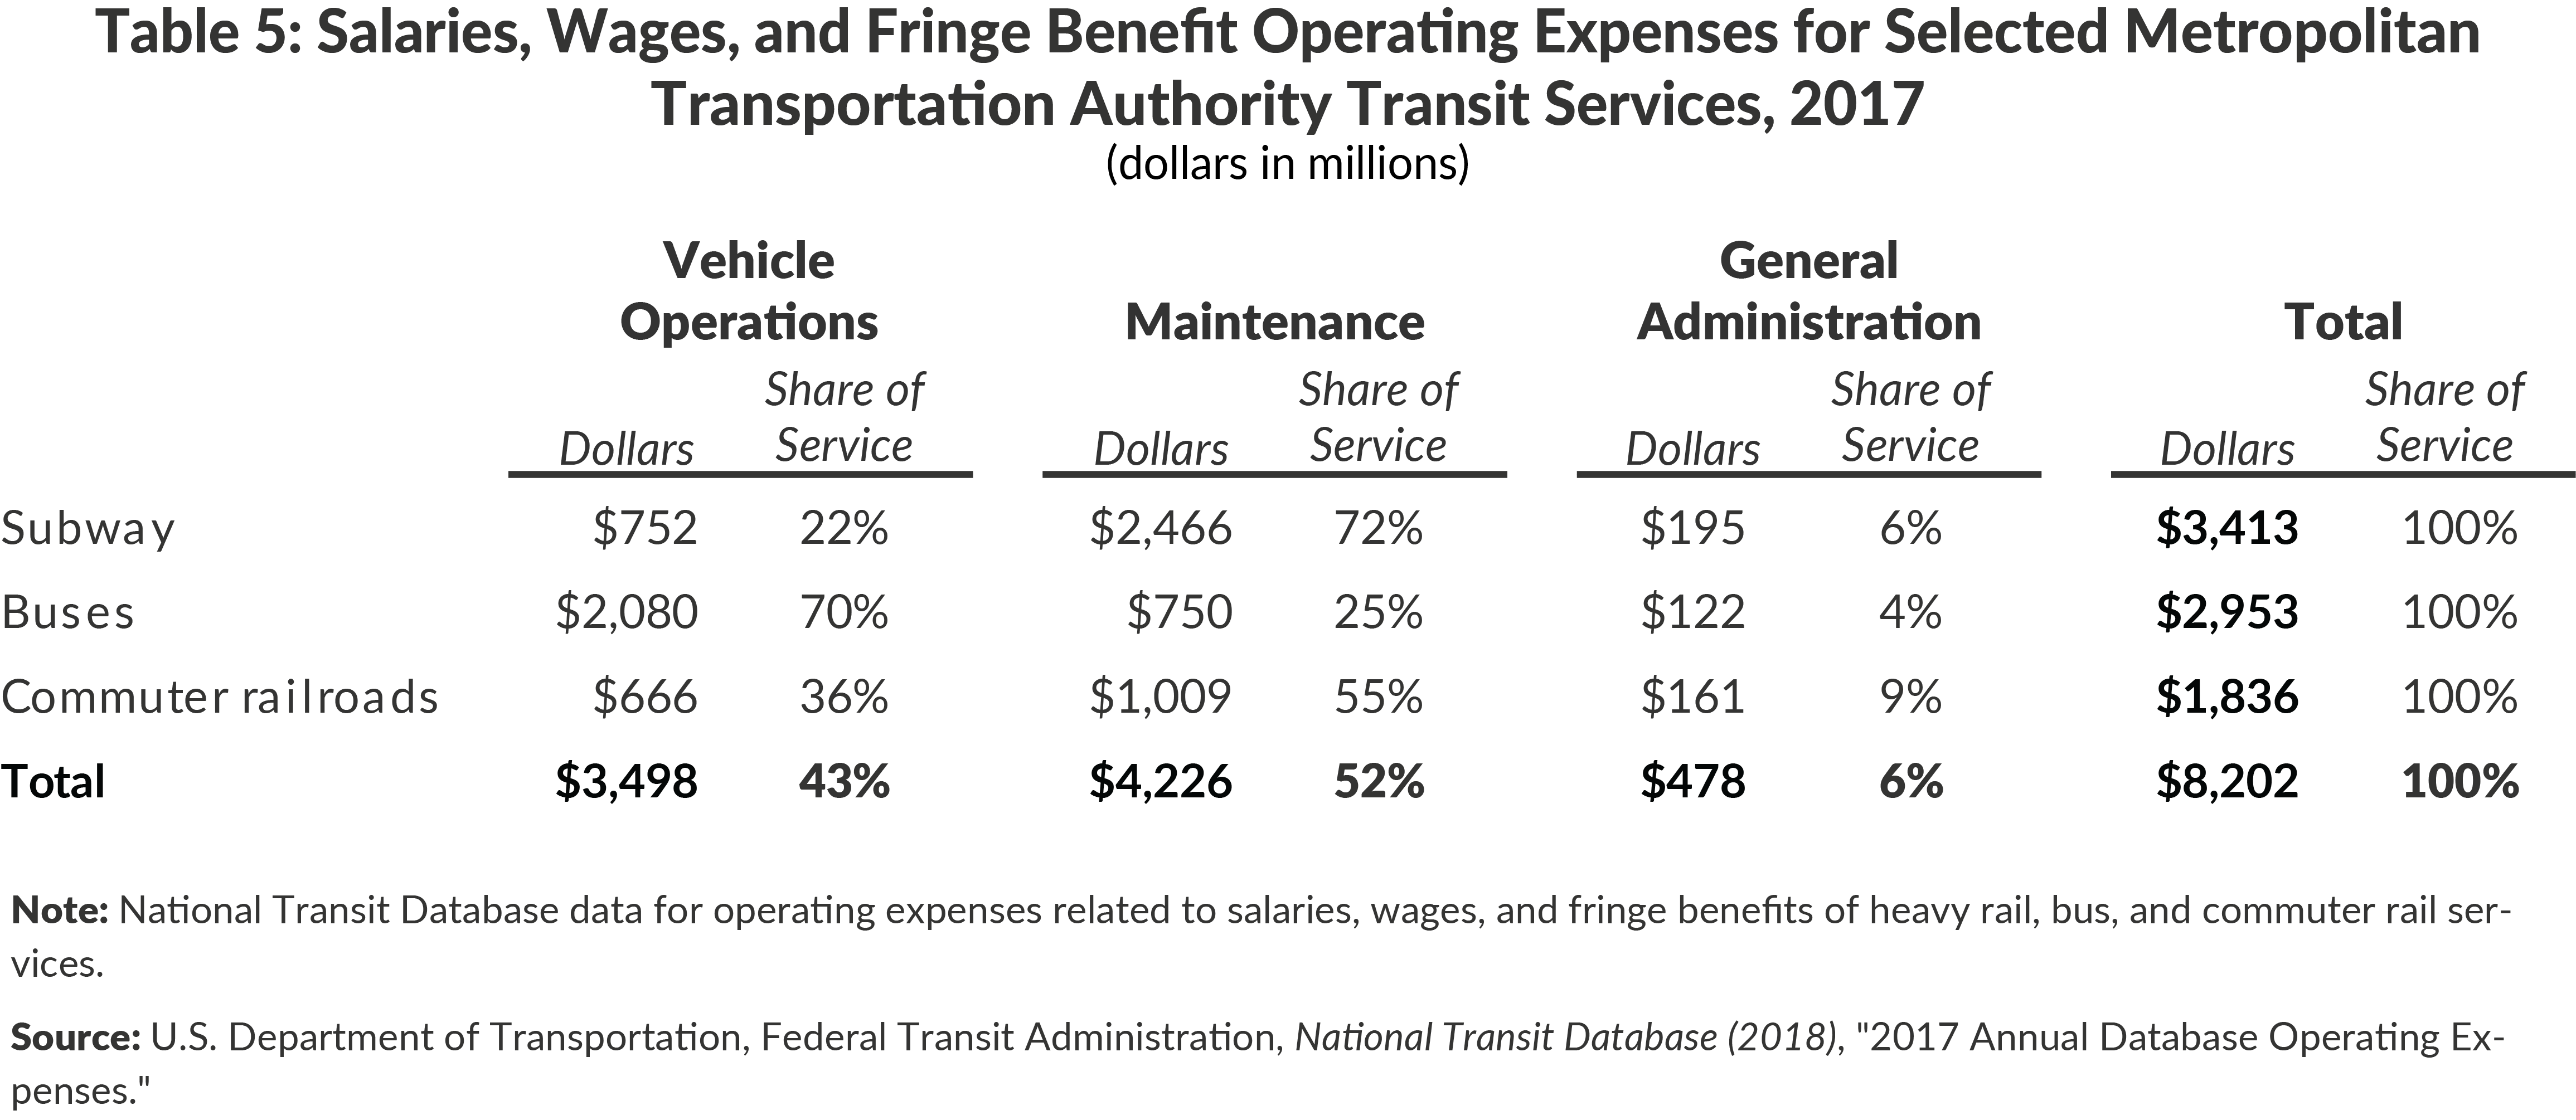
In 2017 MTA labor expenses were 42 percent for subways, 36 percent for buses, and 22 percent for commuter railroads. The split between operations and maintenance varies, respectively, from 22 percent and 72 percent at subways, 70 percent and 25 percent at buses, and 36 percent and 55 percent at the commuter railroads.23 (See Table 5.)
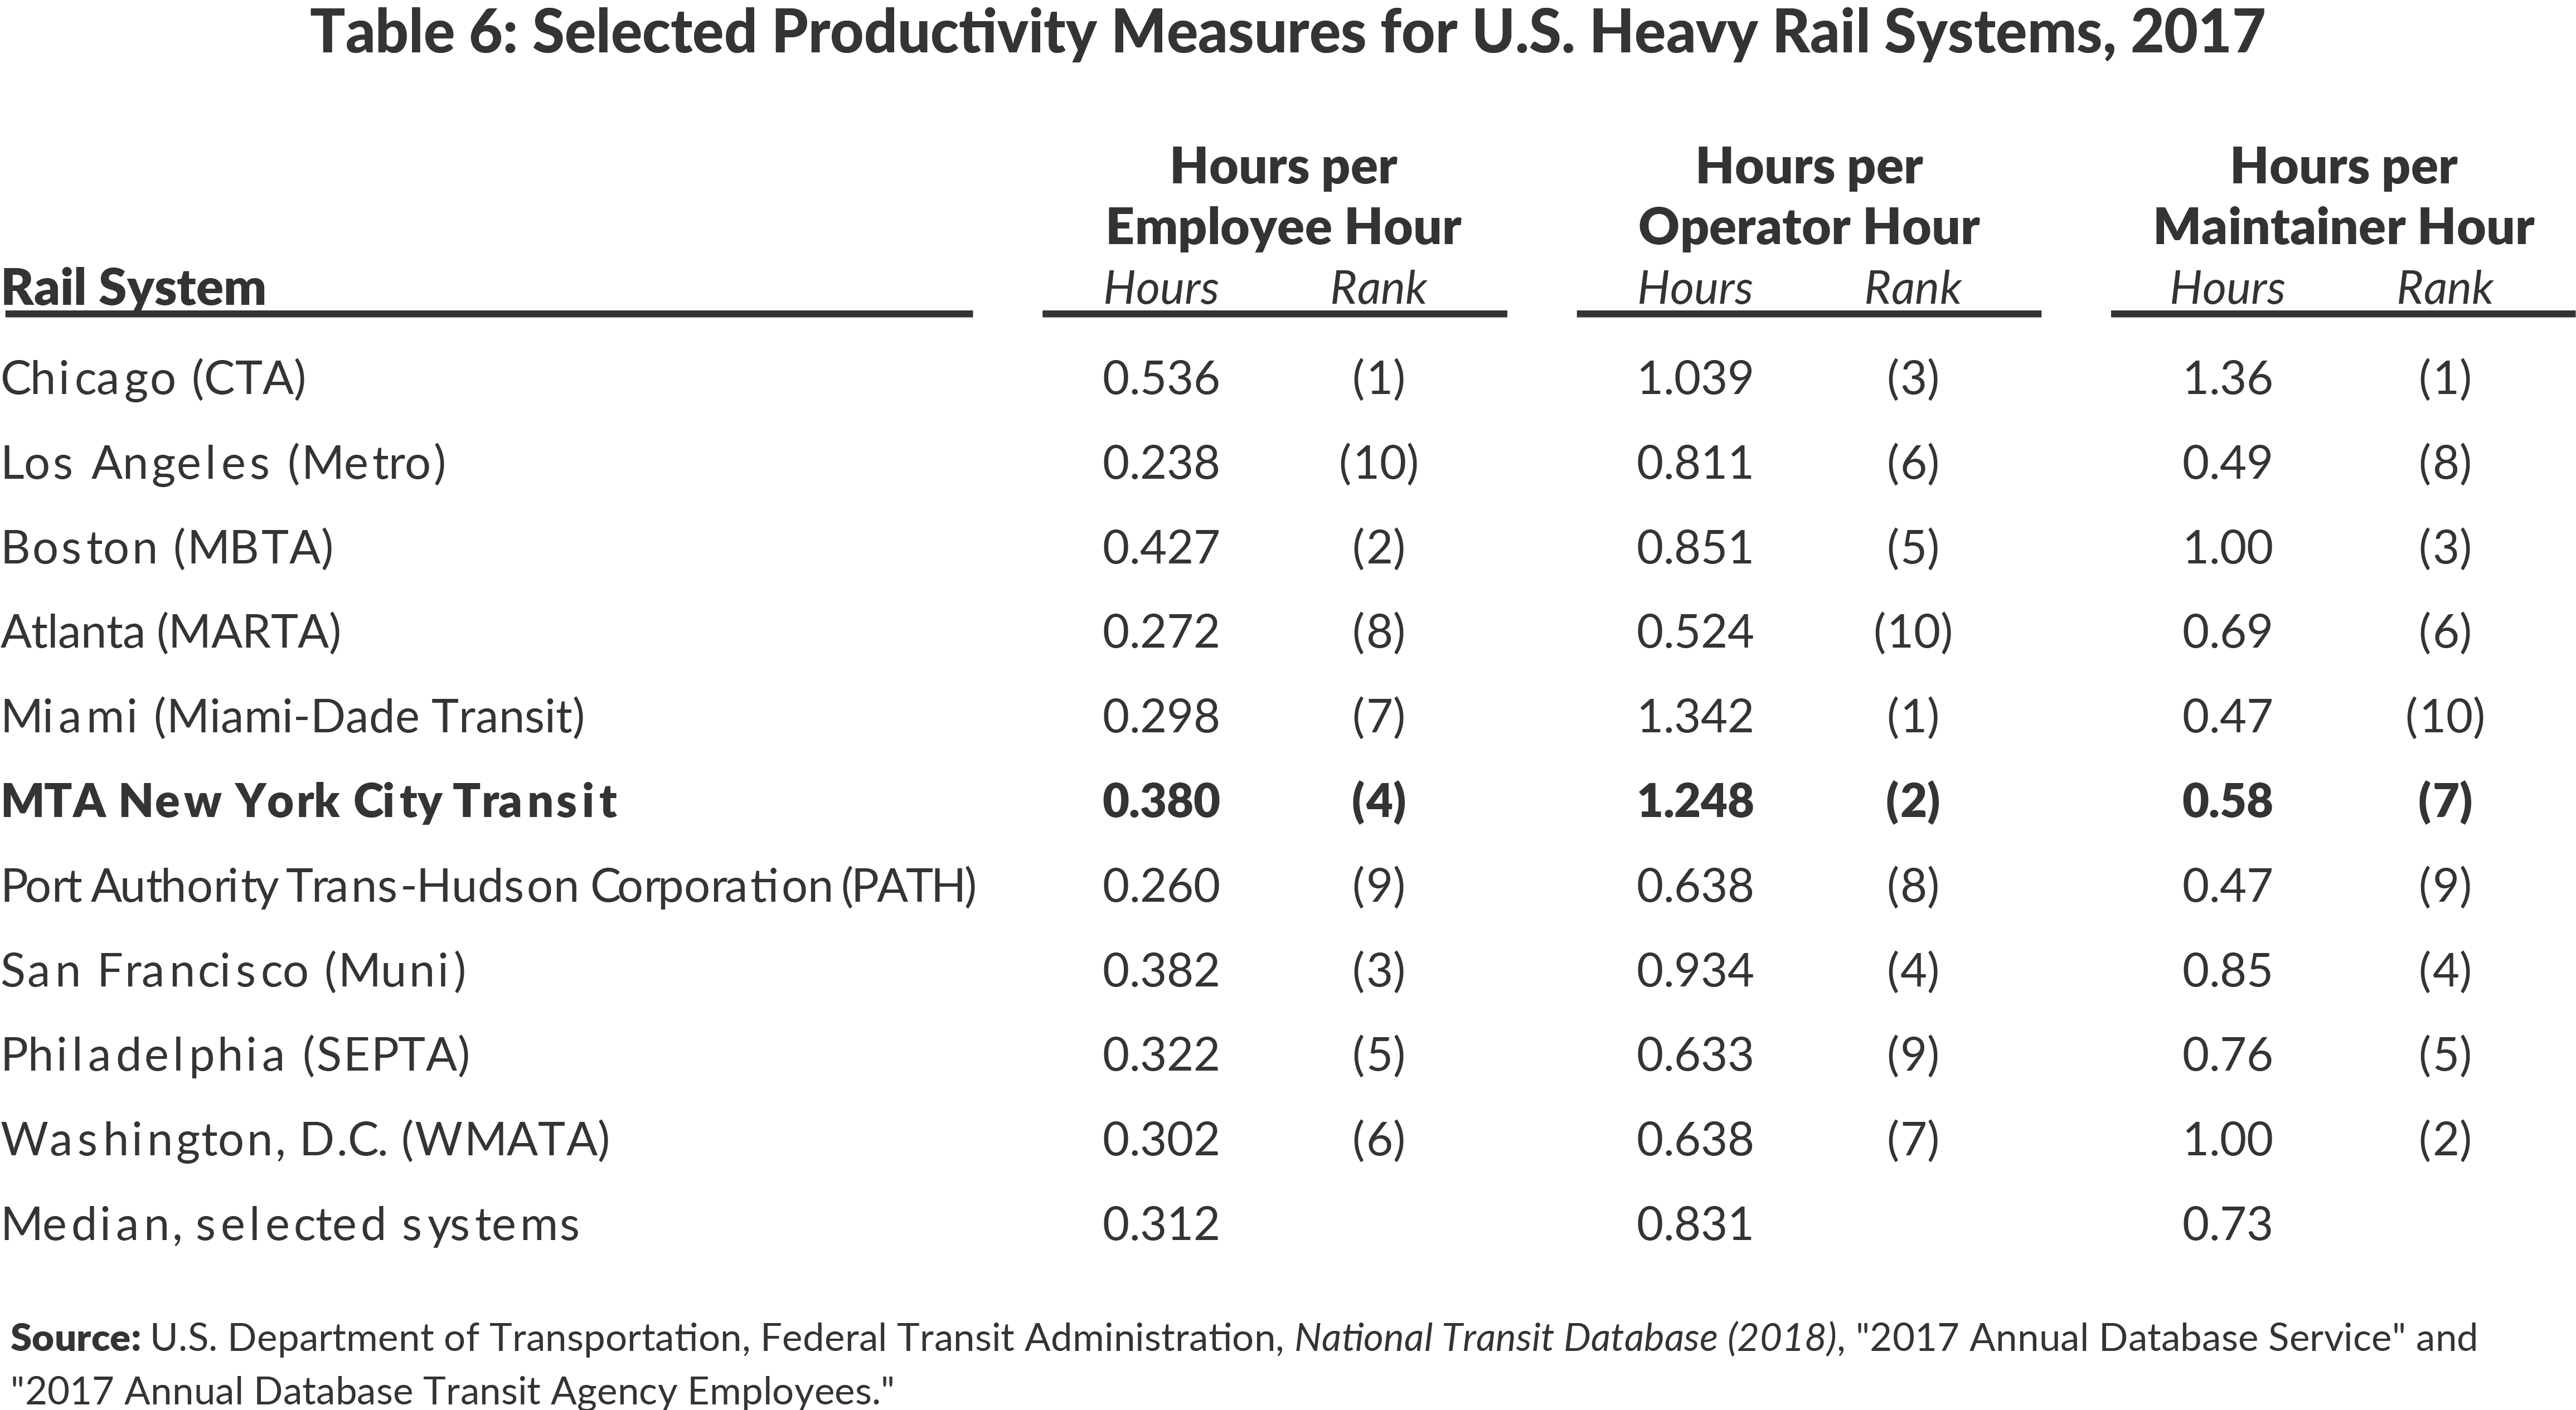
Compared to other large systems the MTA has a mixed productivity record. Total subway productivity is above the median for selected U.S. systems, and operator productivity is the second highest among these selected systems; however, maintenance productivity is below the median for these systems. (See Table 6.) Increasing subway maintenance productivity to the median for selected U.S. systems would lead to a reduction in maintenance hours of 20 percent. A similar decrease to corresponding salaries and wages and fringe benefits would result in annual savings of $496 million.24
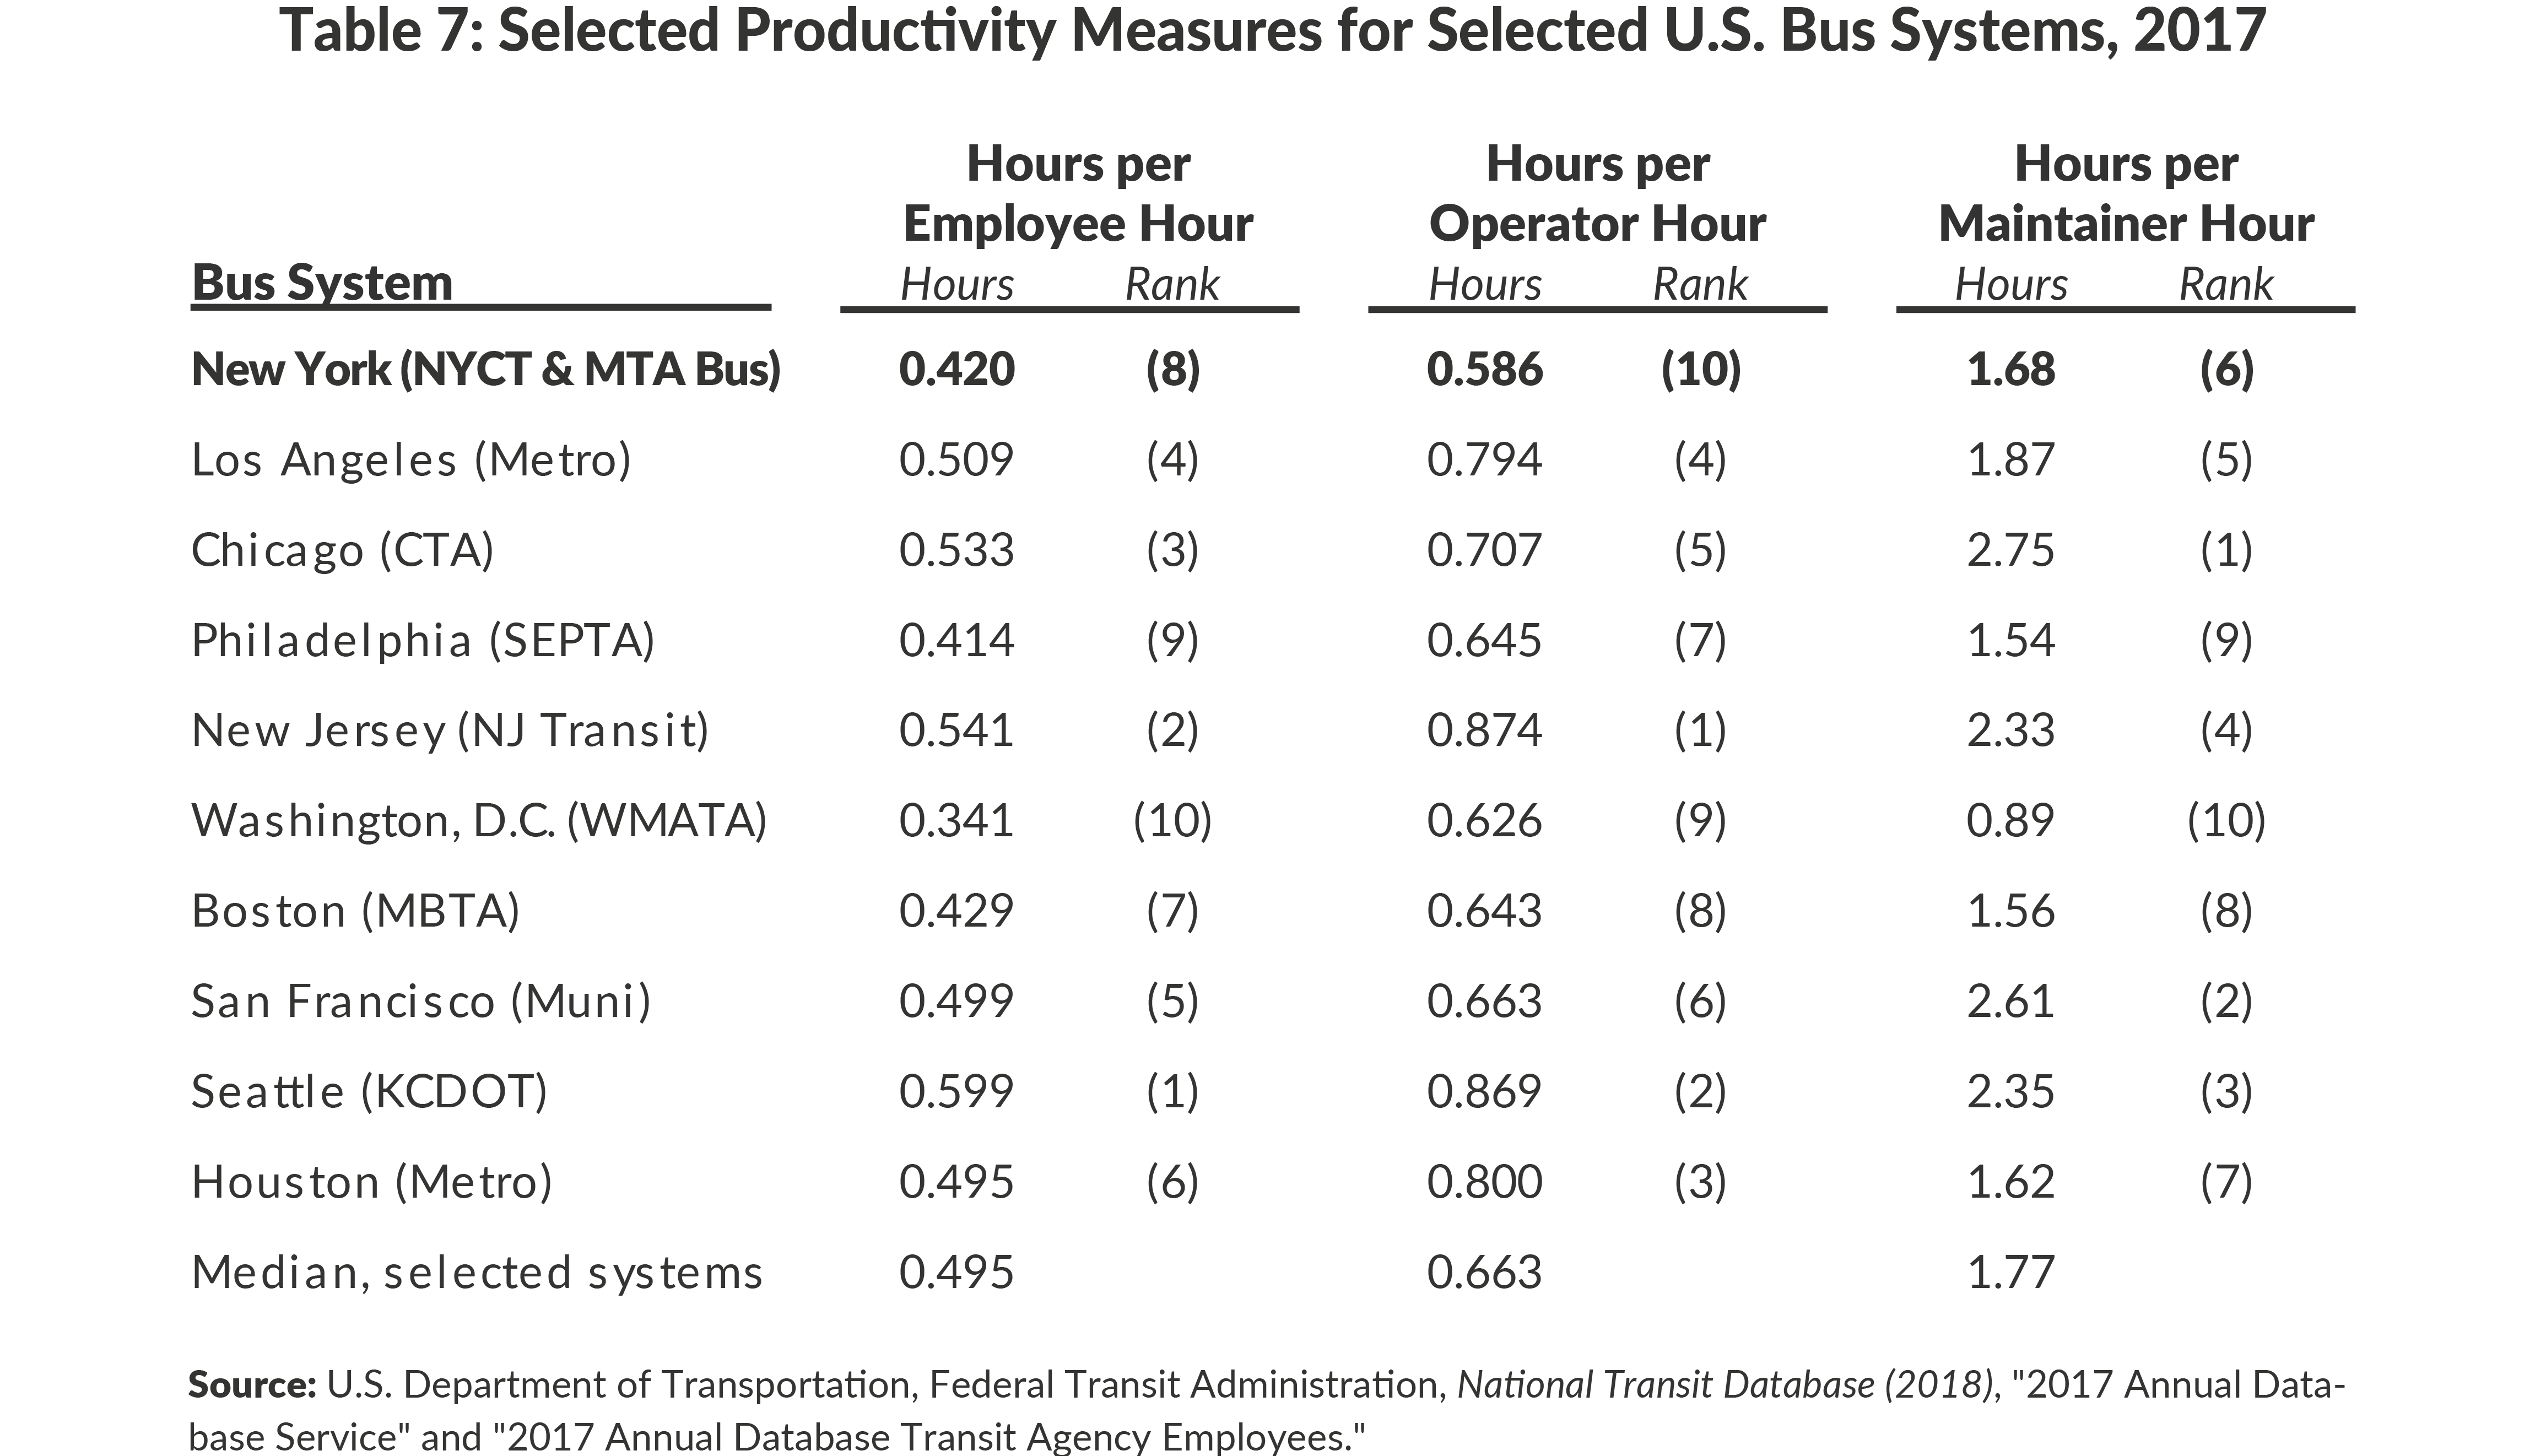
MTA bus productivity is lower relative to most other large systems in the United States.25 Total bus productivity is eighth lowest among 10 selected systems, only 85 percent of the median; operator productivity is last among selected systems, or 88 percent of the median; and maintenance productivity is sixth among selected systems, 95 percent of the median. (See Table 7.) If the MTA’s total bus productivity matched the median, total worker hours could be reduced 15 percent, and a similar reduction to salaries, wages, and fringe benefits would save an estimated $444 million.26
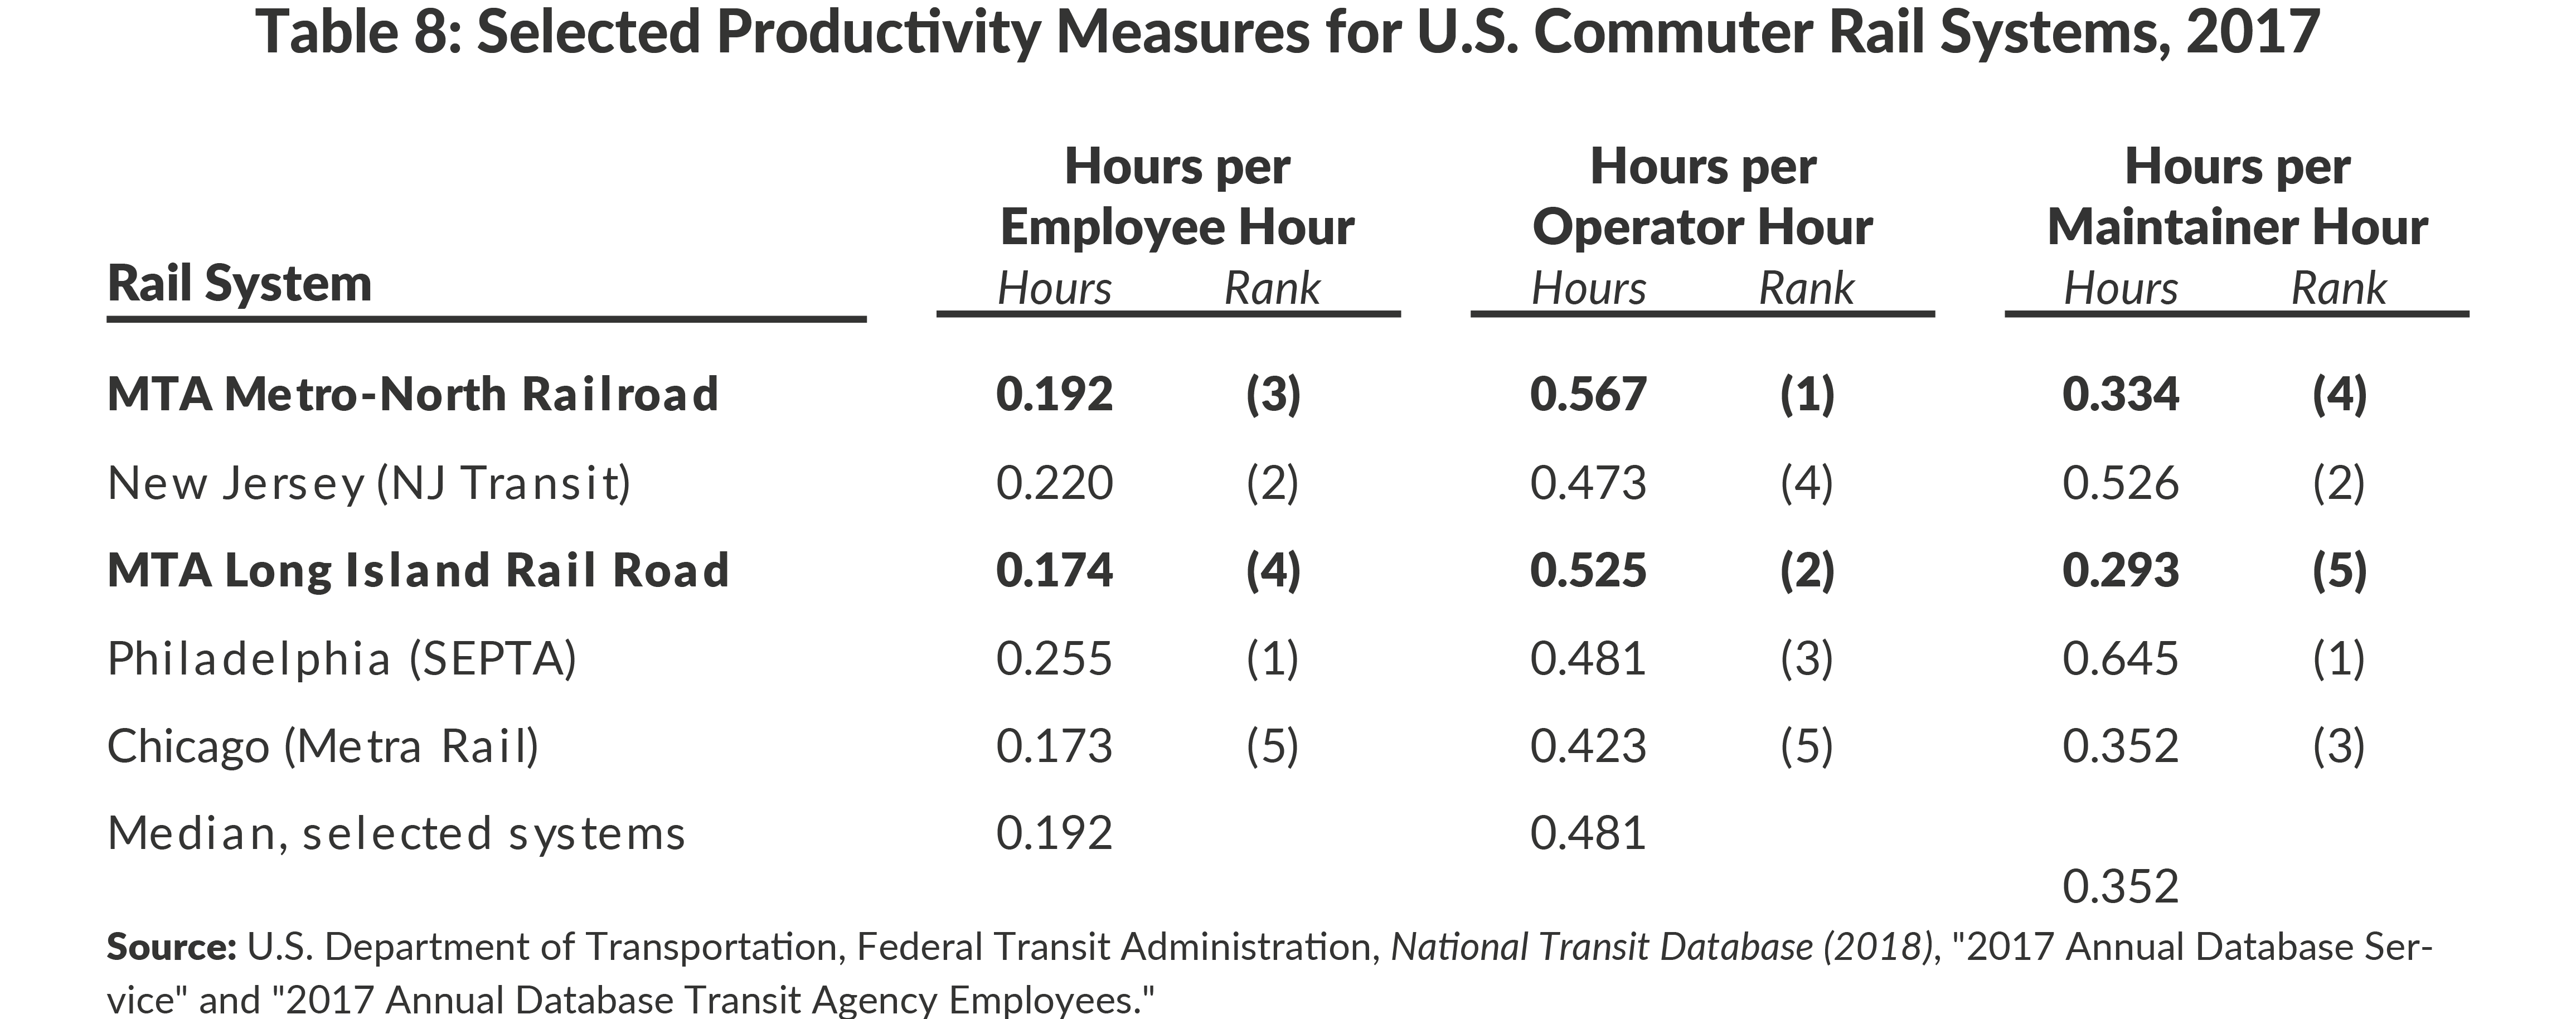
In 2017 only five commuter railroads ran more than 200,000 vehicle revenue hours, and two of them were the MTA’s commuter railroads, Metro-North and the LIRR. Metro-North total productivity was the median and operator productivity was the highest; LIRR total productivity was below the median and operator productivity above the median. Metro-North and LIRR maintenance productivity were both below the median. (See Table 8.) If the LIRR could match the total productivity of Metro-North it could have saved the MTA $86 million.27
MTA management and labor should set productivity goals and collaboratively develop an agenda of collective bargaining changes that would allow both sides to achieve these goals. This could include incentives for maintenance shops to complete more work with fewer maintainer hours. Maintenance shops could earn bonuses based on their performance completing certain tasks relative to other shops in the system.
Collective bargaining changes could also include changes to work rules to make scheduling more flexible. For example, new collective bargaining agreements could reduce “penalty payments” made to bus operators scheduled to work across both morning and evening peak periods and eliminate allowances for time not worked. New agreements also could eliminate the restrictions on hiring more part-time bus operators and the restrictions on express bus scheduling that would allow to authority to orient service toward peak periods. Likewise allowing management to schedule split runs for subway train operators and conductors would allow for more efficient scheduling of those workers.
Conclusion
In the last year MTA stakeholders have contributed to improving the fiscal stability of the MTA. Riders are paying increased fares; motorists are paying increased tolls and will be charged to drive in the central business district starting in 2021; State and City taxpayers will contribute greater resources; and MTA administration will undergo a review and restructuring to increase efficiency and public accountability. The TWU should also be part of the solution; its labor agreement sets the tone and pattern for the remainder of the authority’s collective bargaining agreements and drives the growth of the MTA’s workforce costs.
The last two rounds of collective bargaining at the MTA have led to cumulative wage increases totaling 14 percent while attaining little in additional employee benefit contributions and little in work rule reforms. The authority’s current fiscal plight and physical degradation make a stronger case for self-funded raises than at any point since the recession in 2008. An approach to collective bargaining that freezes total labor costs over the life of the financial plan is best suited to place the MTA on solid financial ground. Wage increases are not precluded, but any agreement should include savings from productivity improvements or contributions to benefit costs to offset the costs of wage increases. As a major authority stakeholder, the MTA’s workers should cooperate in helping it achieve a viable fiscal future.
Footnotes
- Metropolitan Transportation Authority, 2019 Adopted Budget February Financial Plan 2019-2022 (February 2019), Accrual Statement of Operations By Category, p. II-3, http://web.mta.info/mta/budget/.
- Labor agreements with certain employees of MTA Bus, Staten Island Railway, and MTA Headquarters will also expire in 2019. Some represented employees are working under expired contracts including clerical and administrative workers at MTA Police (expired August 2016), other MTA Police employees (expired October 2018), most Bridges and Tunnels workers (expired between 2012 and 2017), and certain Staten Island Railway workers (expired between December 2016 and February 2017). A small share of represented employees are working under agreements that expire in 2020 including clerical and administrative workers represented by the Transportation Communications Union Local 643 (expires March 2020), and MTA Headquarters Procurement Department employees (expires March 2020). See: Metropolitan Transportation Authority, Consolidated Interim Financial Statements as of and for the Nine-Month Period Ended September 30, 2018 (January 2019), pp. 16-18, http://web.mta.info/mta/budget.
- The financial plan assumes all workers will receive 2 percent wage increases on June 1 of each year. See: Metropolitan Transportation Authority, MTA 2019 Final Proposed Budget, November Financial Plan 2019-2022 (November 2018), pp. II-18-II-19, http://web.mta.info/mta/budget.
- Employees continued to benefit from automatic step increases. Some City employees received a $1,000 bonus instead of a wage increase. Some State employees received increases in their Downstate Adjustment.
- This includes pay classified as Regular Earnings and Overtime for all payroll records for employees working an estimated one-quarter of the year or more. See: Empire Center, SeeThroughNY Payrolls (accessed March 1, 2019), www.seethroughny.net/payrolls. U.S. Census Bureau, 2013-2017 American Community Survey 5-Year Estimates (accessed March 2019), S1903, Median Income in the Past 12 Months (in 2017 inflation-adjusted dollars), https://factfinder.census.gov/faces/nav/jsf/pages/index.xhtml.
- Transport Workers Union Local 100, Memoranda of Understanding between Transport Workers Union Local 100 and the New York City Transit Authority, Manhattan and Bronx Surface Transit Operating Authority, and MTA Bus Company, www.twulocal100.org/contracts-taoamta-bus (various agreements 2005 to 2019); City of New York, Office of Labor Relations, Patrolmen's Benevolent Association, Uniformed Sanitationmen's Association, and District Council 37, https://www1.nyc.gov/site/olr/labor/labor-recent-agreements.page (various agreements 2005 to 2019); and New York State, Governor's Office of Employee Relations, Civil Service Employees Association , Public Employees Federation, and Patrolmen's Benevolent Association, https://goer.ny.gov/state-union-contracts (various agreements 2005 to 2019).
- The NYC PBA contract expired in August 2017 and the union has been granted a request for arbitration. The pattern established in City contracts with DC 37 calls for a 2 percent raise in 2017 and a 2.25 percent raise in 2018. See: Richard Steier, “New Trooper Contract Widens Pay Gap as PBA Arbitration Looms,” The Chief-Leader (November 20, 2018), www.nycpba.org/news-items/chief/2018/new-trooper-contract-widens-pay-gap-as-pba-arbitration-looms/; and City of New York, Office of Labor Relations, DC37 – NYC Memorandum of Agreement, 2017-2021 (accessed March 15, 2019), https://www1.nyc.gov/site/olr/labor/labor-recent-agreements.page.
- This does not include the $880 million in Other Fringe Benefits including workers’ compensation contributions, Federal Insurance Contributions Act (FICA) expenses at all agencies except the LIRR and MNR, expenses for Federal Employees Liability Act and Railroad Retirement Tax payments at the LIRR and MNR, which are similar in nature to Workers’ Compensation and FICA, are also included in this category. See: Metropolitan Transportation Authority, 2019 Adopted Budget February Financial Plan 2019-2022 (February 2019), Accrual Statement of Operations By Category, p. II-3, http://web.mta.info/mta/budget/, and MTA 2019 Final Proposed Budget, November Financial Plan 2019-2022 (November 2018), p. II-23 - II-24, http://web.mta.info/mta/budget.
- New York State Department of Civil Service, Summary of Benefits and Coverage: The Empire Plan: NYS Health Insurance Program (2018), www.cs.ny.gov/employee-benefits/sbc/pdfs/2018/empire-plan-sbc-2018.pdf; EmblemHealth, Summary of Benefits and Coverage: Emblemhealth PPO (2018), www.emblemhealth.com/~/media/Files/PDF/City_State_Federal_Summary_of_Benefits/2018/250_City_of_NY_GHI_CBP_Base_Plan.pdf; and Aetna, Plan Design and Benefit Overview Administered by Aetna Life Insurance Company (prepared for MTA New York City Transit Authority, January 2017), www.aetnanyct.com/application/files/7315/2338/7265/Choice_POS_II_-_Basic.pdf.
- Metropolitan Transportation Authority, email to Citizens Budget Commission staff (April 8, 2019).
- Ranges of represented employee contributions estimated by multiplying lowest, highest, and median hourly rates by 2 percent and by 2,080 hours for respective agencies. Shares of premium assumes employee elected to receive dependent coverage. See: Empire Center, SeeThroughNY Payrolls (accessed March 1, 2019); and New York State Department of Civil Service, Employee Benefits Division, NYSHIP Rates and Deadlines for 2017 (November 2016), www.cs.ny.gov/employee-benefits/nyship/shared/publications/rates/2017/ny-active-rates-2017.pdf.
- Nonrepresented employees pay 10 percent of premium cost for individual coverage. For family coverage, employees pay 10 percent of the premium cost for individual coverage plus 25 percent of the difference in the premium cost between family and individual coverage.
- Metropolitan Transportation Authority, email to Citizens Budget Commission staff (April 8, 2019).
- According to Empire Center payroll data, hourly MTA workers received $4.02 billion in regular earnings in 2017. See: Empire Center, SeeThroughNY Payrolls (accessed March 1, 2019), www.seethroughny.net/payrolls.
- Total health premiums for represented workers estimated by multiplying number of hourly operational workers in 2017 (53,203) by blended rate of employee health premiums ($18,538). Data provided by the Metropolitan Transportation Authority; and Metropolitan Transportation Authority, MTA 2018 Adopted Budget, February Financial Plan 2018-2021 (February 2018), Baseline Total Full-time Positions and Full-time Equivalents by Function and Occupational Group, p. III-29, http://web.mta.info/mta/budget.
- Testimony of Robert Linn, Commissioner, Mayor’s Office of Labor Relations before the New York City Council Committees on Finance, Civil Service, and Labor (April 1, 2015), https://www1.nyc.gov/assets/olr/downloads/pdf/collectivebargaining/testimony-city-council-with-exhibits.pdf.
- City of New York, Office of Labor Relations, “Healthcare Savings: Healthcare Savings Update” (accessed February 28, 2019), https://www1.nyc.gov/site/olr/labor/labor-health-savings.page; and City of New York, Office of Management and Budget, City of New York Executive Budget Fiscal Year 2015 Message of the Mayor (May 2014), p. 4, https://www1.nyc.gov/site/omb/index.page.
- The Municipal Labor Committee health savings agreement saved $1,319 million in fiscal year 2018 on a base of $11.2 billion in expected fringe benefit costs as of the time of the agreement. See: City of New York, Office of Labor Relations, “Healthcare Savings: Healthcare Savings Update” (accessed February 28, 2019), https://www1.nyc.gov/site/olr/labor/labor-health-savings.page; and City of New York, Office of Management and Budget, City of New York Executive Budget Fiscal Year 2015, Message of the Mayor (May 8, 2014), Five-Year Financial Plan, p. 4, https://www1.nyc.gov/assets/omb/downloads/pdf/mm5_14.pdf.
- Range of savings estimated by multiplying number of retirees receiving medical coverage by the published State retiree annual contribution rates. Low estimate assumes all retirees classified below a final civil service grade of 9 and high estimate assumes all retirees classified at or above a final civil service grade of 10. See: Metropolitan Transportation Authority, Consolidated Financial Statements as of and for the Years Ended December 31, 2017 and 2016 (April 2018), p. 82, http://web.mta.info/mta/budget/; and New York State Department of Civil Service, Employee Benefits Division, NYSHIP Rates and Deadlines for 2017 (November 2016), www.cs.ny.gov/employee-benefits/nyship/shared/publications/rates/2017/ny-active-rates-2017.pdf.
- Metropolitan Transportation Authority, Consolidated Financial Statements as of and for the Years Ended December 31, 2017 and 2016 (April 25, 2018), pp. 45-77, http://web.mta.info/mta/budget/.
- Steven Greenhouse, “Pull of Union In Transit Pact,” New York Times (December 29, 2005), A1, www.nytimes.com/2005/12/29/nyregion/nyregionspecial3/new-york-transit-deal-shows-unions-success-on.html.
- This analysis considers hours and miles of service to be when a vehicle is available to the general public and there is an expectation of carrying passengers, also known as revenue service. Measures used in this analysis are consistent with previous CBC research. See: U.S. Department of Transportation, Federal Transit Administration, National Transit Database (2018), www.transit.dot.gov/ntd/ntd-data; Jamison Dague, Four Things You Should Know About the MTA’s Commuter Railroads (Citizens Budget Commission, April 2018), https://cbcny.org/research/4-things-you-should-know-about-mtas-commuter-railroads-0; and Citizens Budget Commission, Benchmarking Efficiency for the Metropolitan Transportation Authority’s Services (April 2011), https://cbcny.org/research/benchmarking-efficiency-metropolitan-transportation-authoritys-services.
- U.S. Department of Transportation, Federal Transit Administration, National Transit Database (2018), "2017 Annual Database Operating Expenses," www.transit.dot.gov/ntd/data-product/2017-annual-database-operating-expense.
- Assumes vehicle revenue hours remain constant, and maintenance hours are reduced to match median productivity. A 20 percent reduction applied to an estimated total of $2.46 billion in total pay and fringe benefits related to vehicle and nonvehicle maintenance results in estimated savings. See: U.S. Department of Transportation, Federal Transit Administration, National Transit Database (2018), "2017 Annual Database Service," "2017 Annual Database Operating Expenses," and "2017 Annual Database Transit Agency Employees," www.transit.dot.gov/ntd/ntd-data.
- New York bus productivity aggregates service and labor data from buses operated by NYCT and MTA Bus Company.
- Assumes vehicle revenue hours remain constant, and total hours are reduced to match median productivity. A 15 percent reduction in an estimated $2.95 billion in total pay and fringe benefits results in estimated savings. See: U.S. Department of Transportation, Federal Transit Administration, National Transit Database (2018), "2017 Annual Database Service," "2017 Annual Database Operating Expenses," and "2017 Annual Database Transit Agency Employees," www.transit.dot.gov/ntd/ntd-data.
- Assumes vehicle revenue hours remain constant, and total hours at LIRR are reduced to match MNR productivity. A 9 percent reduction in an estimated $943.5 million in total pay and fringe benefits results in estimated savings. See: U.S. Department of Transportation, Federal Transit Administration, National Transit Database (2018), "2017 Annual Database Service," "2017 Annual Database Operating Expenses," and "2017 Annual Database Transit Agency Employees," www.transit.dot.gov/ntd/ntd-data.